
December 26, 2023
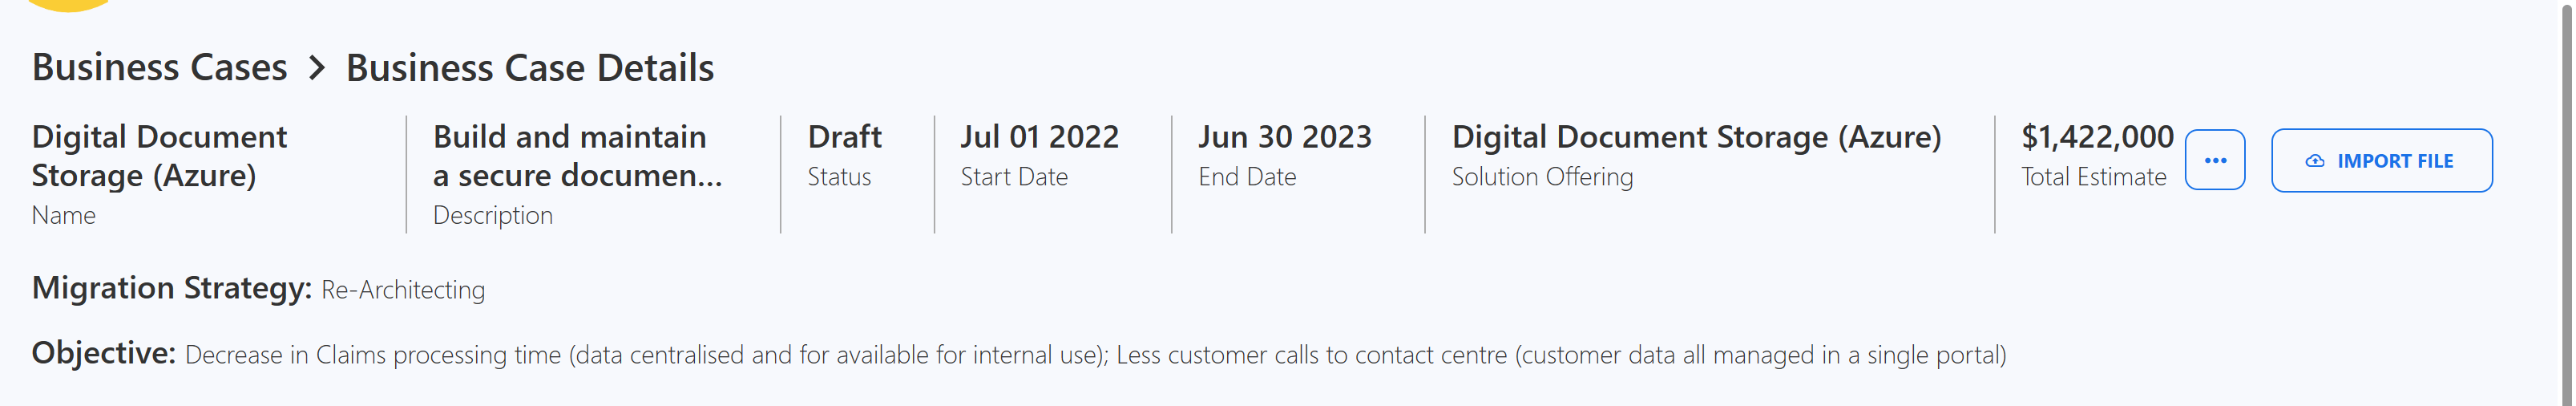
We have cleaned up the UX on our business case headers to make it more readable.
December 19, 2023
Customers can now select to be hosted on AWS in addition to Azure.
December 12, 2023
The monthly chargeback report can now be directly extracted to your specified S3 bucket. A separate menu item named Export to S3 Bucket is introduced on the Chargeback screen. This option only becomes available once the chargeback is approved for a month. The export destination is determined by the S3 bucket that you have configured. The default exported file name format is "yarken_chargekback_yyyymmddhhmmss.xlsx.
December 5, 2023
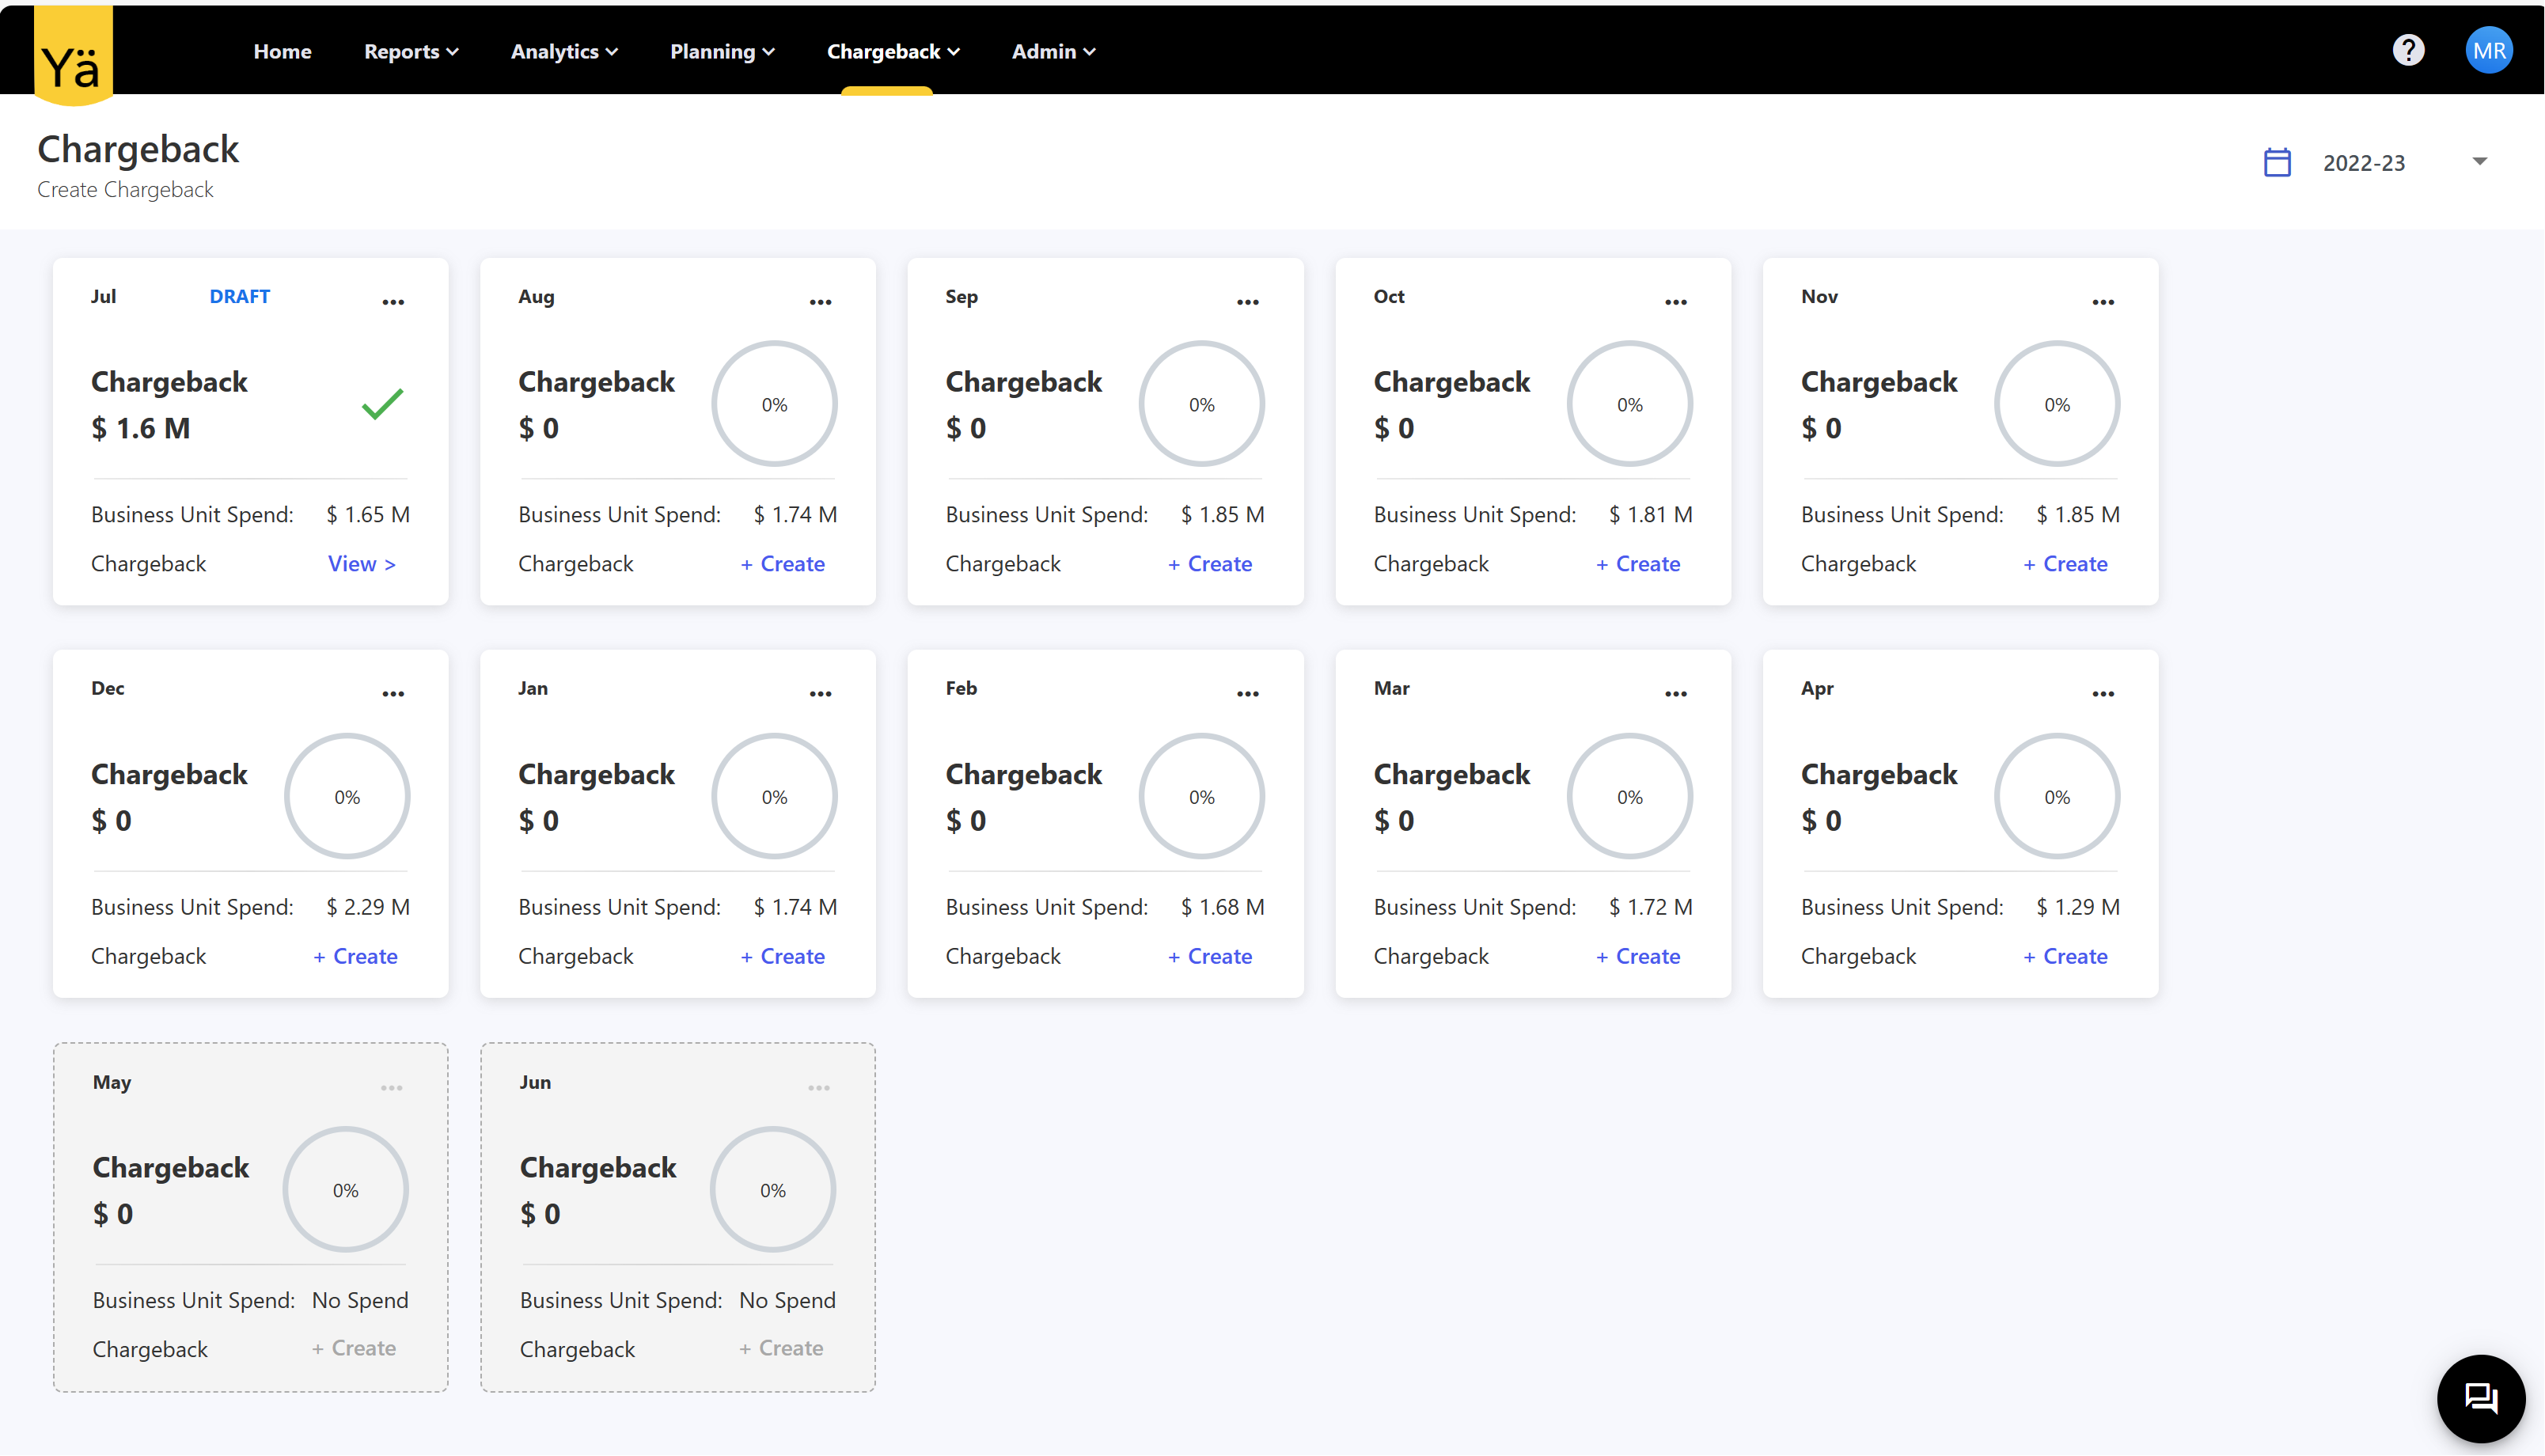
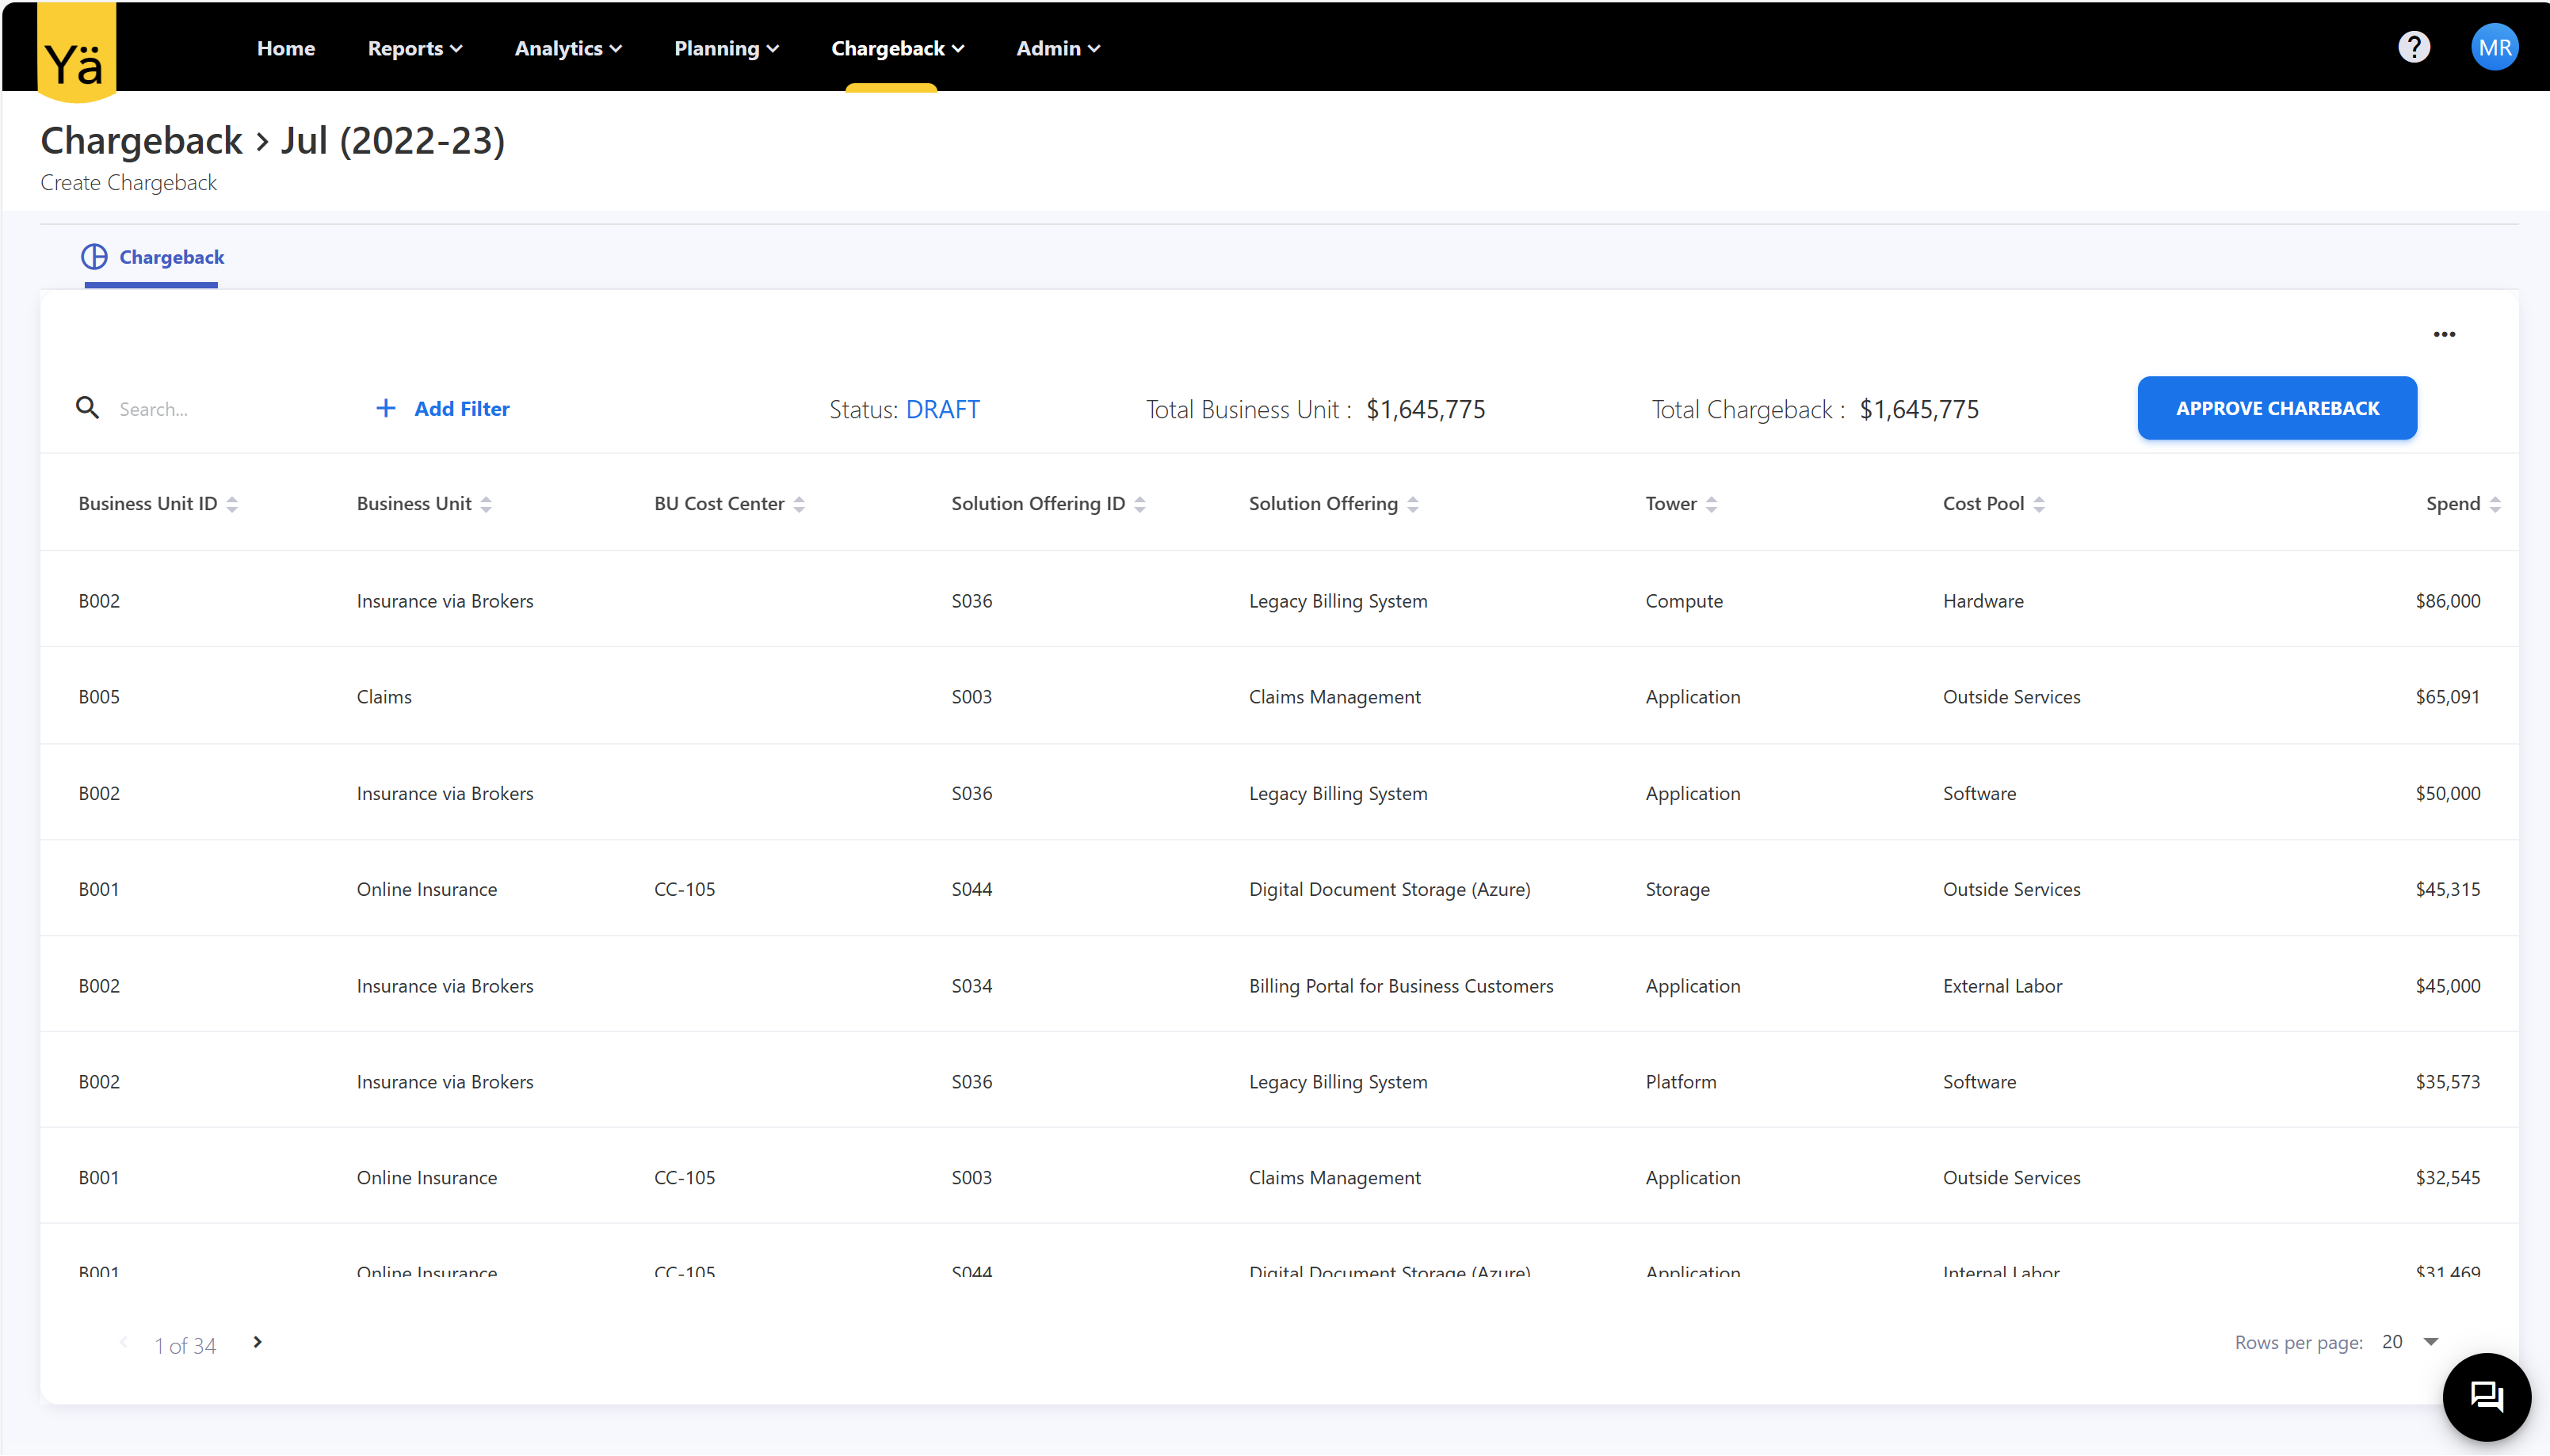
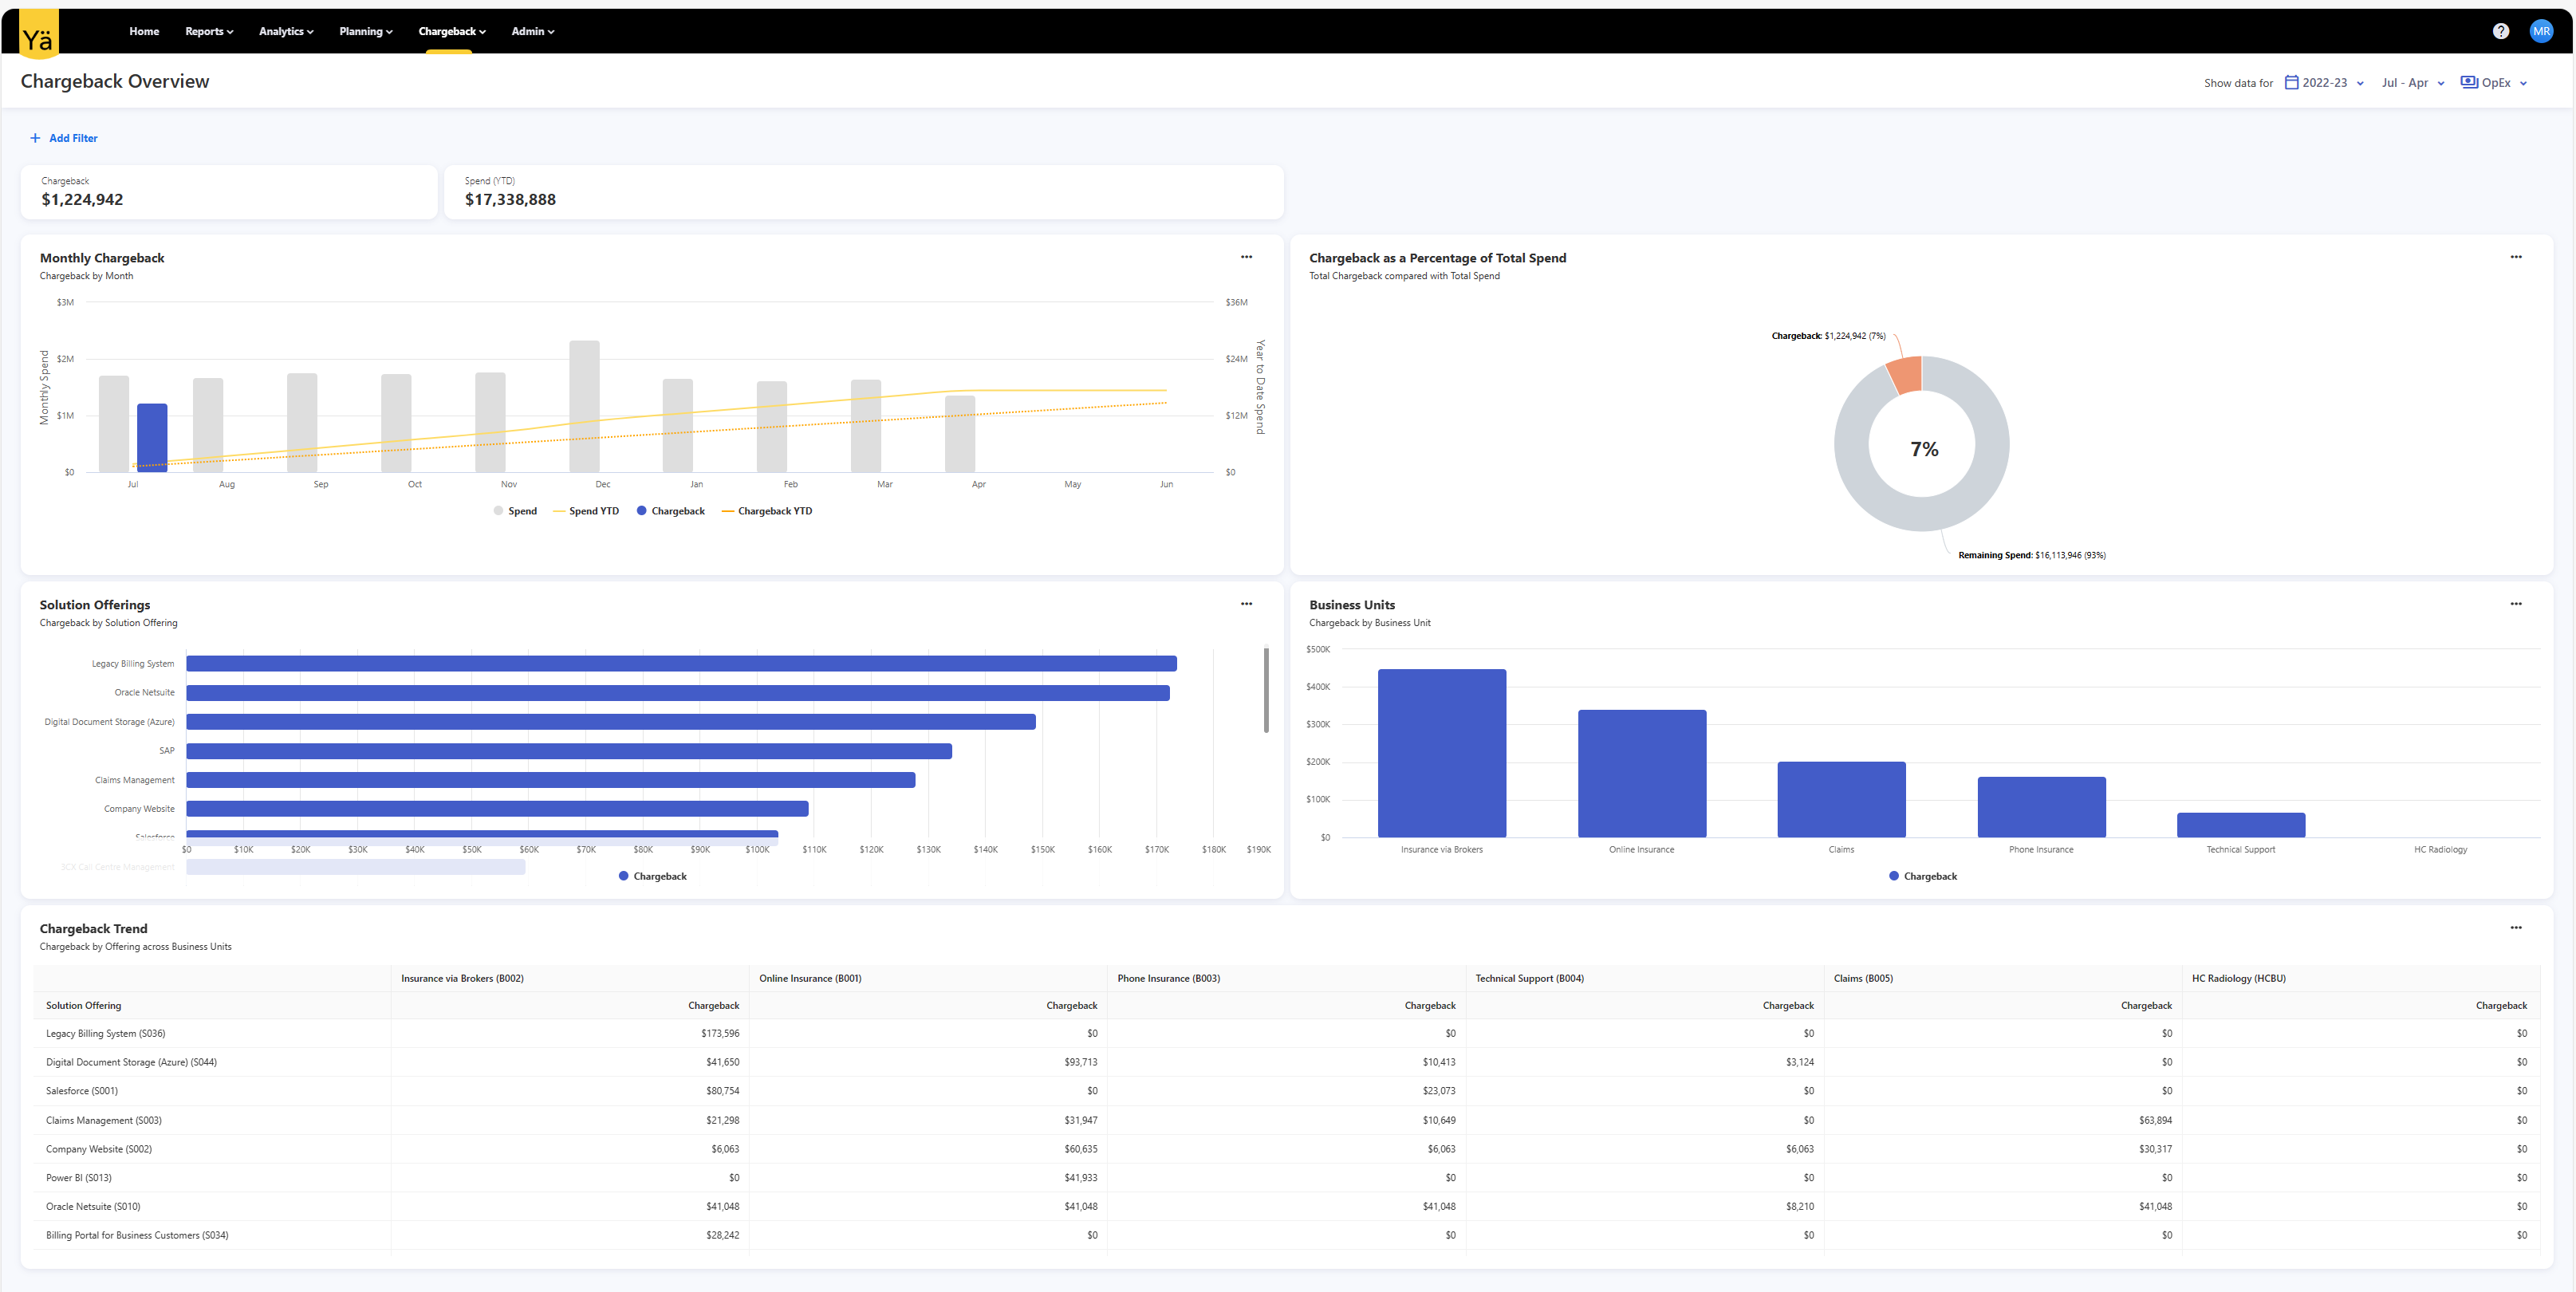
Charge back is now available for use! Admins can now create the format for a chargeback file and initiate the chargeback process. Once a chargeback has been initiated the data in the month is locked and cannot be changed anymore.
November 28, 2023
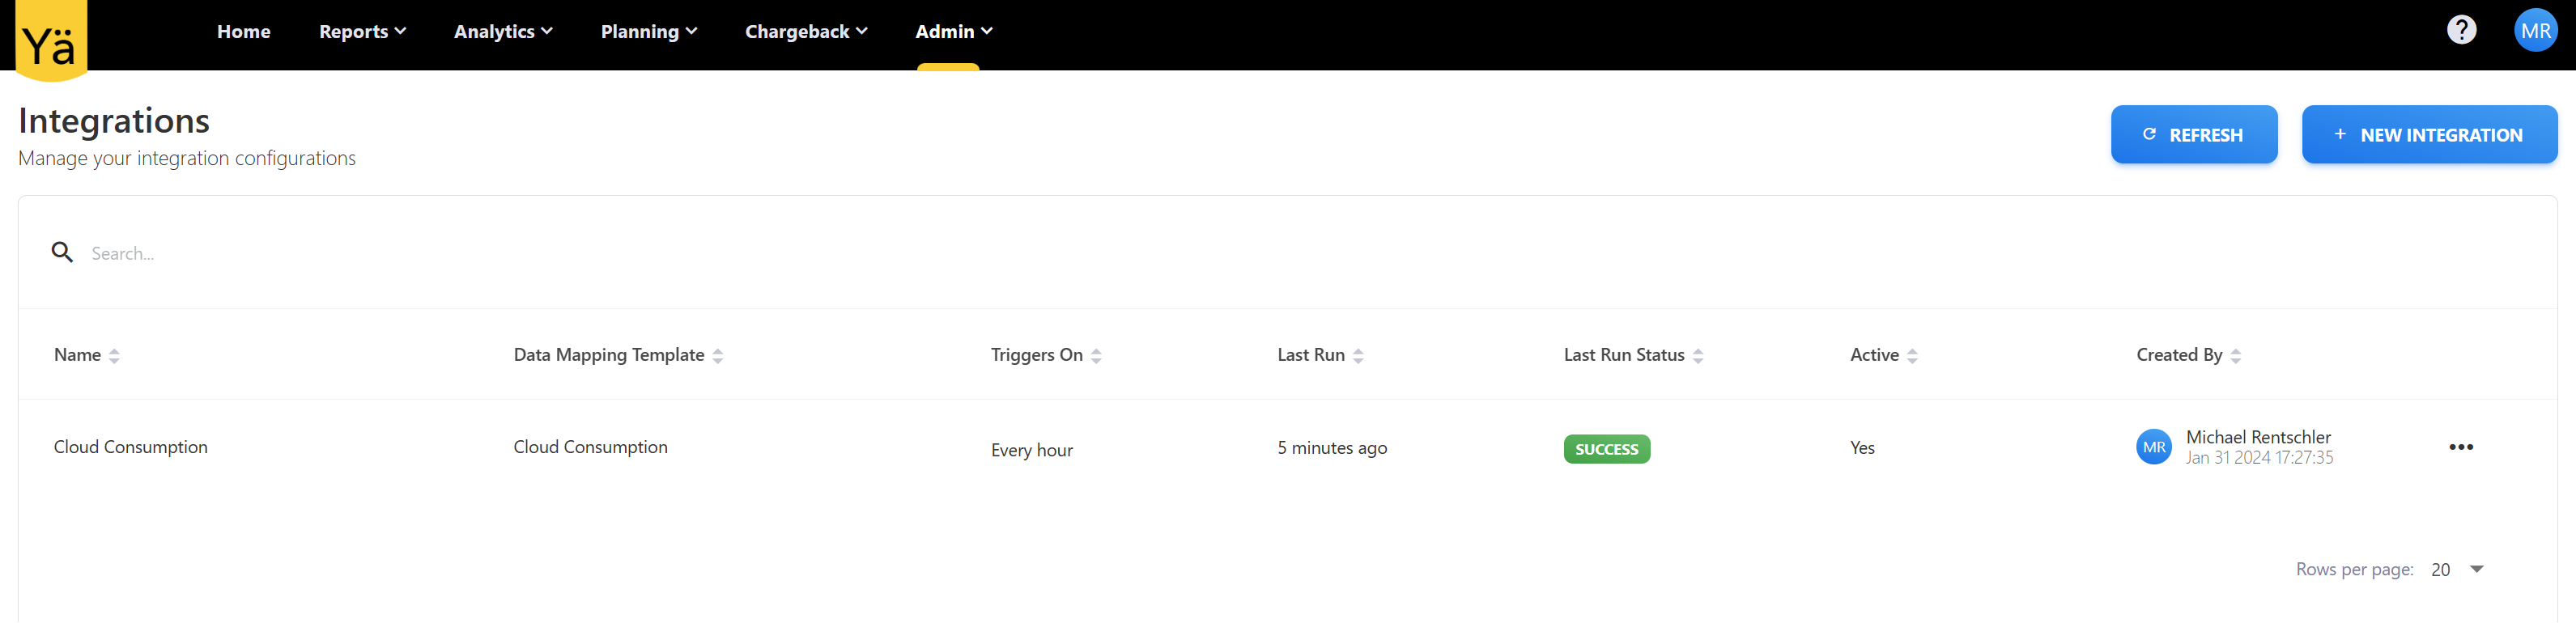
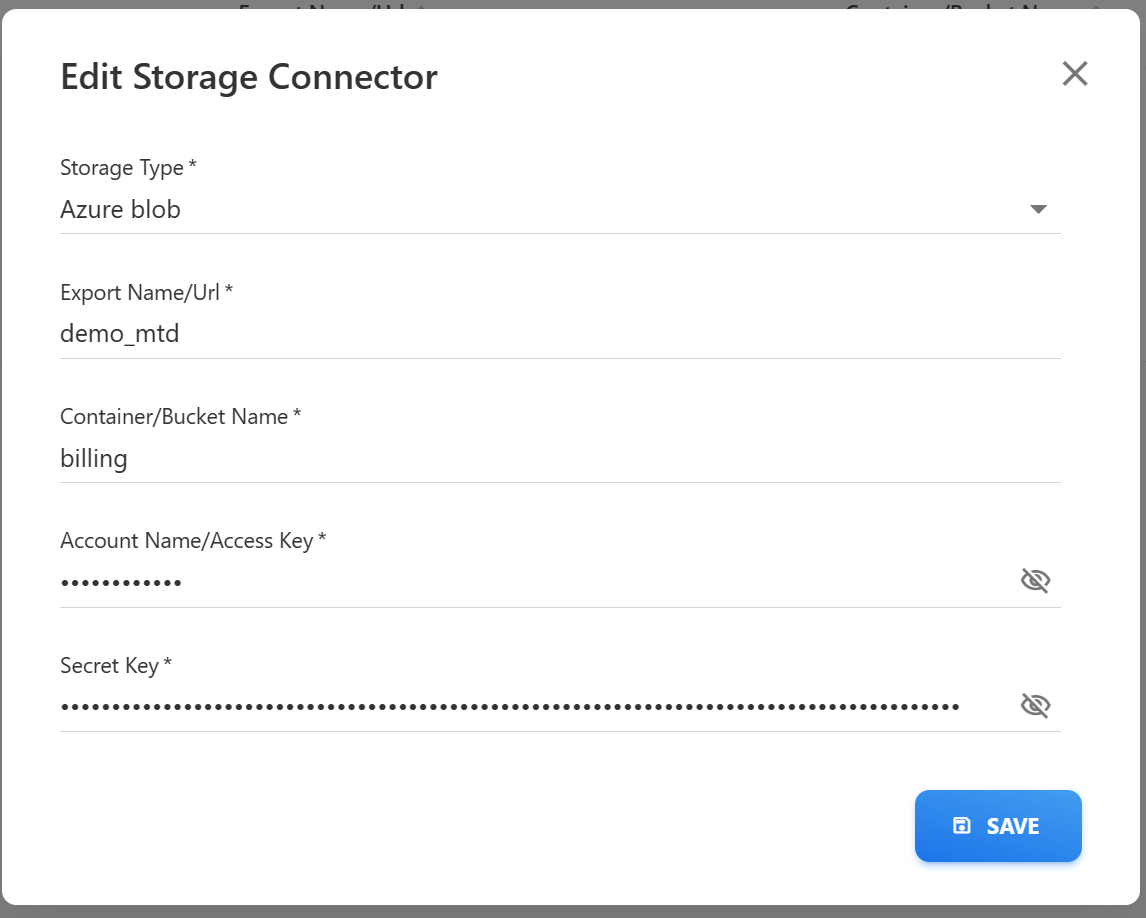
Introduction of Automation capabilities. Users can now store data mappings and use these to set up an automated process to ingest data from an S3 bucket or a Azure blob storage.
November 21, 2023
Business Case can now be compared against actuals that have been tagged against the business case
November 14, 2023
Homepage now has additional widgets aligned with the licensable features in yarken
Business Case Feature
November 7, 2023
Support for AWS CUR Files
October 31, 2023
Cost Transparency (prior year) dashboard uses prior year data as baseline.
Tags can be extracted from cloud spend and usage files.
October 24, 2023
Asset Rules
New capability to create Asset to Asset relationships by the use of rules. Currently still limited to cloud assets.
October 17, 2023
Cloud Consumption file can be imported in to an empty system. Master data can be created as part of the import.
Applications, Products and Services can be populated from a tag
October 3, 2023
Cloud Consumption data is now available for analysis in the Cube.
September 26, 2023
FOCUS 0.5
Ability to ingest a FOCUS 0.5 aligned spend files as a spend source.
September 12, 2023
Spend allocation to assets is now preventing overallocation by checking that the fully allocated spend portion is never greater then 1.
September 5, 2023
Minor UX improvements to increase usability, i.e. re-ordering of menu items to reflect the most common workflow steps.
August 22, 2023
Capabilities
The concept of capabilities has been removed from the product. Terminology was to ambiguous and caused confusion.
August 15, 2023
User Management in YÄRKEN
User can now be managed in YäRKEN. New users can either be added manually or a tenant can be configured to allow access to all users for the active directory tenant. Roles and permissions can either be assigned in YäRKEN or in the active directory.
Assets and Asset Mapping Maintenance
If assets and relationships are maintained they can simply be copied from one month to next.
August 8, 2023
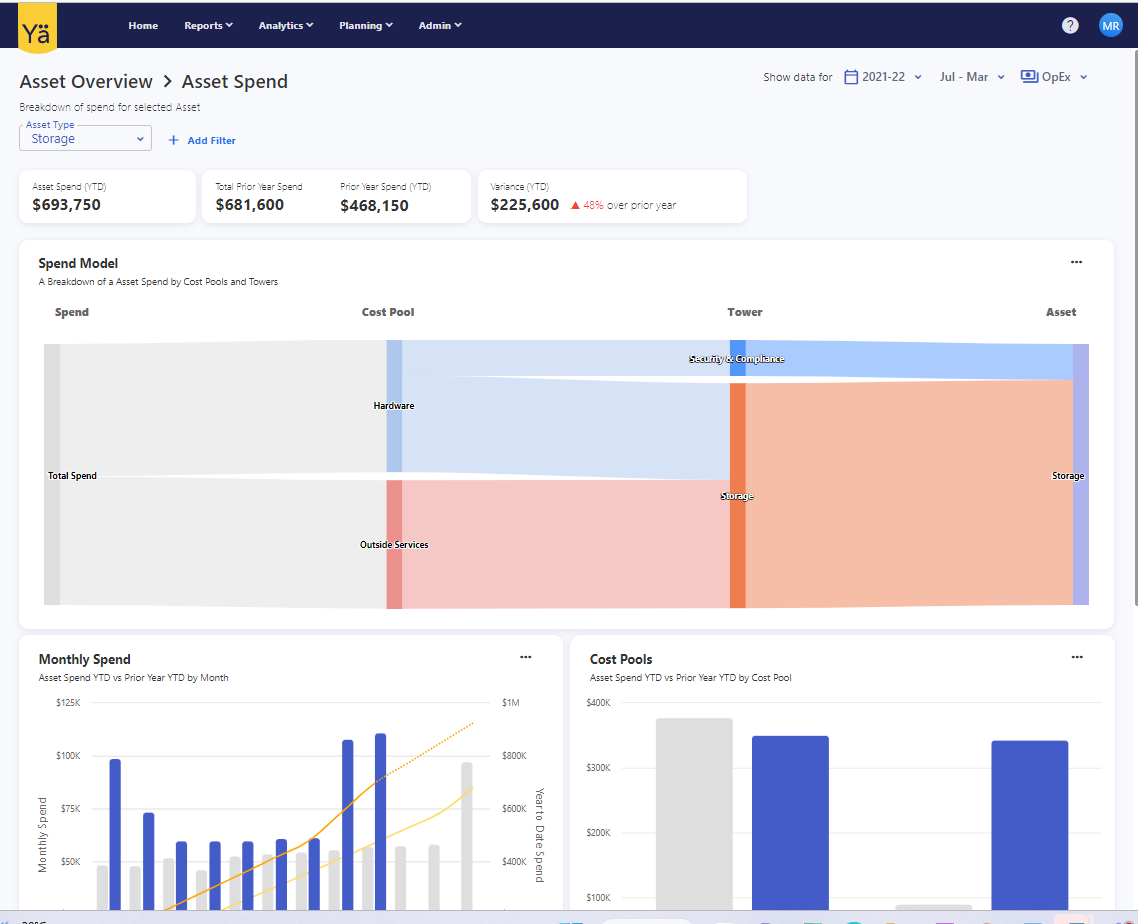
Asset TCO Cube
We have introduced Asset TCO reporting, a new cube for tracking asset spend and distribution. With the new cube, users can quickly analyze spend by cost centers, towers, applications, products, services, and other asset types. This cube empowers users to generate customized reports by utilizing the "From Asset Types" and "To Asset Types" fields. These fields allow users to identify the asset spend distribution at the source and destination levels. Asset TCO provides a comprehensive view of spend across all asset types.
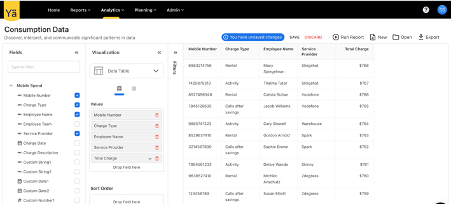
Consumption Data Cube
We have introduced a new Consumption Data cube in the Analytics menu that allows you to track and analyze mobile consumption data over given timeframe. You can create custom reports based on a specific mobile number, charge date, charge type, charge description, employee, and service provider. The new reporting helps you to understand mobile consumption trends and optimize mobile expenses.
This cube offers the flexibility to create mobile consumption reports that meet your specific requirements. You can choose to focus on a specific time period, a particular charge type, or look into individual employee mobile expenditures.
August 1, 2023
Cost Explorer
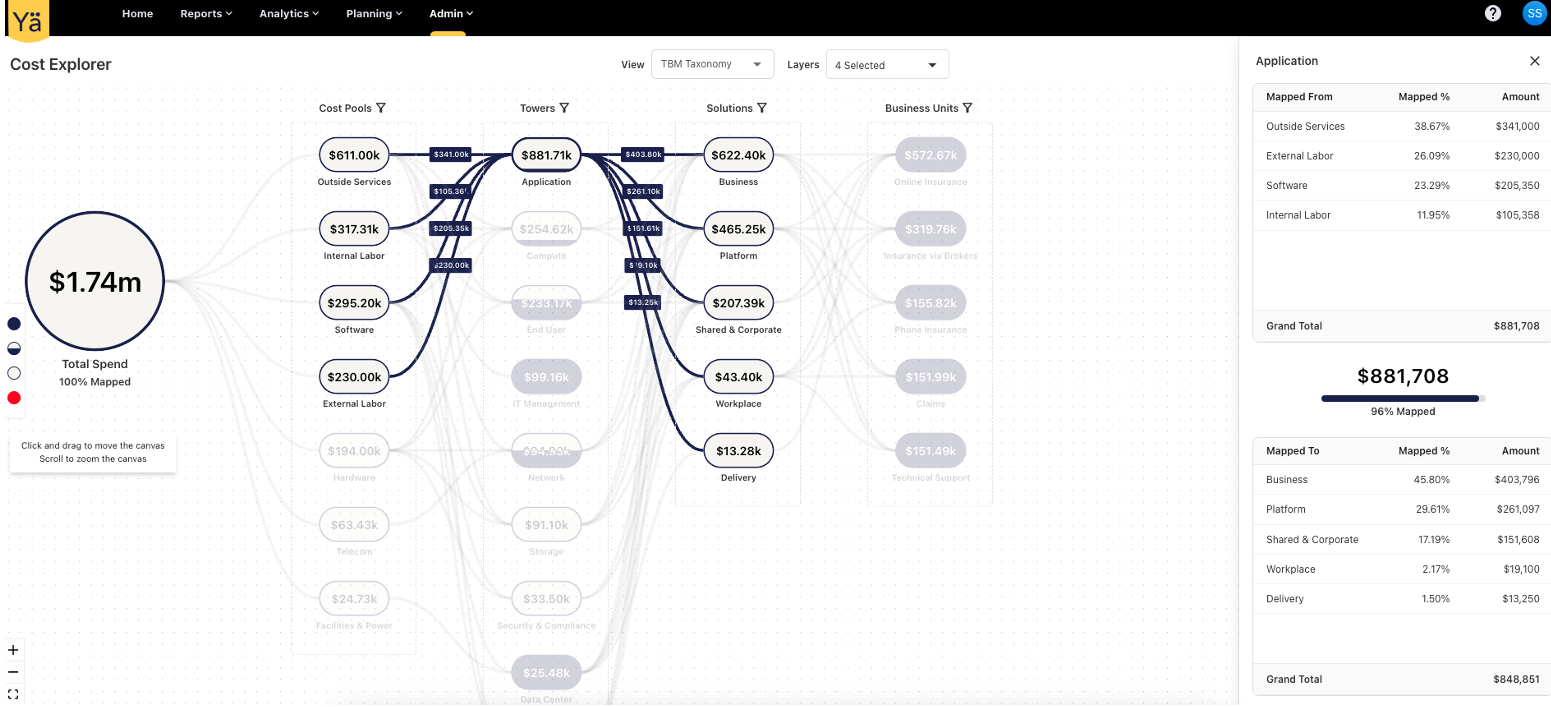
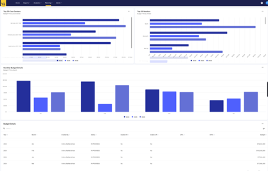
We have introduced the Cost Explorer, an advanced and interactive dashboard in this release. The Cost Explorer is intended to show an interactive visualization of cost distribution based on the TBM Taxonomy. The explorer is based on the cost transparency model and displays the breakdown of total spend into different layers in the TBM Spend Model. With the cost explorer, you can now perform a comprehensive cost analysis to understand the spend pattern, identify cost drivers and areas for optimization.
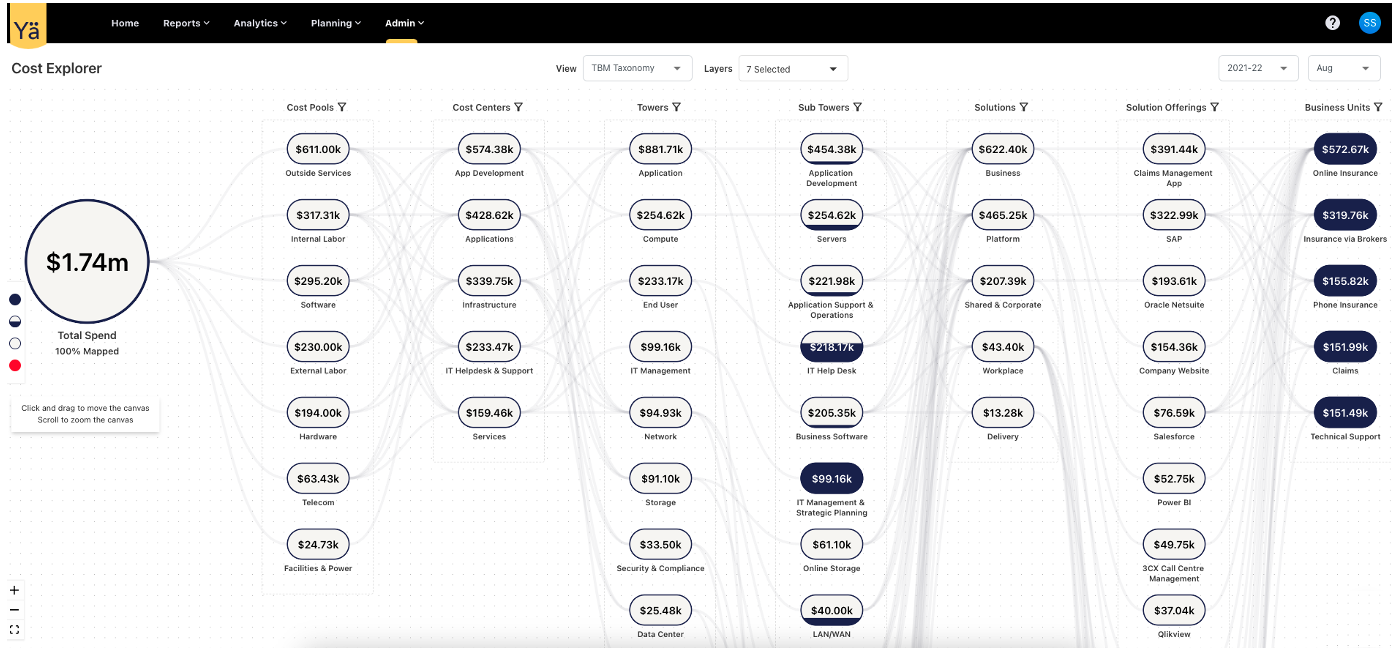
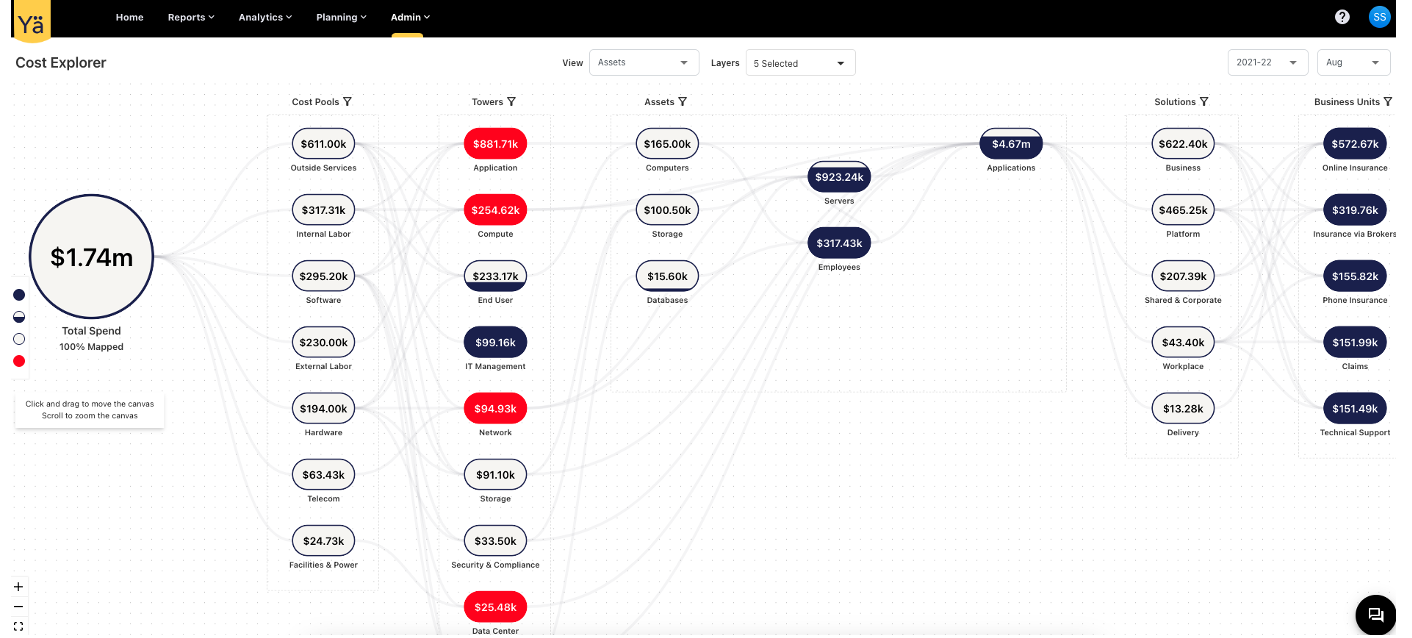
The cost explorer consolidates spend-related data and categorizes it into multiple layers. The explorer displays the spend data in the TBM Taxonomy and Assets view. Users can add different layers to check the distribution at a more detailed level. Each layer contains additional filters to check the distribution of a specific cost element. The cost elements in different layers are interconnected with lines. On hovering over these lines, they show the incoming and outgoing spend between the two layers.
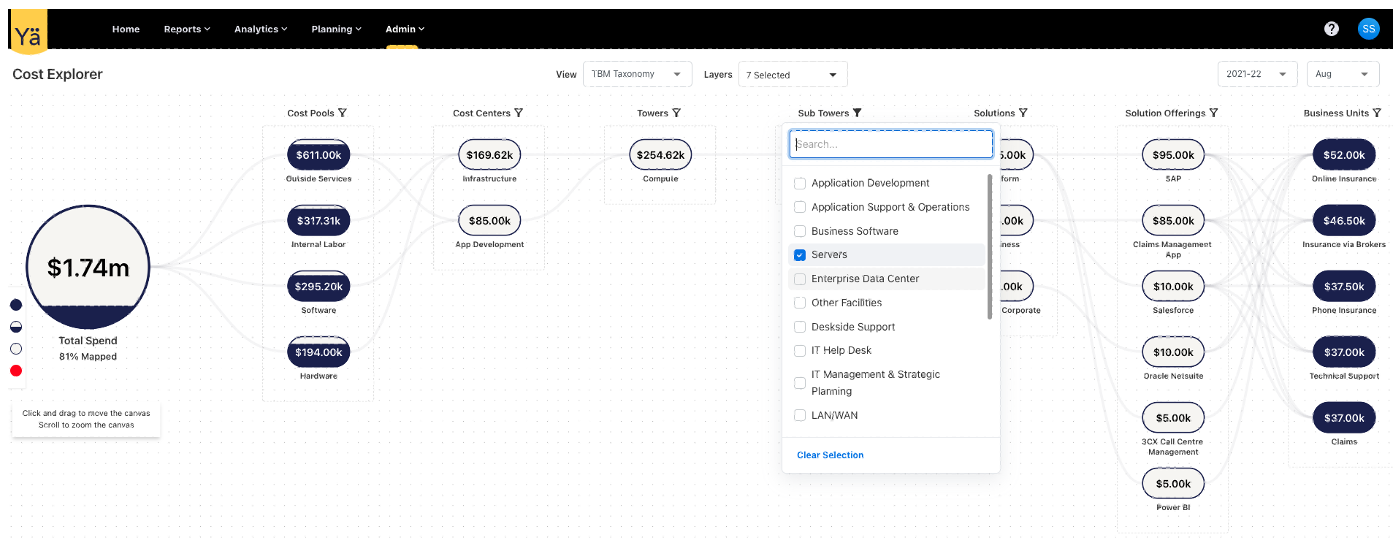
The cost distribution level is shown in several visual color shades. The grey color indicates fully mapped spend, the blue color represents unmapped spend, and the red color represents over mapped spend. This visual representation makes it easier to identify the distribution.
We have also enabled the side drawer to check the detailed breakdown of spend. The drawer contains the comprehensive cost flow in tabular form. When the cost element is clicked, the side drawer appears. It contains fields such as Mapped From, Mapped To, Mapped %, Amount, and Grand Total. The upper table represents the incoming spend distribution, while the lower table denotes the outgoing spend distribution.
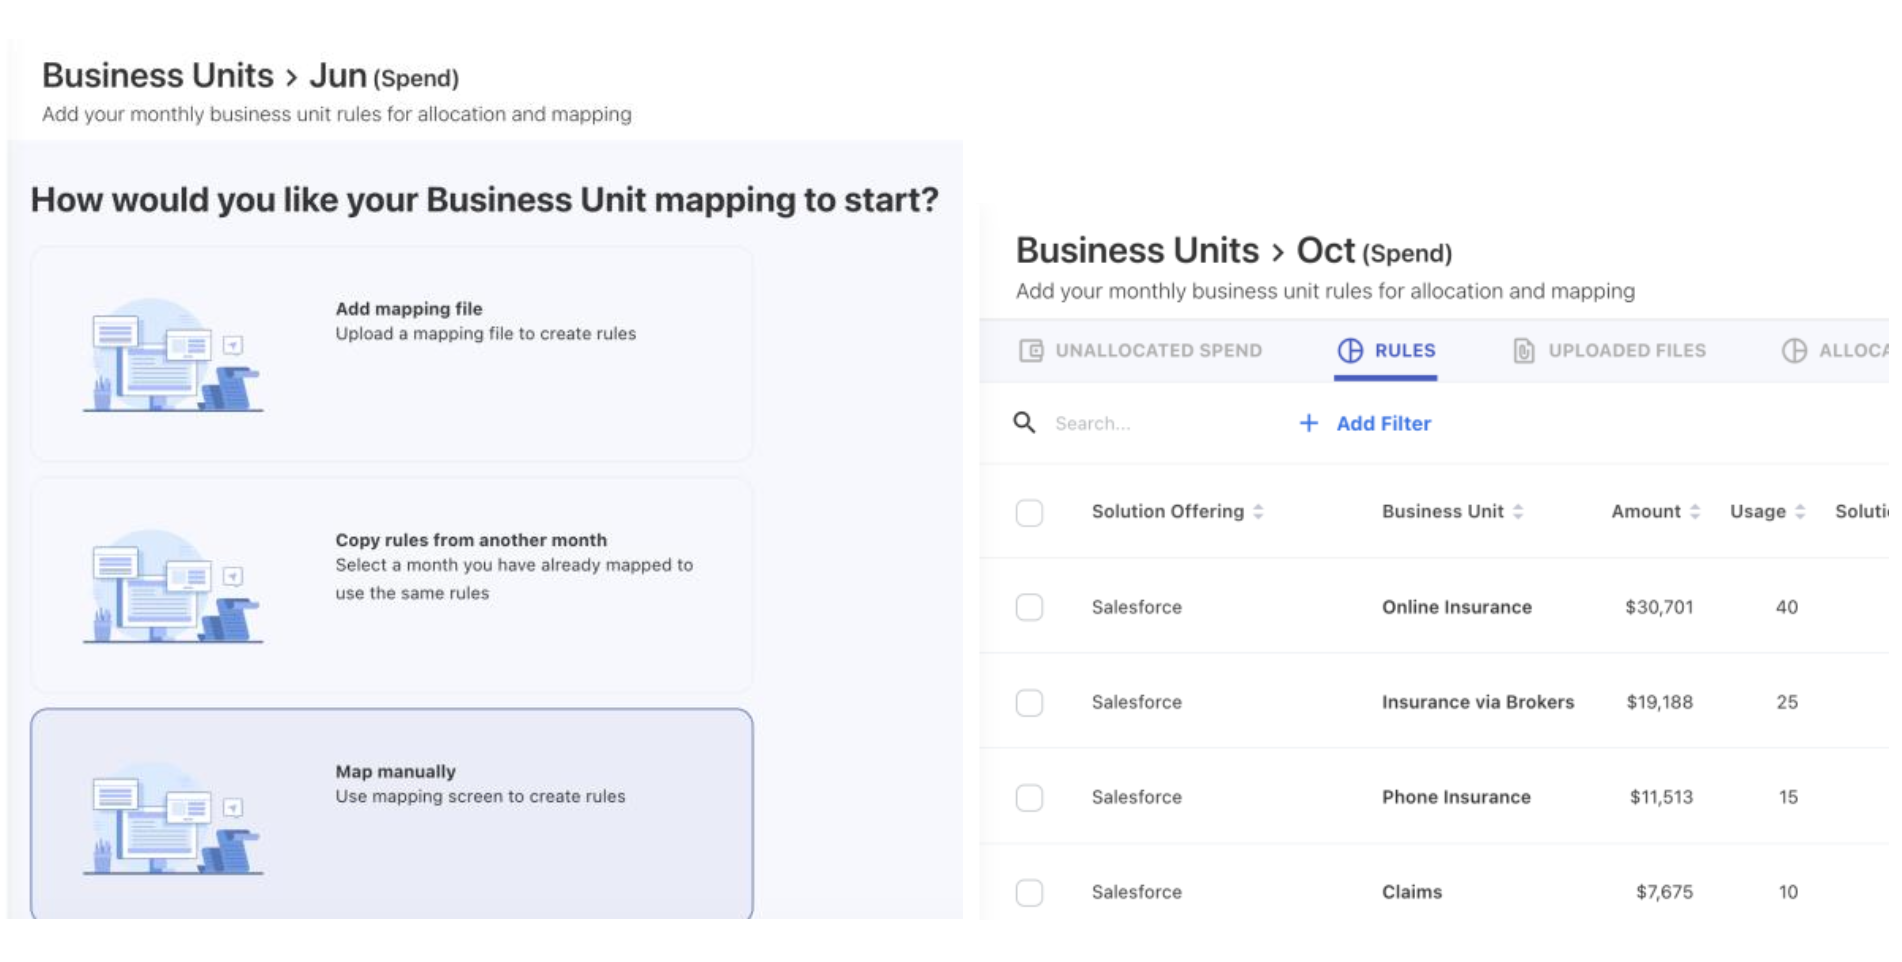
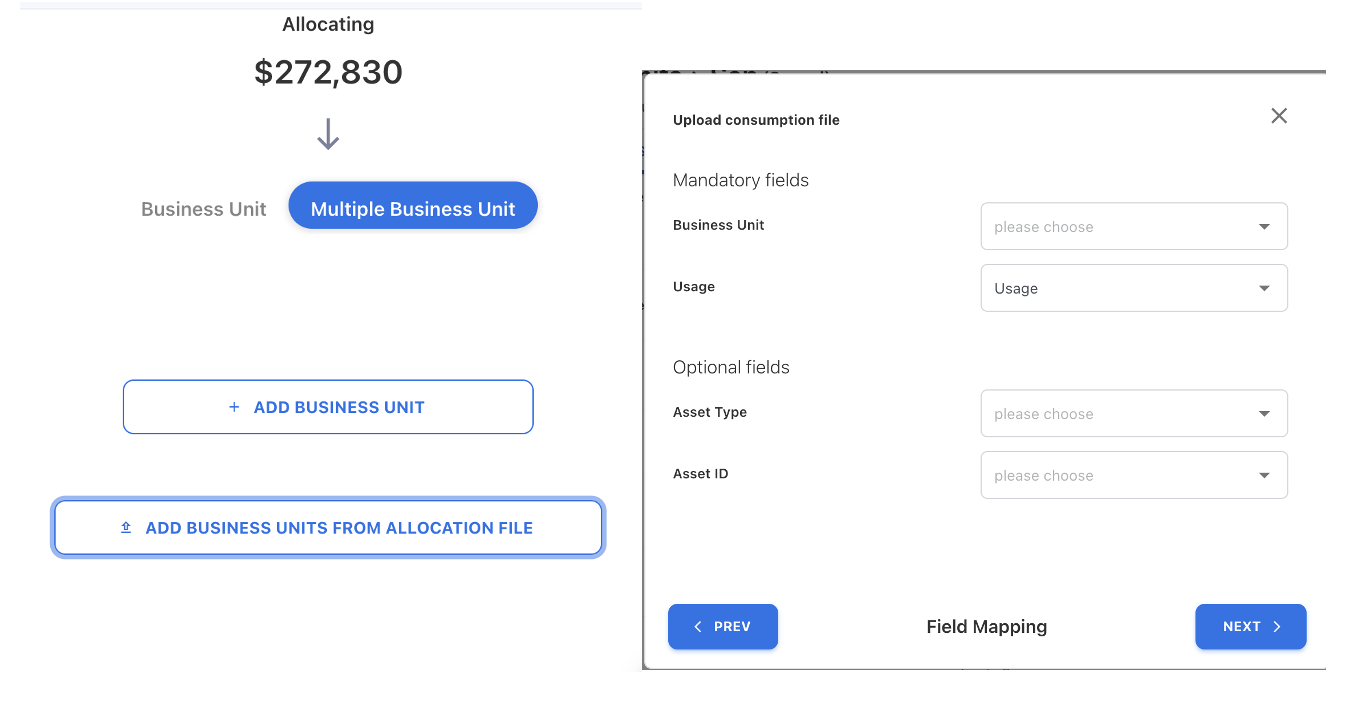
A UI for mapping Business Units (BU) to Solution Offerings has been enabled. Users can now add monthly business unit rules for allocation and mapping. This new enhancement allows users to understand how business units consume solution offerings.
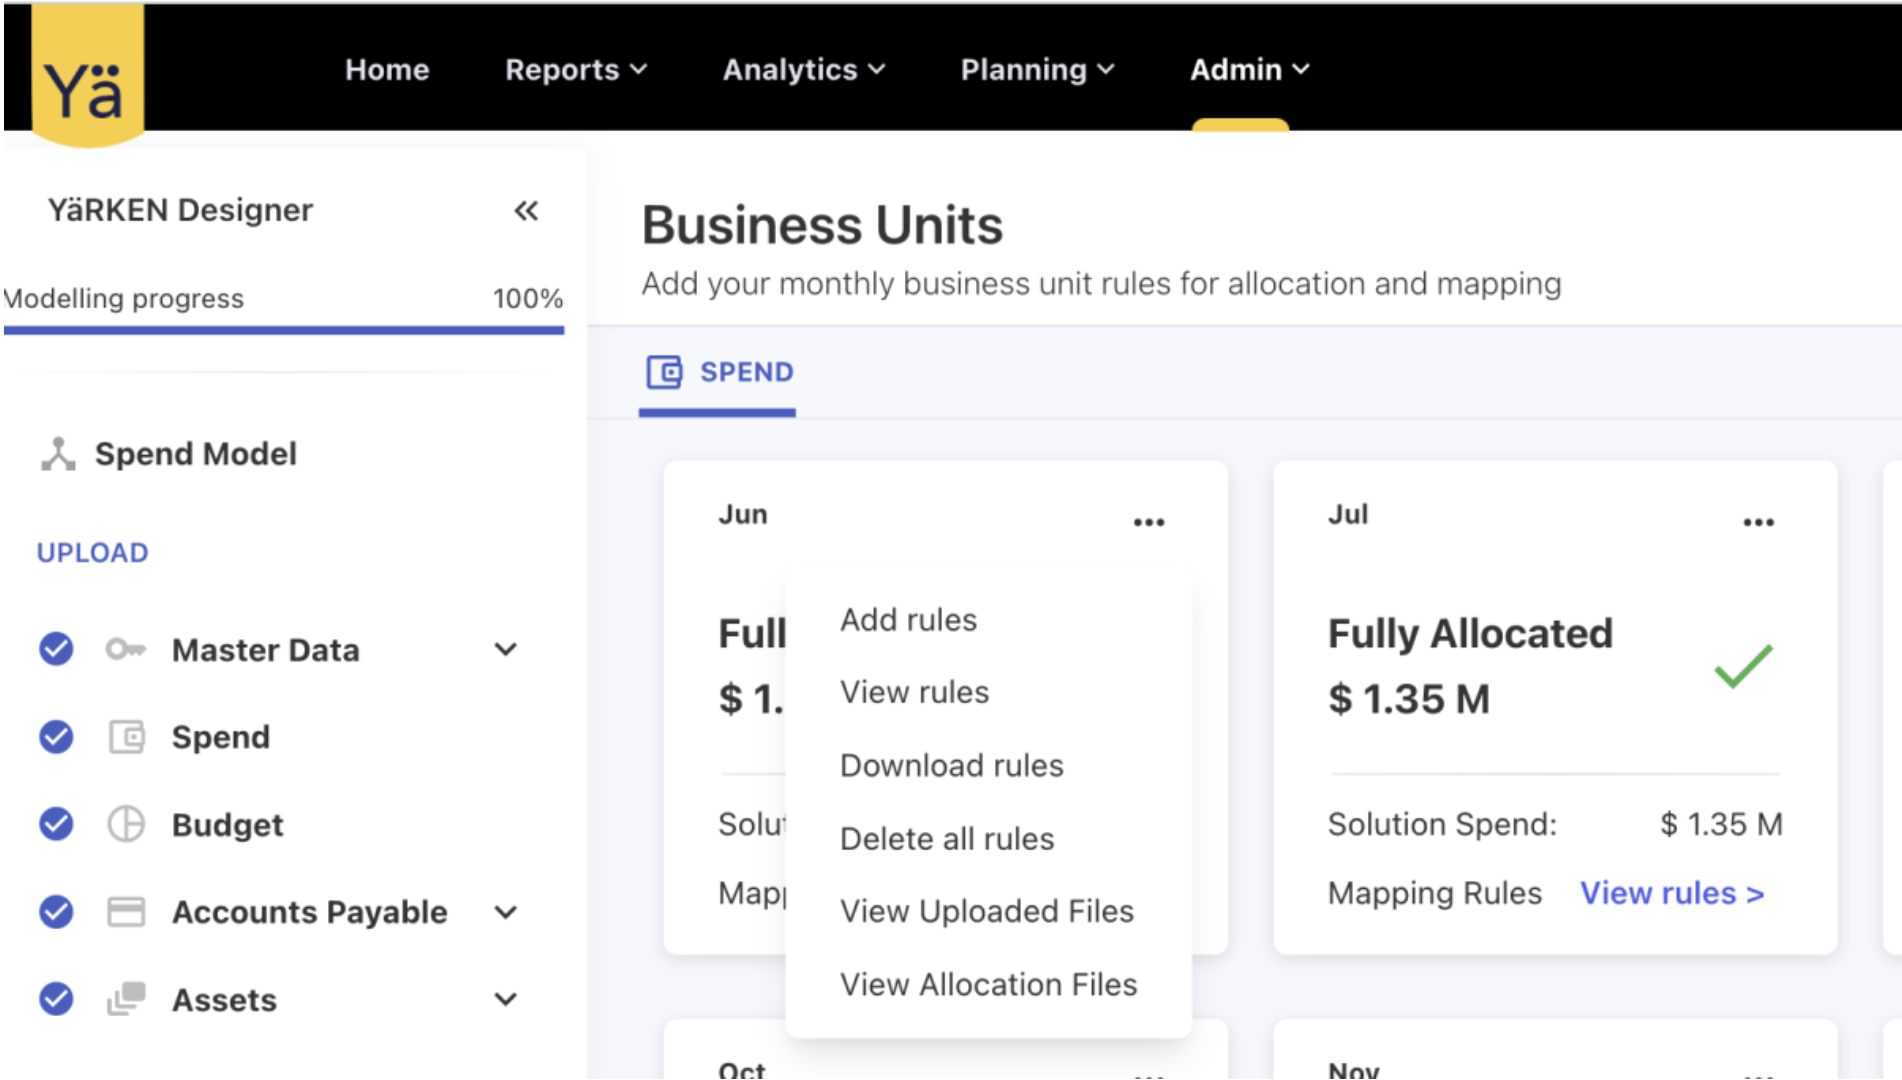
Admin users can utilize the Add Rule page to load a Business Unit consumption file. BU mapping can be performed using three methods. The mapping methods include Add mapping file, Copy rules from another month, and Map manually. The RULES tab displays a list of all rules that have been assigned to business units. To ensure data accuracy and avoid duplicate entries, the feature implements a unique check and prevents the creation of rules with identical information. The application offers the flexibility to copy BU consumption rules from an already mapped month and apply them to the desired month.
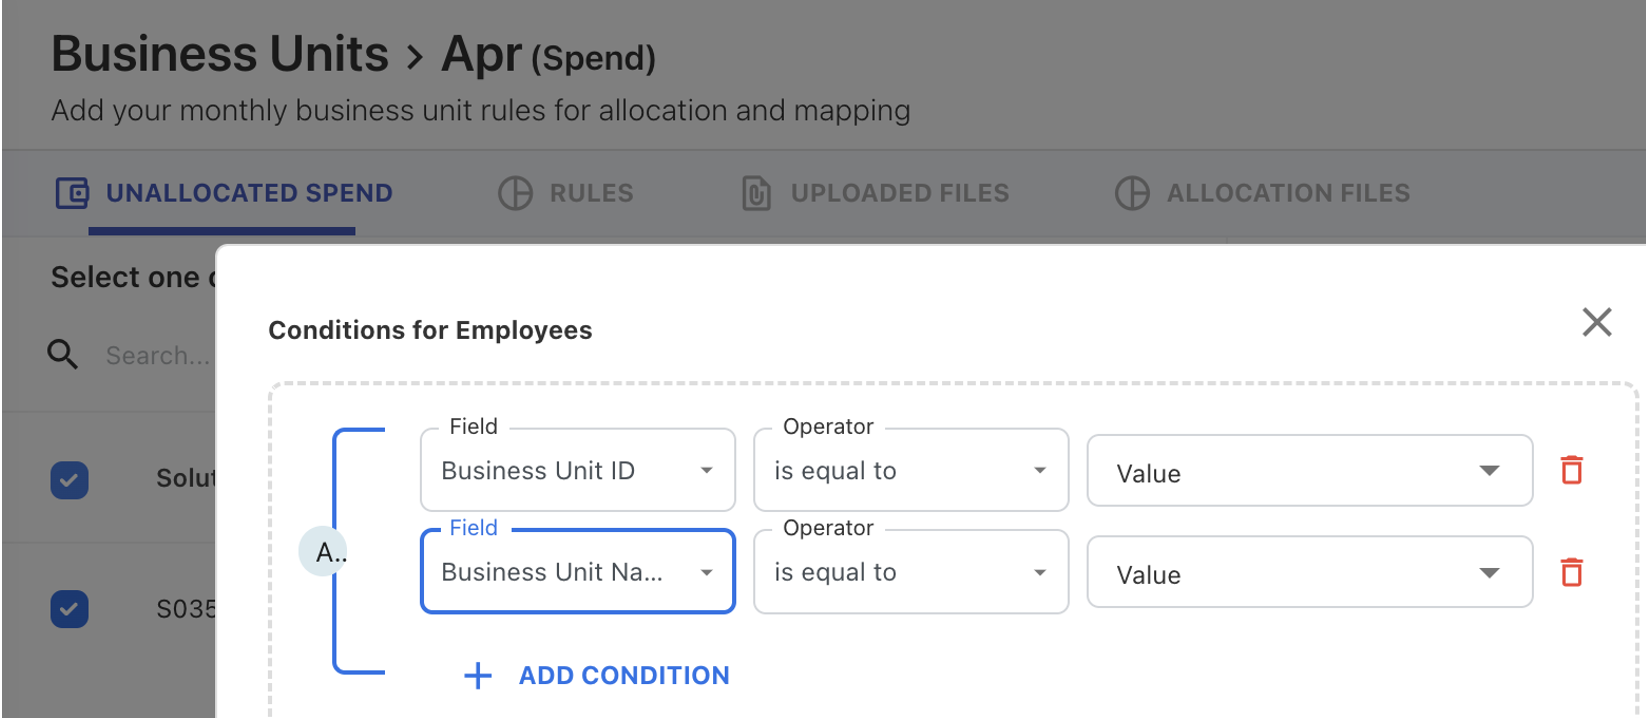
The user can allocate Business Unit (BU) spend to assets and gain additional insights into who consumes IT services on the BU side. It lets users to allocate spend to specific assets within BU. We now only enable spend distribution to the Employees asset type. Users can split the allocation equally across assets or by any numeric value (By Weight). To further customize the allocation, user can use the + ADD CONDITIONS option.
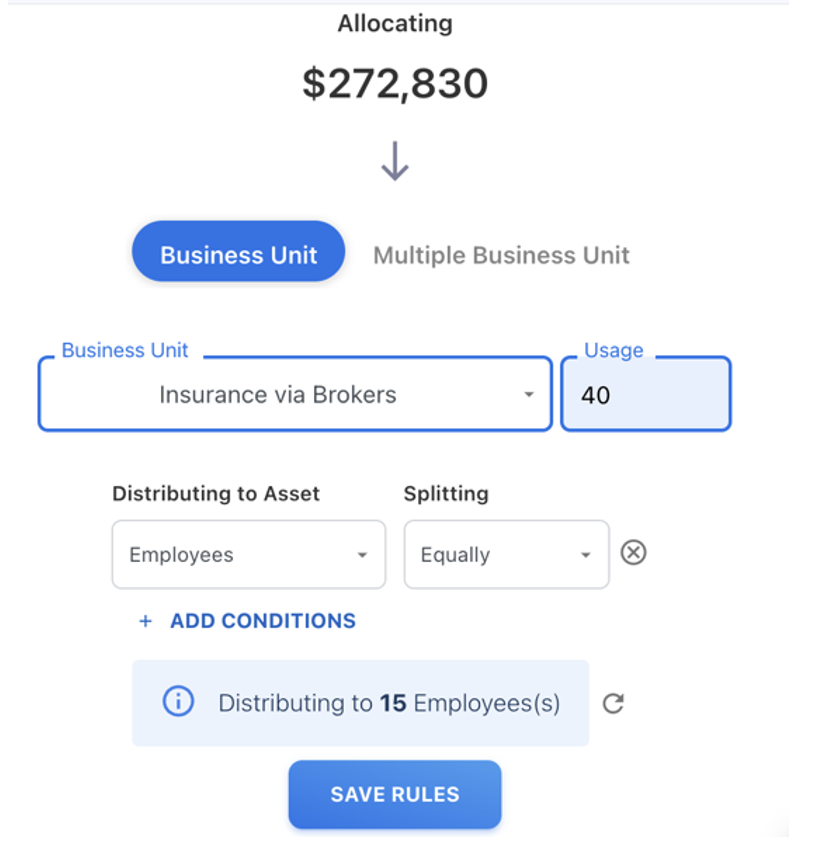
The user can use the allocation file to distribute the solution spend to multiple business units and assets. The distribution is based on the usage value and asset specified in the consumption file.
Employees Asset
New fields Business Unit ID and Business Unit Name are added to the Employees asset. These additional fields are now available in the Analytics Employee cube, and the existing data templates are updated to show these new fields. Users can now conveniently associate each employee with their relevant business unit details.
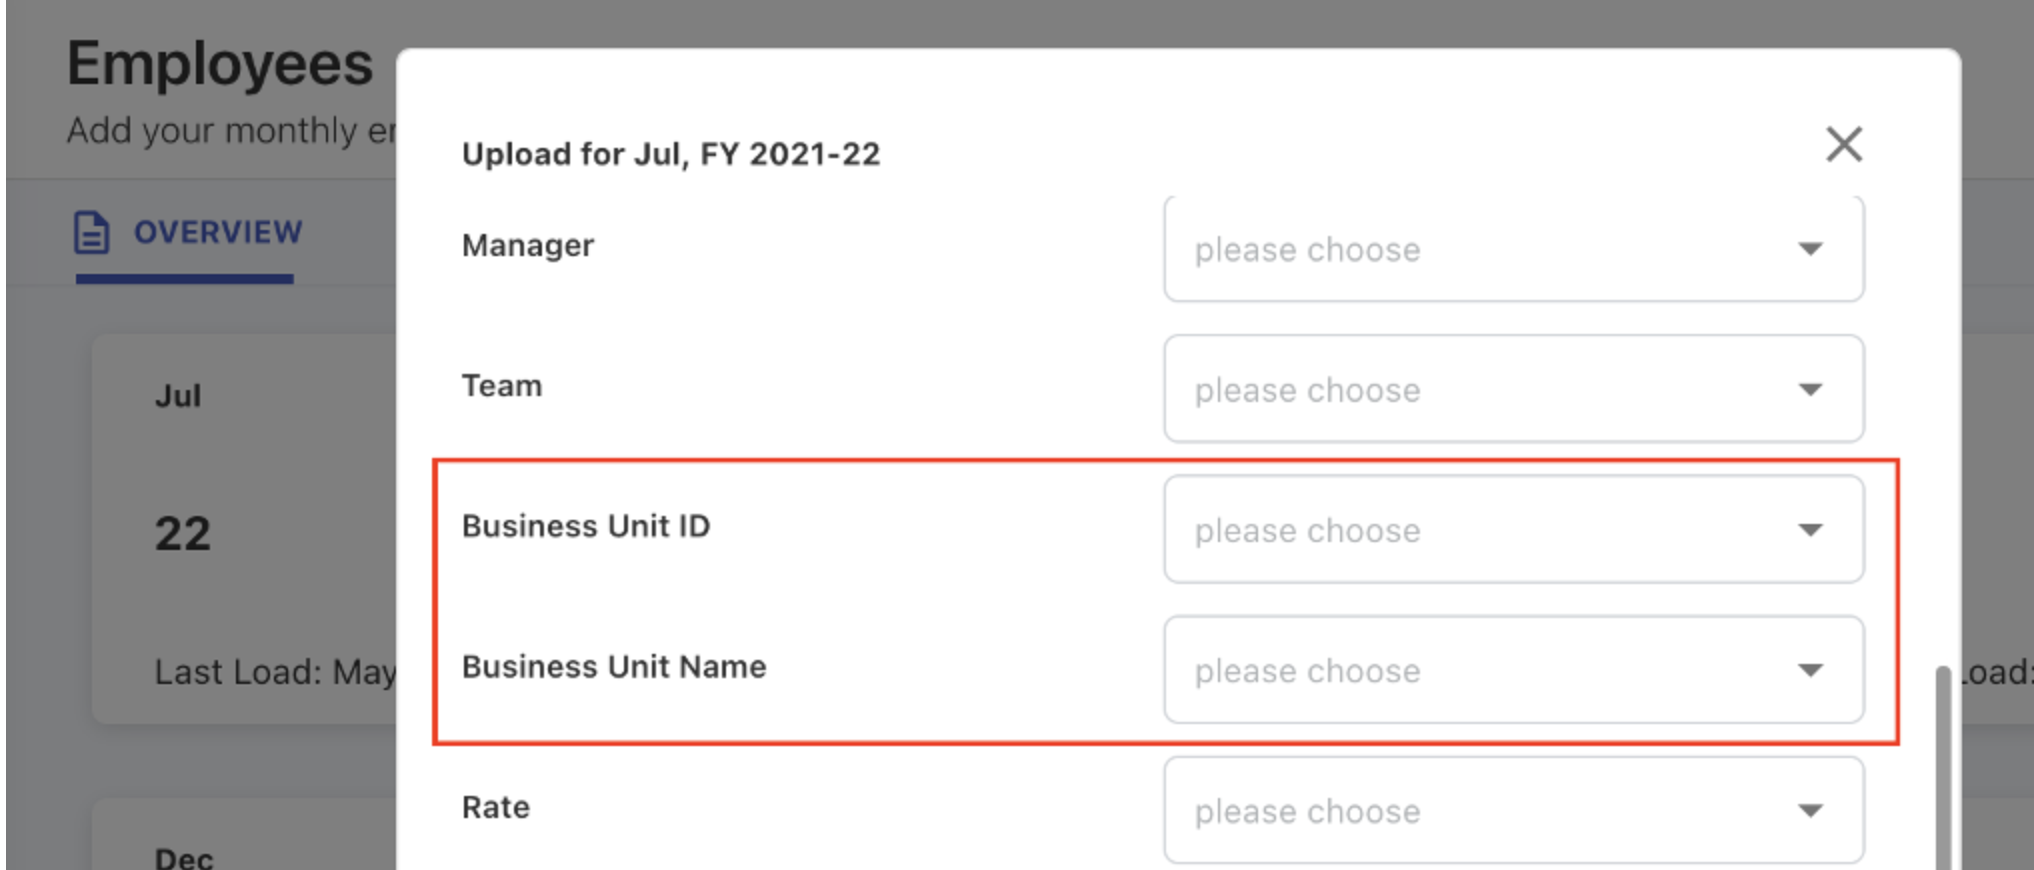
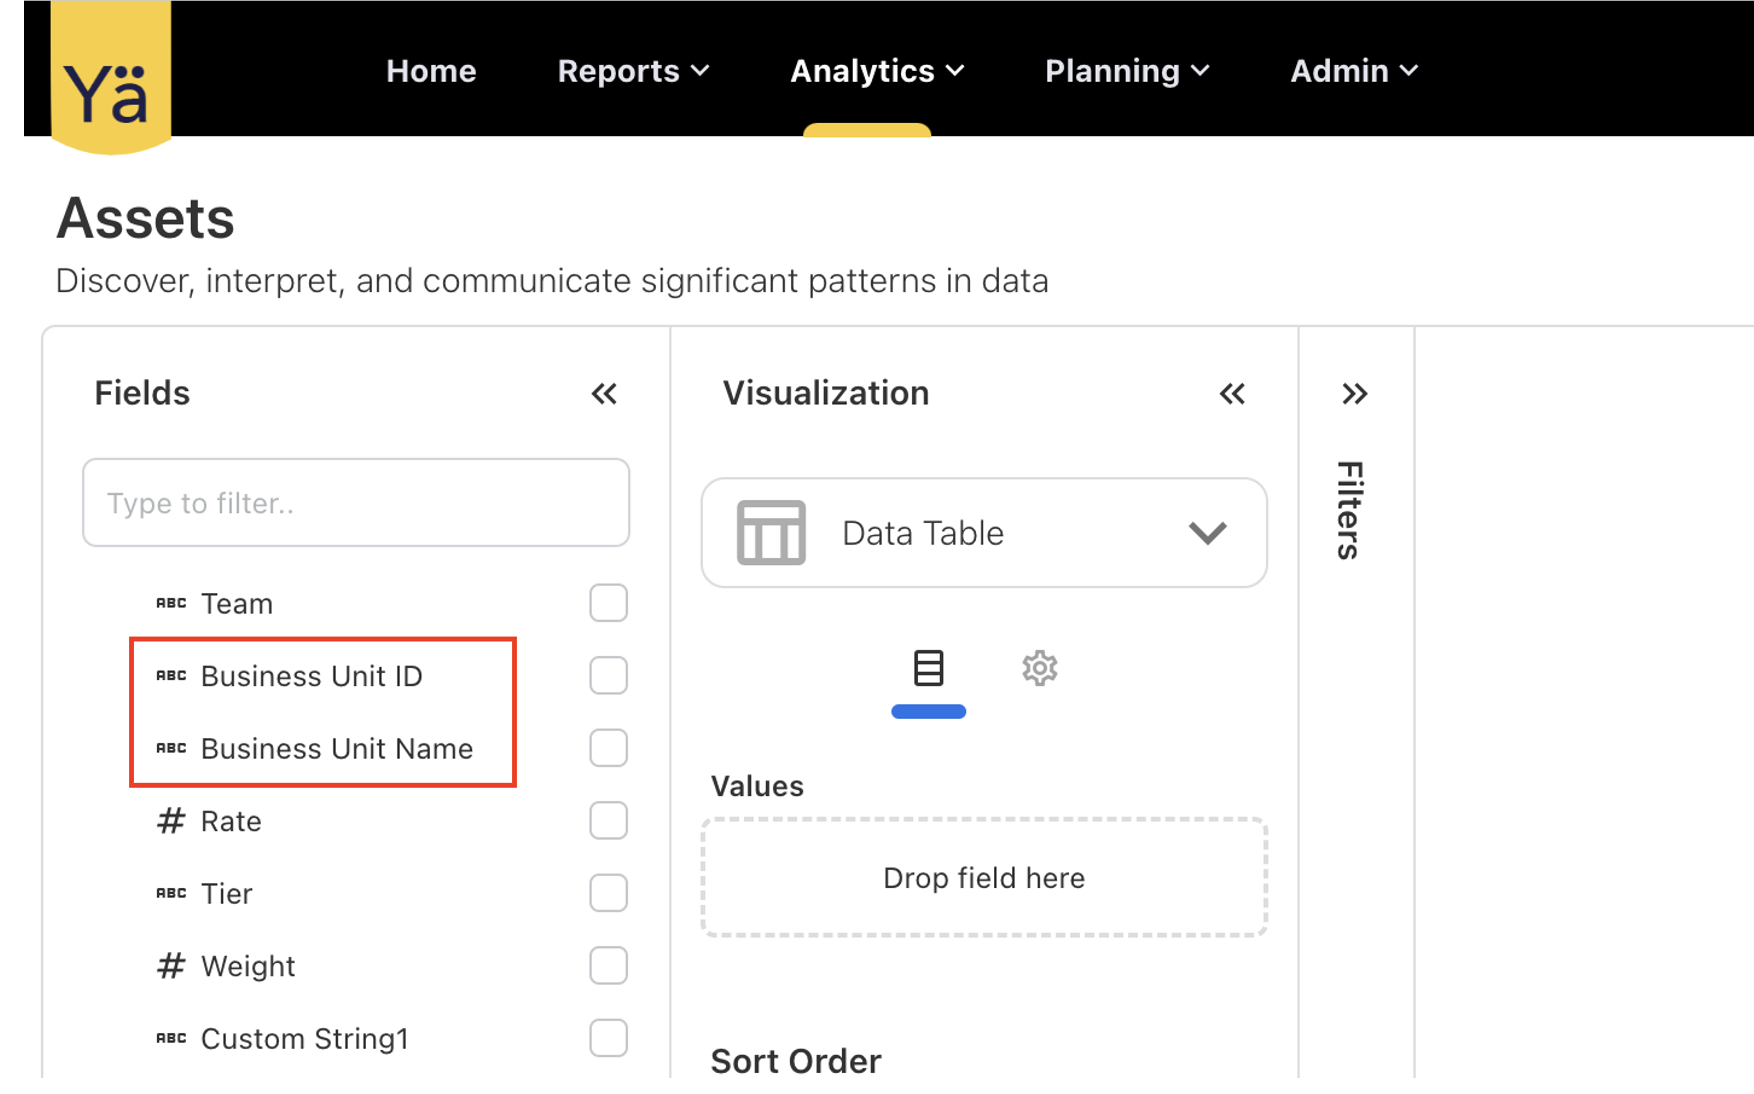
Additionally, users can now add asset conditions while distributing spend to assets by using the business unit name and ID.
July 25, 2023
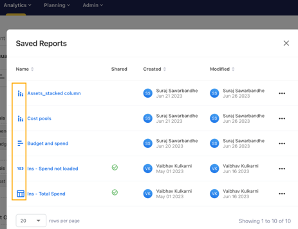
The Saved Reports in Analytics menu is updated to show the chart icons alongside the report names. This enhancement will allow you to identify the chart types while opening the saved reports.
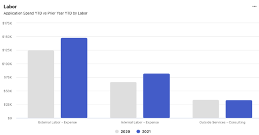
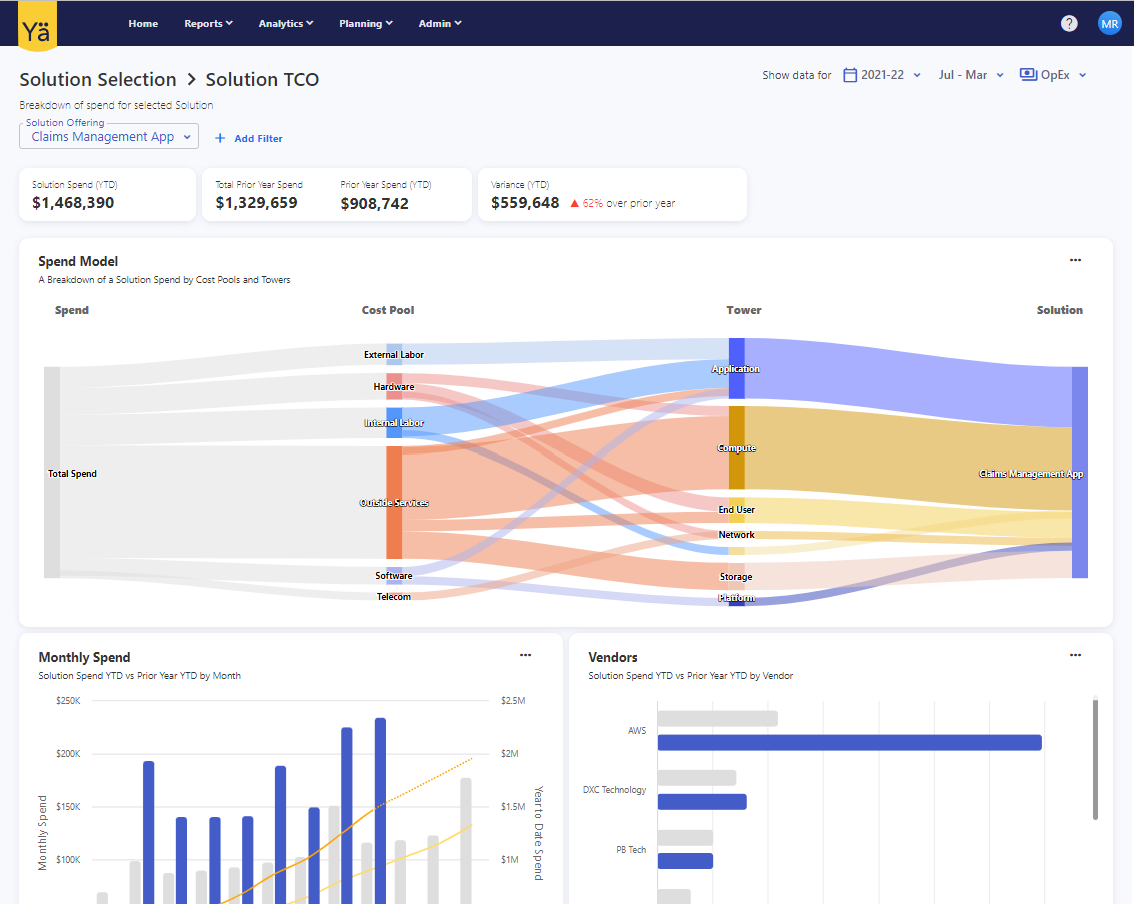
The Labor charts in Solution TCO and Application TCO are updated to show the correct labor spend amount. The labels Cost Pool and Sub Cost Pool are added to the Labor chart. This update allows users to view the Sub Cost Pool details directly on the chart. The given display format is Cost Pool - Sub Cost Pool, for example, Outside Services - Consulting.

July 18, 2023
We have introduced a new Budget Overview dashboard for the budget owner. This new dashboard provides a comprehensive overview of the budget for the next five years. The Budget Overview dashboard consolidates all budget-related information into a single, and user-friendly interface. It offers a variety of visualizations to monitor budget allocation and identify the budget trend.
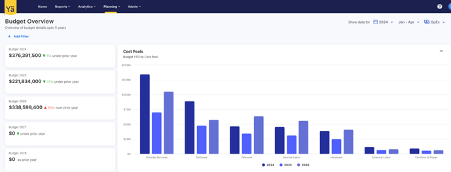
The dashboard is designed to show charts and reports based on the budget allocated to cost centers by Vendors, Cost Pool, Sub Cost Pool, Tower, and Sub Towers. All of the charts contain drill-down capabilities that provide a granular view of budget allocations. The dashboard also includes advanced filtering options to refine the budget data.
July 11, 2023
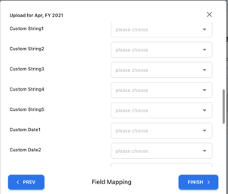
Custom Fields in Spend and Budget
While uploading Spend or Budget files, admin users can now use more custom fields. This new enhancement allows users to store up to 5 Custom Strings, 5 Custom Numbers, and 5 Custom Dates in Spend or Budget data. This update provides more flexibility and customization for tracking and analyzing your spend and budget data.
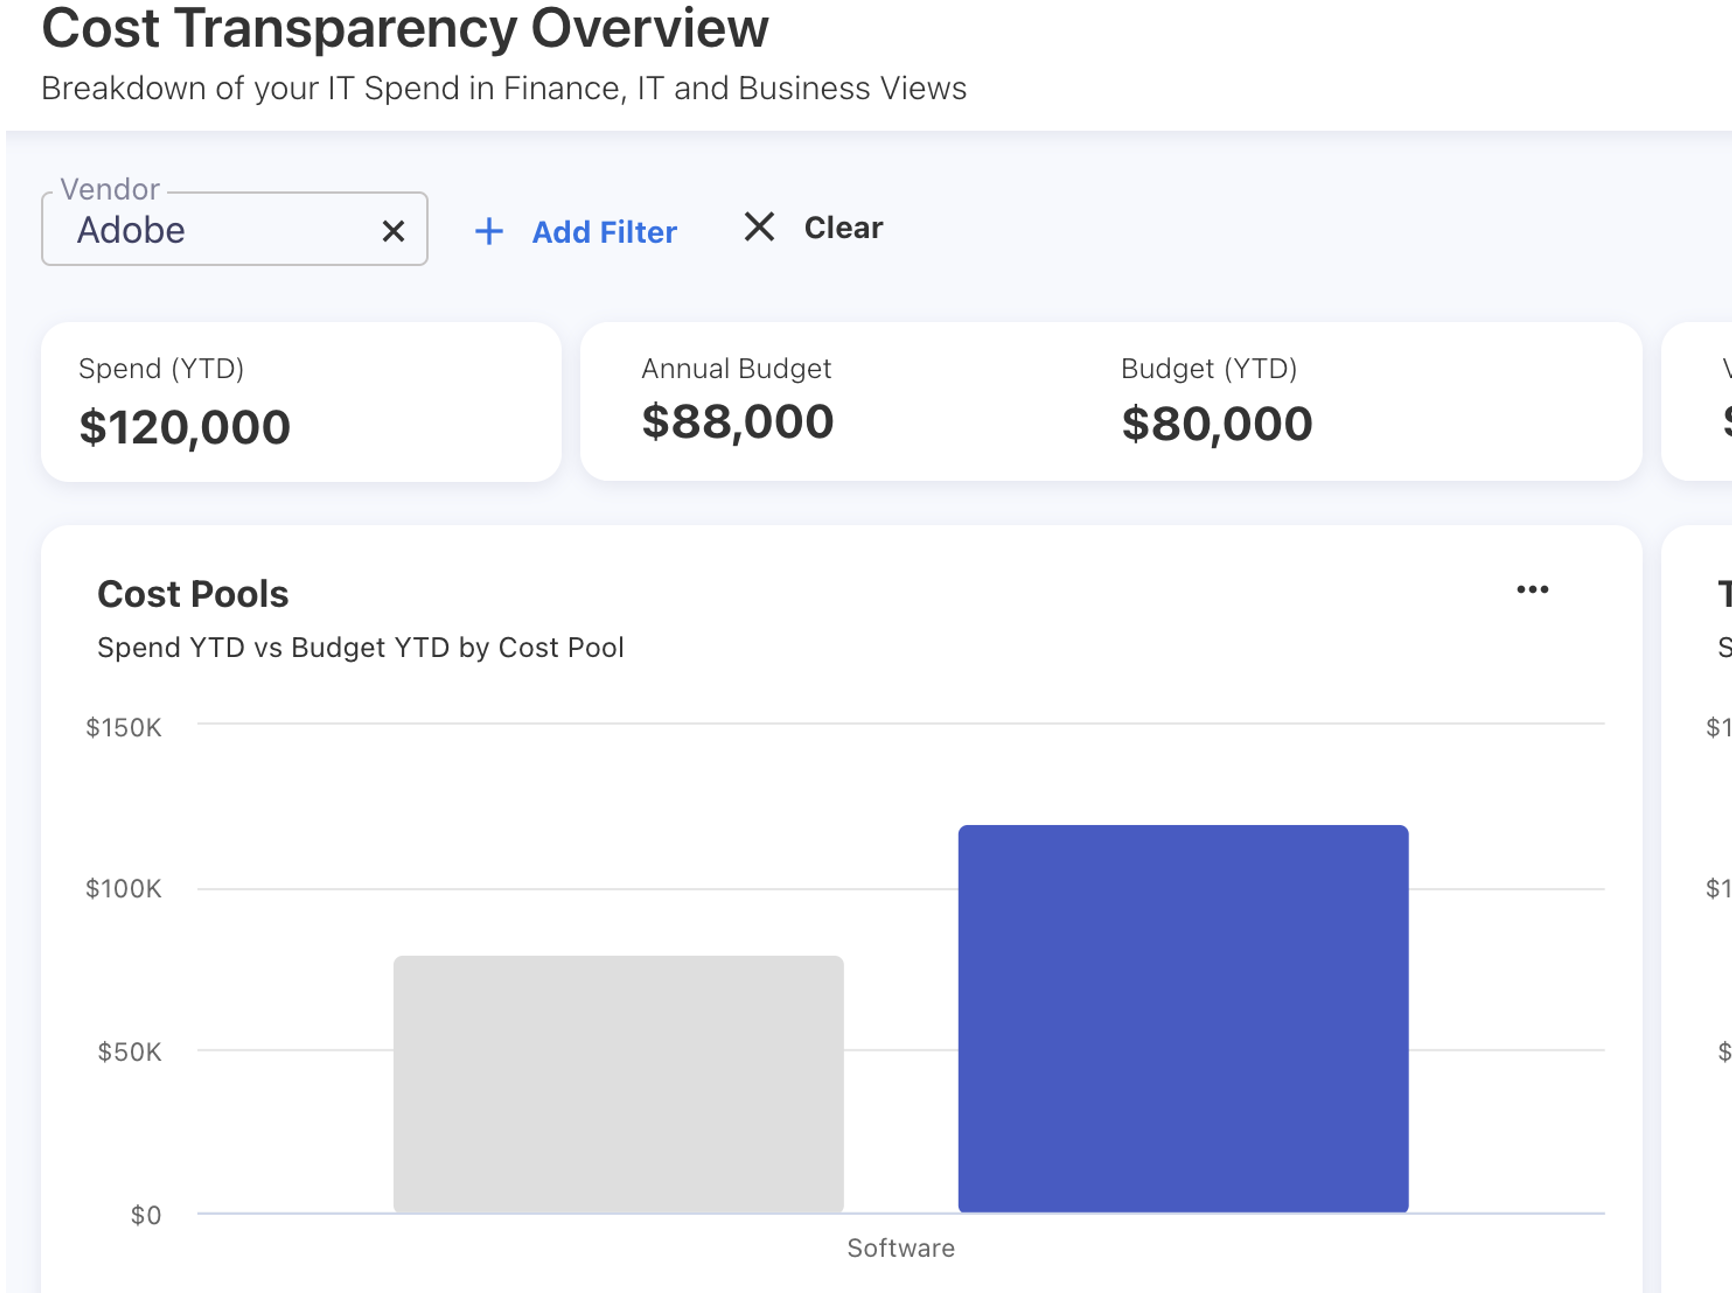
Dashboard Filter
We have retained the filtering condition on all the dashboards. The application now remembers the filters that the user has used while switching between the main dashboard and drill-down reports. For example, if a user applies a filter from the filter panel and then drill-down into a specific report, the program will retain the filter. The preselected filter will be reapplied if the user navigates back to the main dashboard via the screen menu or even refreshes the webpage. However, the preselected filter will not auto-apply if the user navigates back using the browser button. The user can remove a filter by clicking the Clear button. With this enhancement, Users will no longer have to apply filters repeatedly while returning to the main dashboard.
June 20, 2023
The issue with the downloaded CSV reports from Analytics has been resolved. Previously, the exported files contained string values, which prevented the calculation of average values, resulting in only a count being displayed. However, we have addressed this issue, and now the downloaded reports accurately calculate average values, providing a more comprehensive analysis of the data.
June 13, 2023
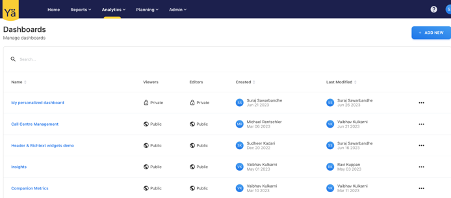
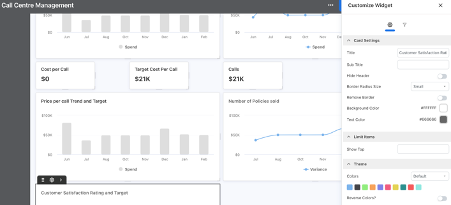
The Custom Dashboards feature is a creative way to design dynamic and personalized dashboards. This new dashboard is exclusively designed for the Power and Admin users. They can create and edit the custom dashboards from the Analytics menu. However, Viewer users have read-only access and can be accessed directly from the menu bar.
For Power and Admin Users
These dashboards enable you to create and design interactive dashboards that are tailored to your needs. You can share them with your teams and choose whether you want to allow edits or keep as read-only for team members. If the dashboards are public, you can easily identify the creator’s name and see who made the last edits. To recreate similar visualizations, you can copy any public dashboard and make edits according to your requirements.
We have also added an interactive comment section to each custom dashboard. Users can add comments, provide feedback, ask questions, and engage in discussions directly within the custom dashboards. This promotes the collaborative decision-making process.
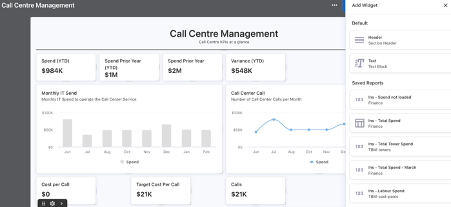
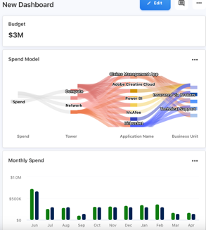
We have provided the flexibility to create the dashboards in easy steps. Users can add the widgets from the default reports or choose to import from the saved reports. The dashboards allow you to adjust the height and width of each widget using resize handles. Additionally, the Customize Widget option enables you to change the visualization properties and apply filter conditions to your data. This will help to create an informative dashboard layout by choosing your desired dimensions.
To enable seamless access to custom dashboards on different screens, we support the automatic adjustment of the screen layout. However, users can manually change the dimensions and position of the widgets.
June 8, 2023
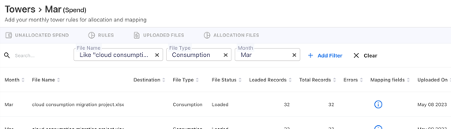
When an admin user creates tower rules for the months using allocation files, they will now be able to see the uploaded file details using the ALLOCATION FILES tab. This new tab displays a list of all allocation files that have been uploaded to create a rule for the given month.
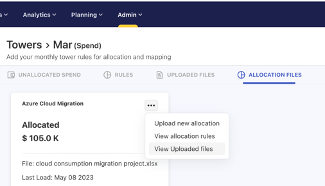
Additional filters are provided in the tab to search for specific details.
June 1 , 2023
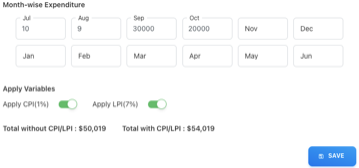
Cost Center Budget Details
The budget calculation is now updated to show the total budget value with and without CPI/LPI. When the cost center owner creates a new budget item and adds the values in Month-wise Expenditure by enabling the CPI/LPI fields, the totals with or without CPI/LPI are adjusted automatically. The user can see the CPI/LPI percentage values while applying the variables. The new update improves the budget amount calculation and provides detailed budget visibility.
May 30, 2023
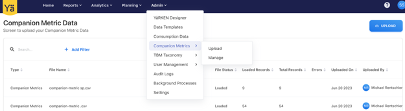
Companion Metrics is a great place to measure the performance of non-financial activities alongside financial data, providing a side-by-side comparison of cost and impact. In this release, we have introduced the Companion Metrics screen only for Power and Admin users under the Admin menu.
The Companion Metrics screen offers below two key components:
-
Upload: The Upload option enables administrators to easily upload companion metric files into the system. All the uploaded file details can be checked on this screen.
-
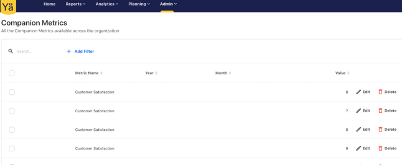
Manage: The Manage screen provides a list of all metrics available across the organization. Also, the user can edit and delete the metrics data on this screen. The Manage screen gives a comprehensive view of the metrics, showcasing the metric values alongside the corresponding year and month details.
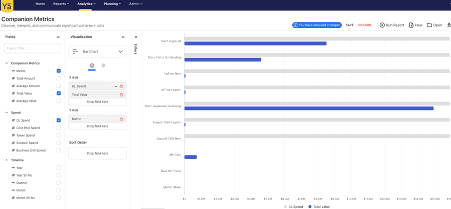
The Companion Metrics is also available for reporting in the Analytics menu. The metrics cube can be reported against Spend and Timeline. The users can create customized reports and charts based on the metrics data.
May 16, 2023
An issue is fixed when the user distributes the spend to Asset Employees and chooses splitting by custom Weight column, for example, by Rate. The custom Weight column was not working, and the user was unable to distribute spend to assets. Now the custom weight column is able to distribute the spend to any assets.
May 09, 2023
Auto Mapping of Column Names
When uploading a CSV or Excel files, the auto mapping will ignore the letter case of the column headers and map the headers to specific fields accordingly. Now, the application will not consider the uppercase or lowercase of column headings while uploading any files.
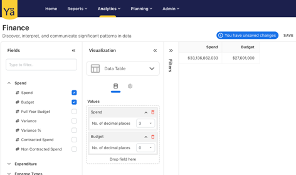
April 25, 2023
Users can now define the default decimals in all currency and numeric fields in Analytics. This allows the user to customize the display of decimal points. Now, the number of decimal places can be set up to 6 in all currency and numeric fields; however, by default, it is set to 0 decimals. Users can change the number of decimal places from the dropdown icon next to the selected values. This customization is now applicable to all visualizations in analytics.
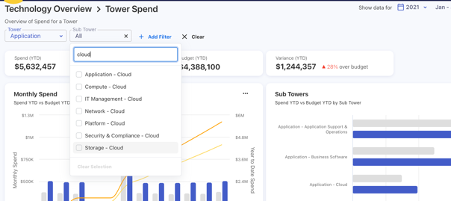
April 18, 2023
Extended the TBM Taxonomy and introduced a Cloud Sub Tower. This allows users to map their cloud-related spend to specific cloud sub towers, providing greater visibility into cloud-specific spend. With this update, users can select cloud sub towers for various towers including Application, Compute, Network, Storage, Security & Compliance, Platform, and IT Management.
April 11, 2023
The cost allocation for the Cloud spend is simplified. While selecting Multiple Towers and the ADD TOWERS FROM ALLOCATION FILE option, the user can upload the file with the fields such as Tower, Sub-Tower, Asset Type, Asset ID, and a Weight column (which is used to derive the portion). The tower and asset allocation files now include two extra columns for Asset Type and Asset ID.
The portion is calculated based on the weight column chosen. With this update, users can easily distribute cost directly to assets (if required), thus improving the overall user experience.
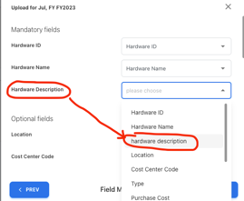
April 4, 2023
While uploading Spend or Budget files, admin users can now use more custom fields. This new enhancement allows users to store up to 5 Custom Strings, 5 Custom Numbers, and 5 Custom Dates in Spend or Budget data. This update provides more flexibility and customization for tracking and analysing your spend and budget data. The Mapping Fields screen shows all the new customs fields in the above order. Data upload templates such as Actual Cost and Budget Allocations are updated to add new custom fields.
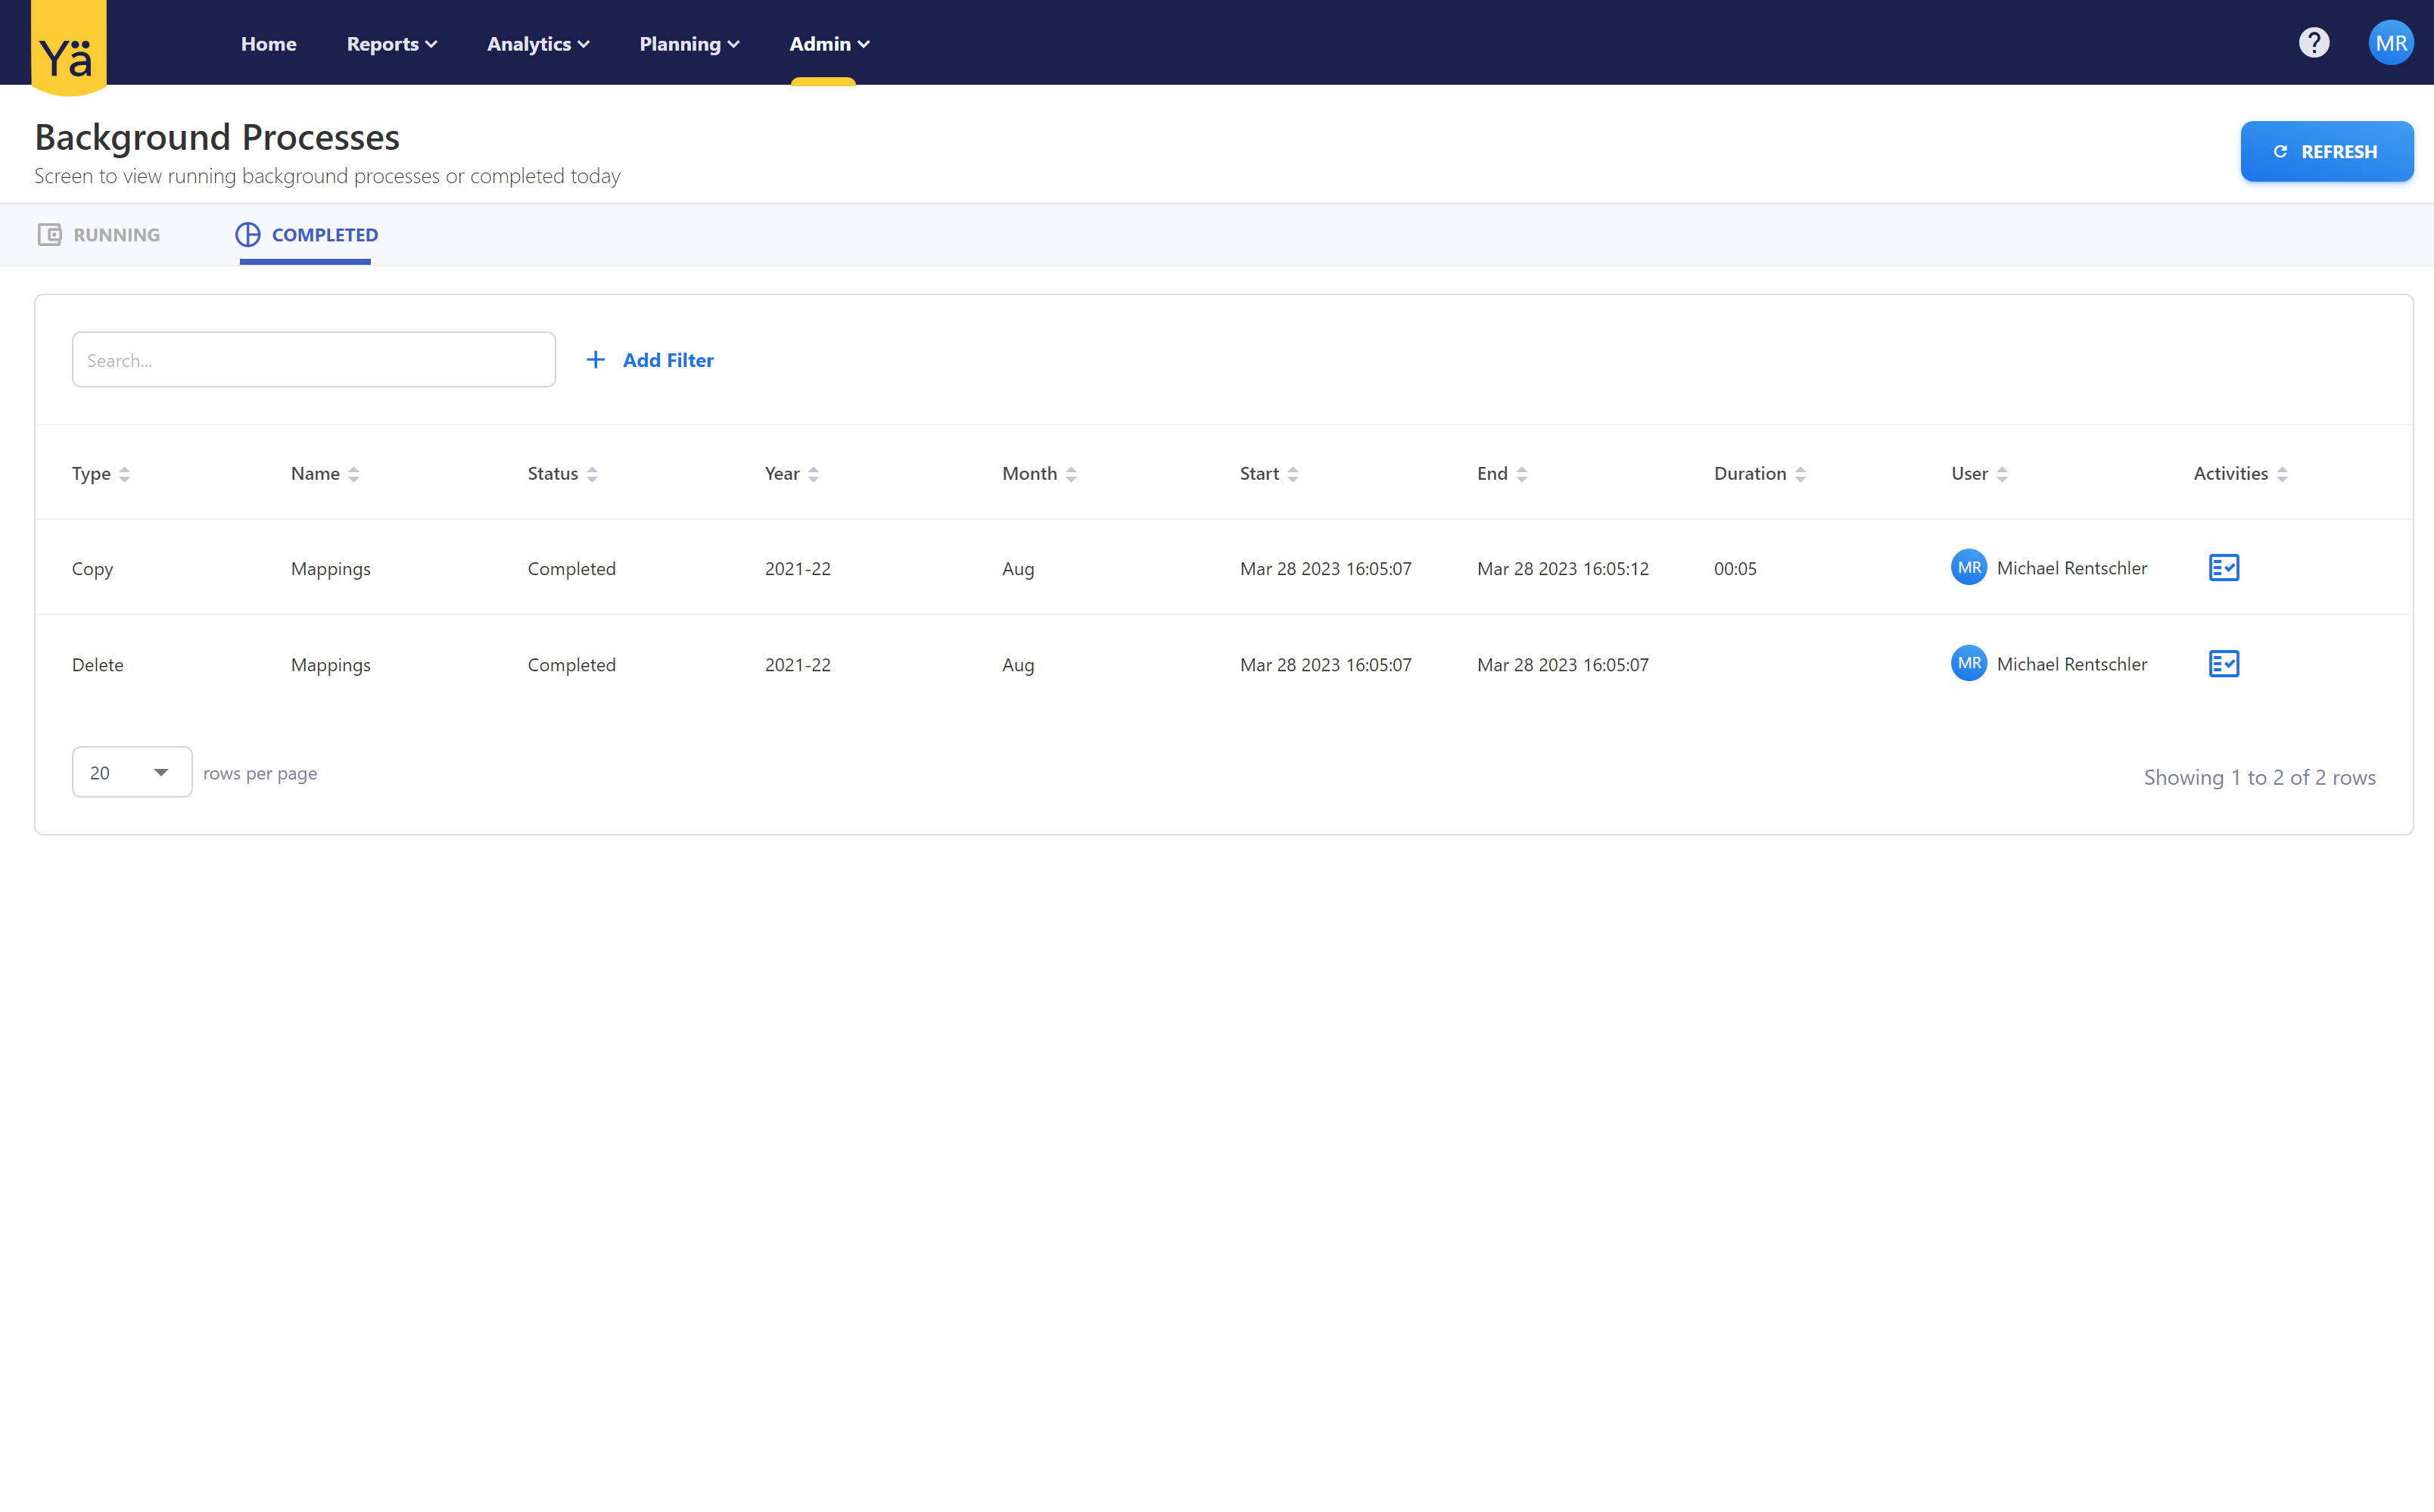
March 27, 2023
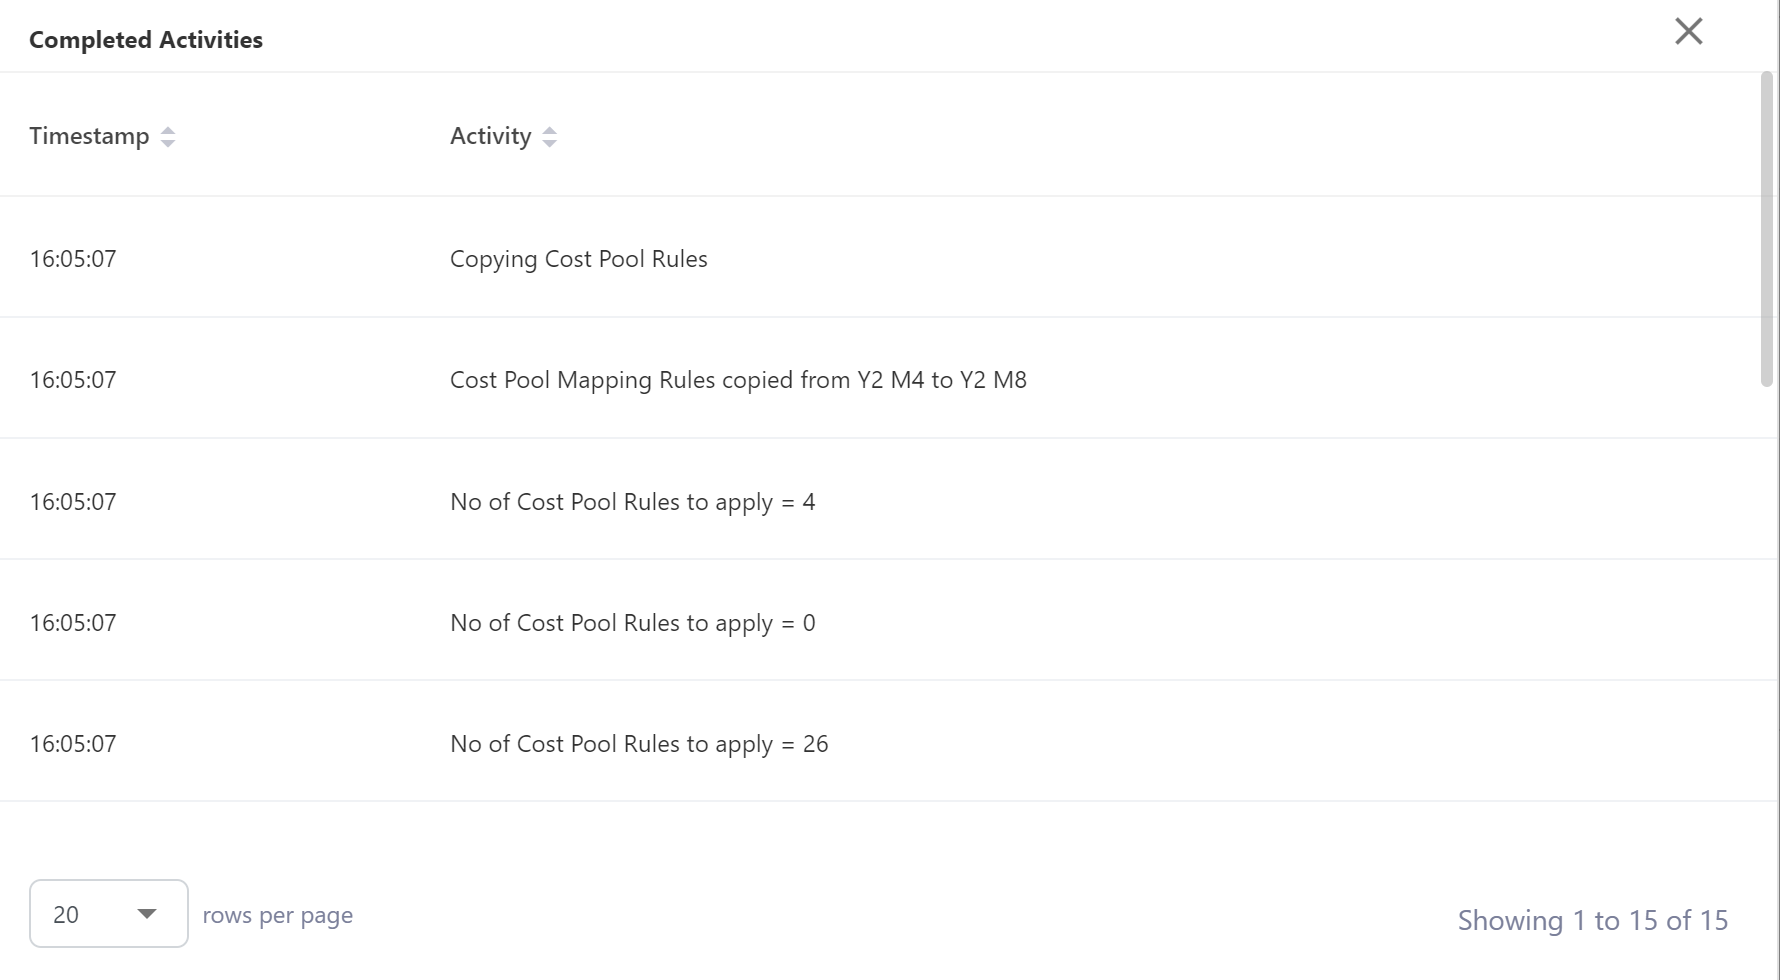
We have introduced a process viewer to deal with long running processes in the background. This allows admins to see the progress when making larger changes to the model.
March 20, 2023
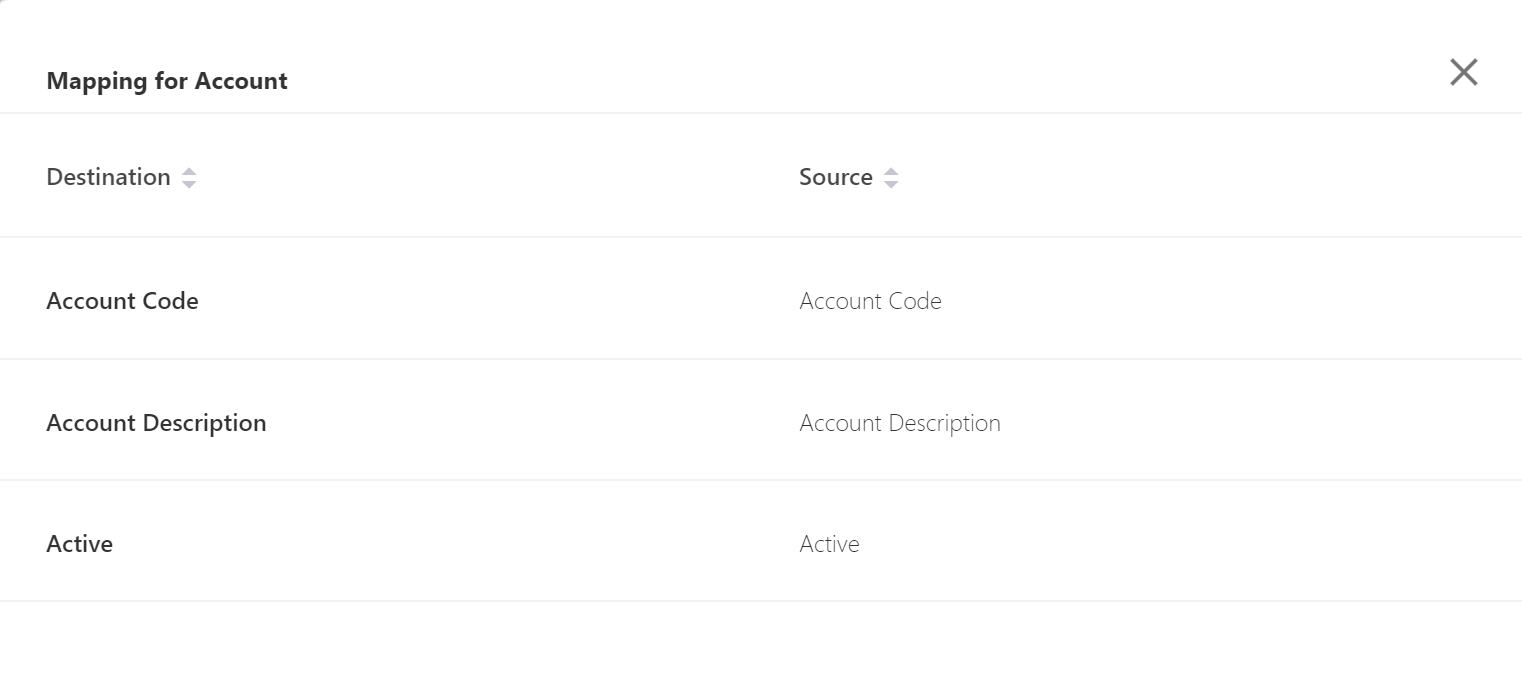
Ever wondered if you mapped a file correctly to the YäRKEN data structure? Now you can view the mapping after the file is loaded:
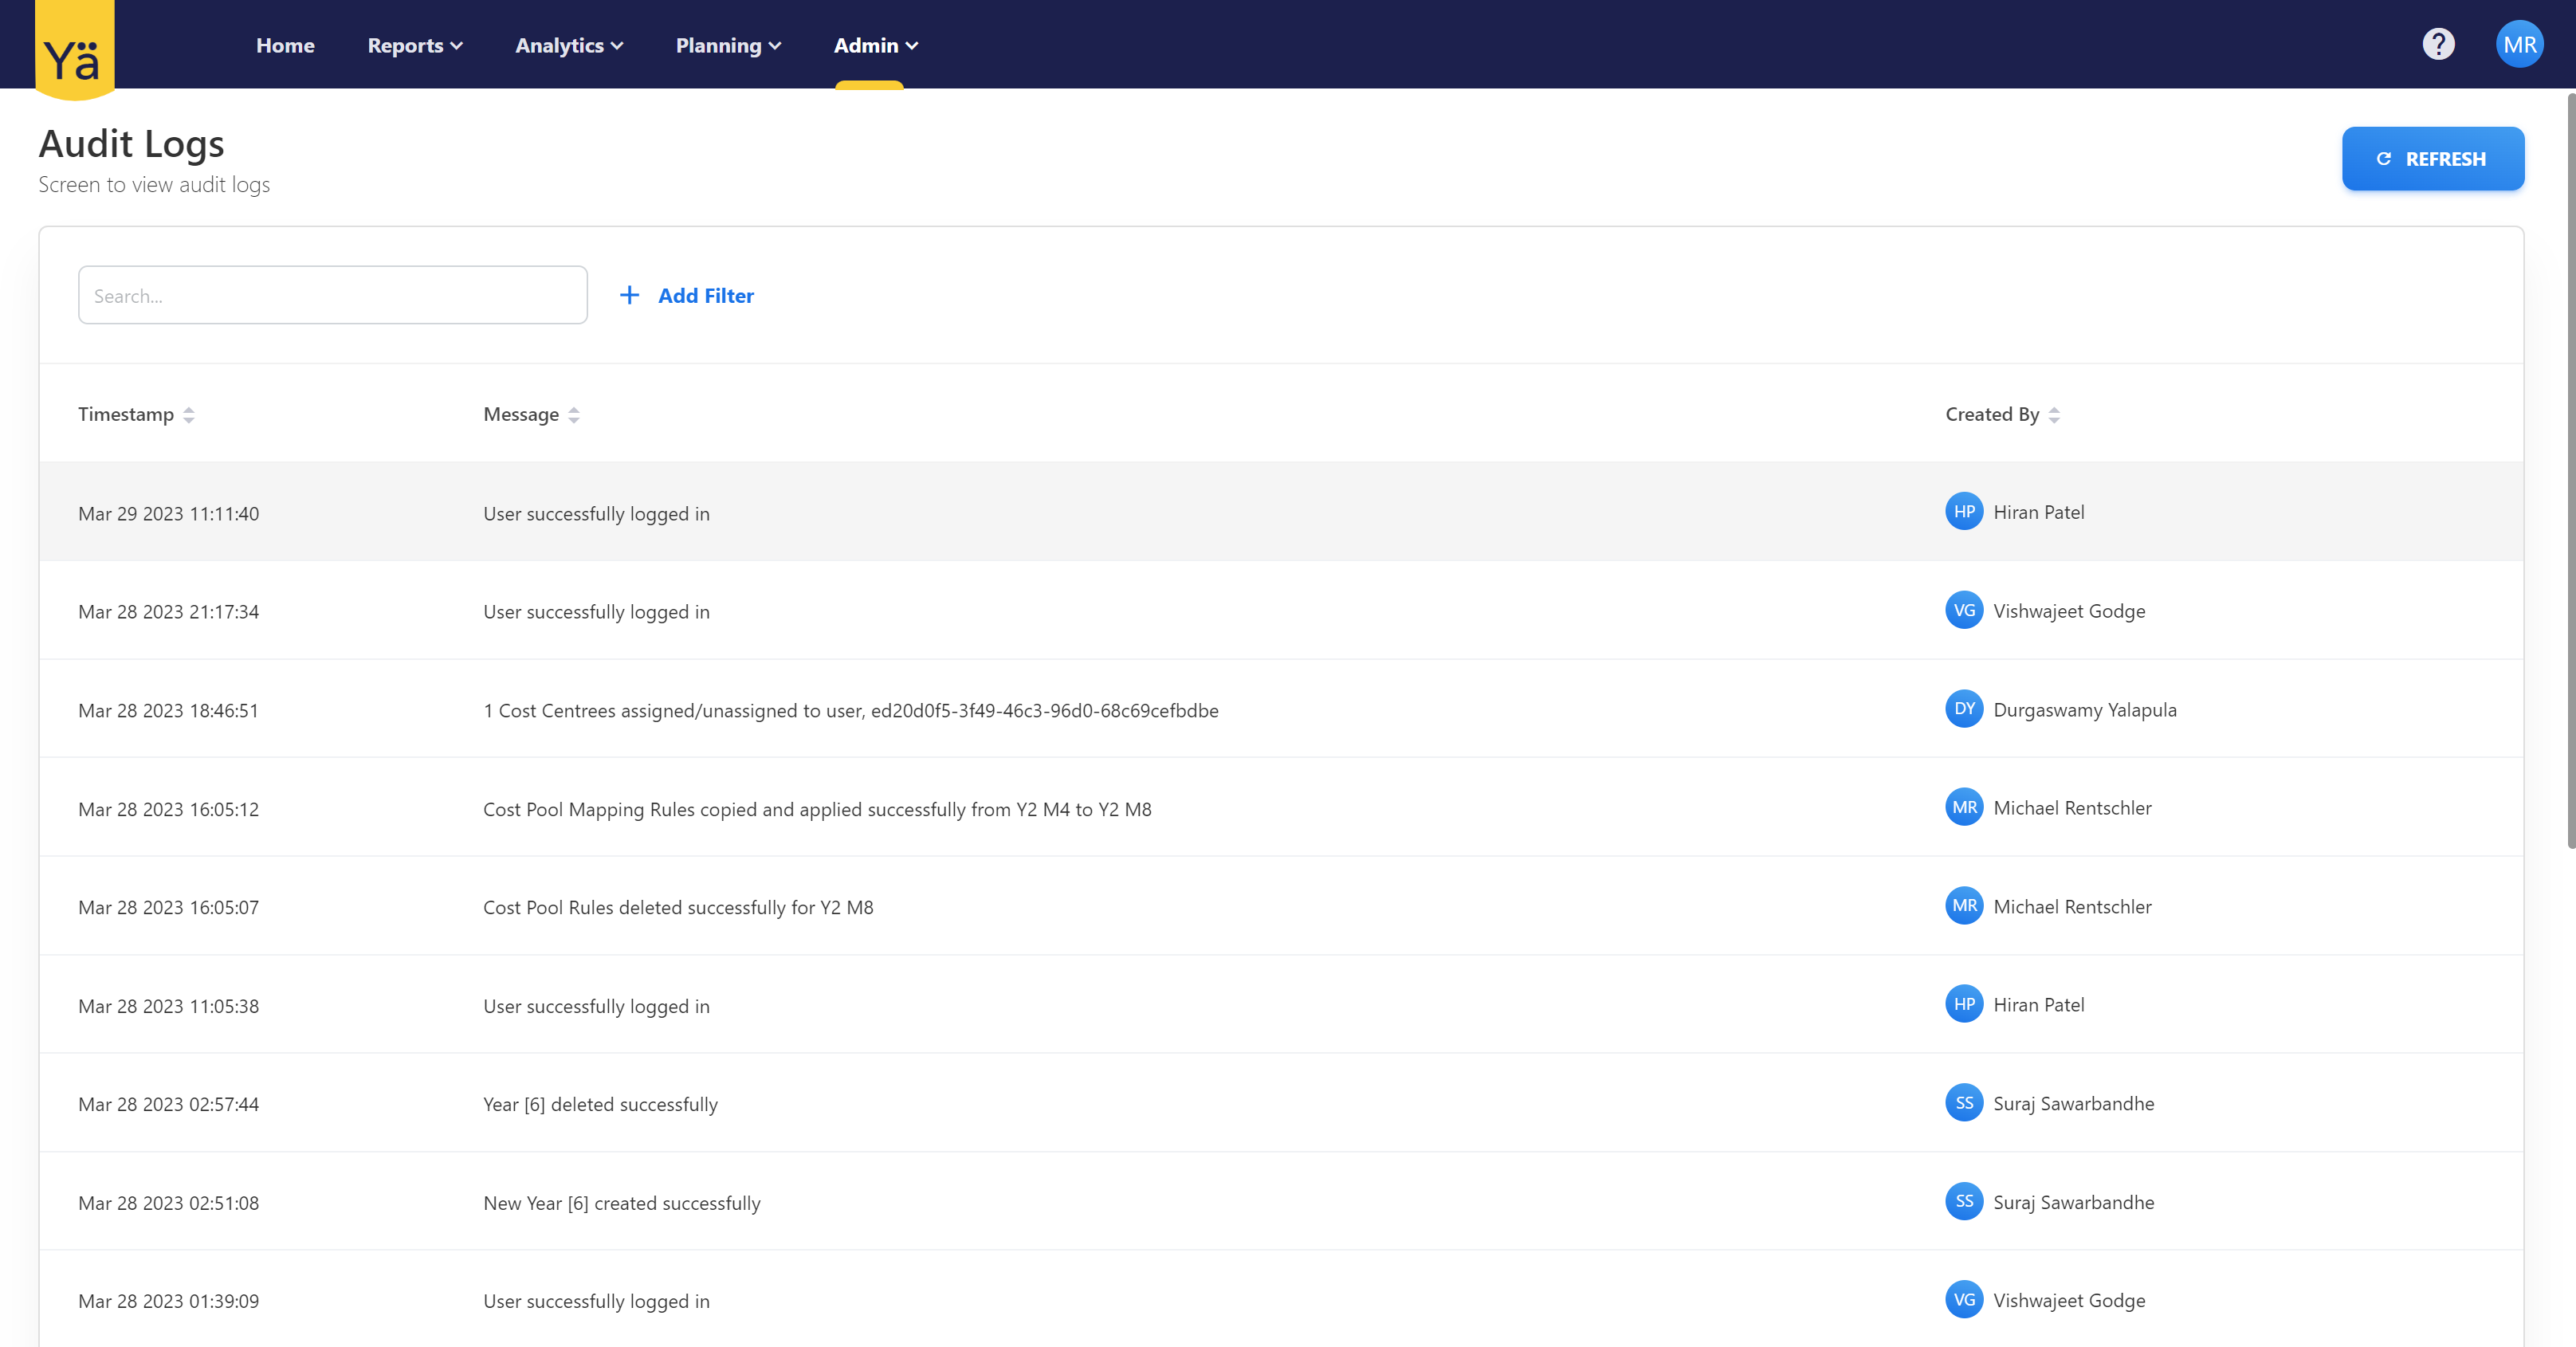
If multiple people work on the same instance at the same time it can become hard to keep up to date what was changed. The Audit log feature keeps a record of all changes to system.
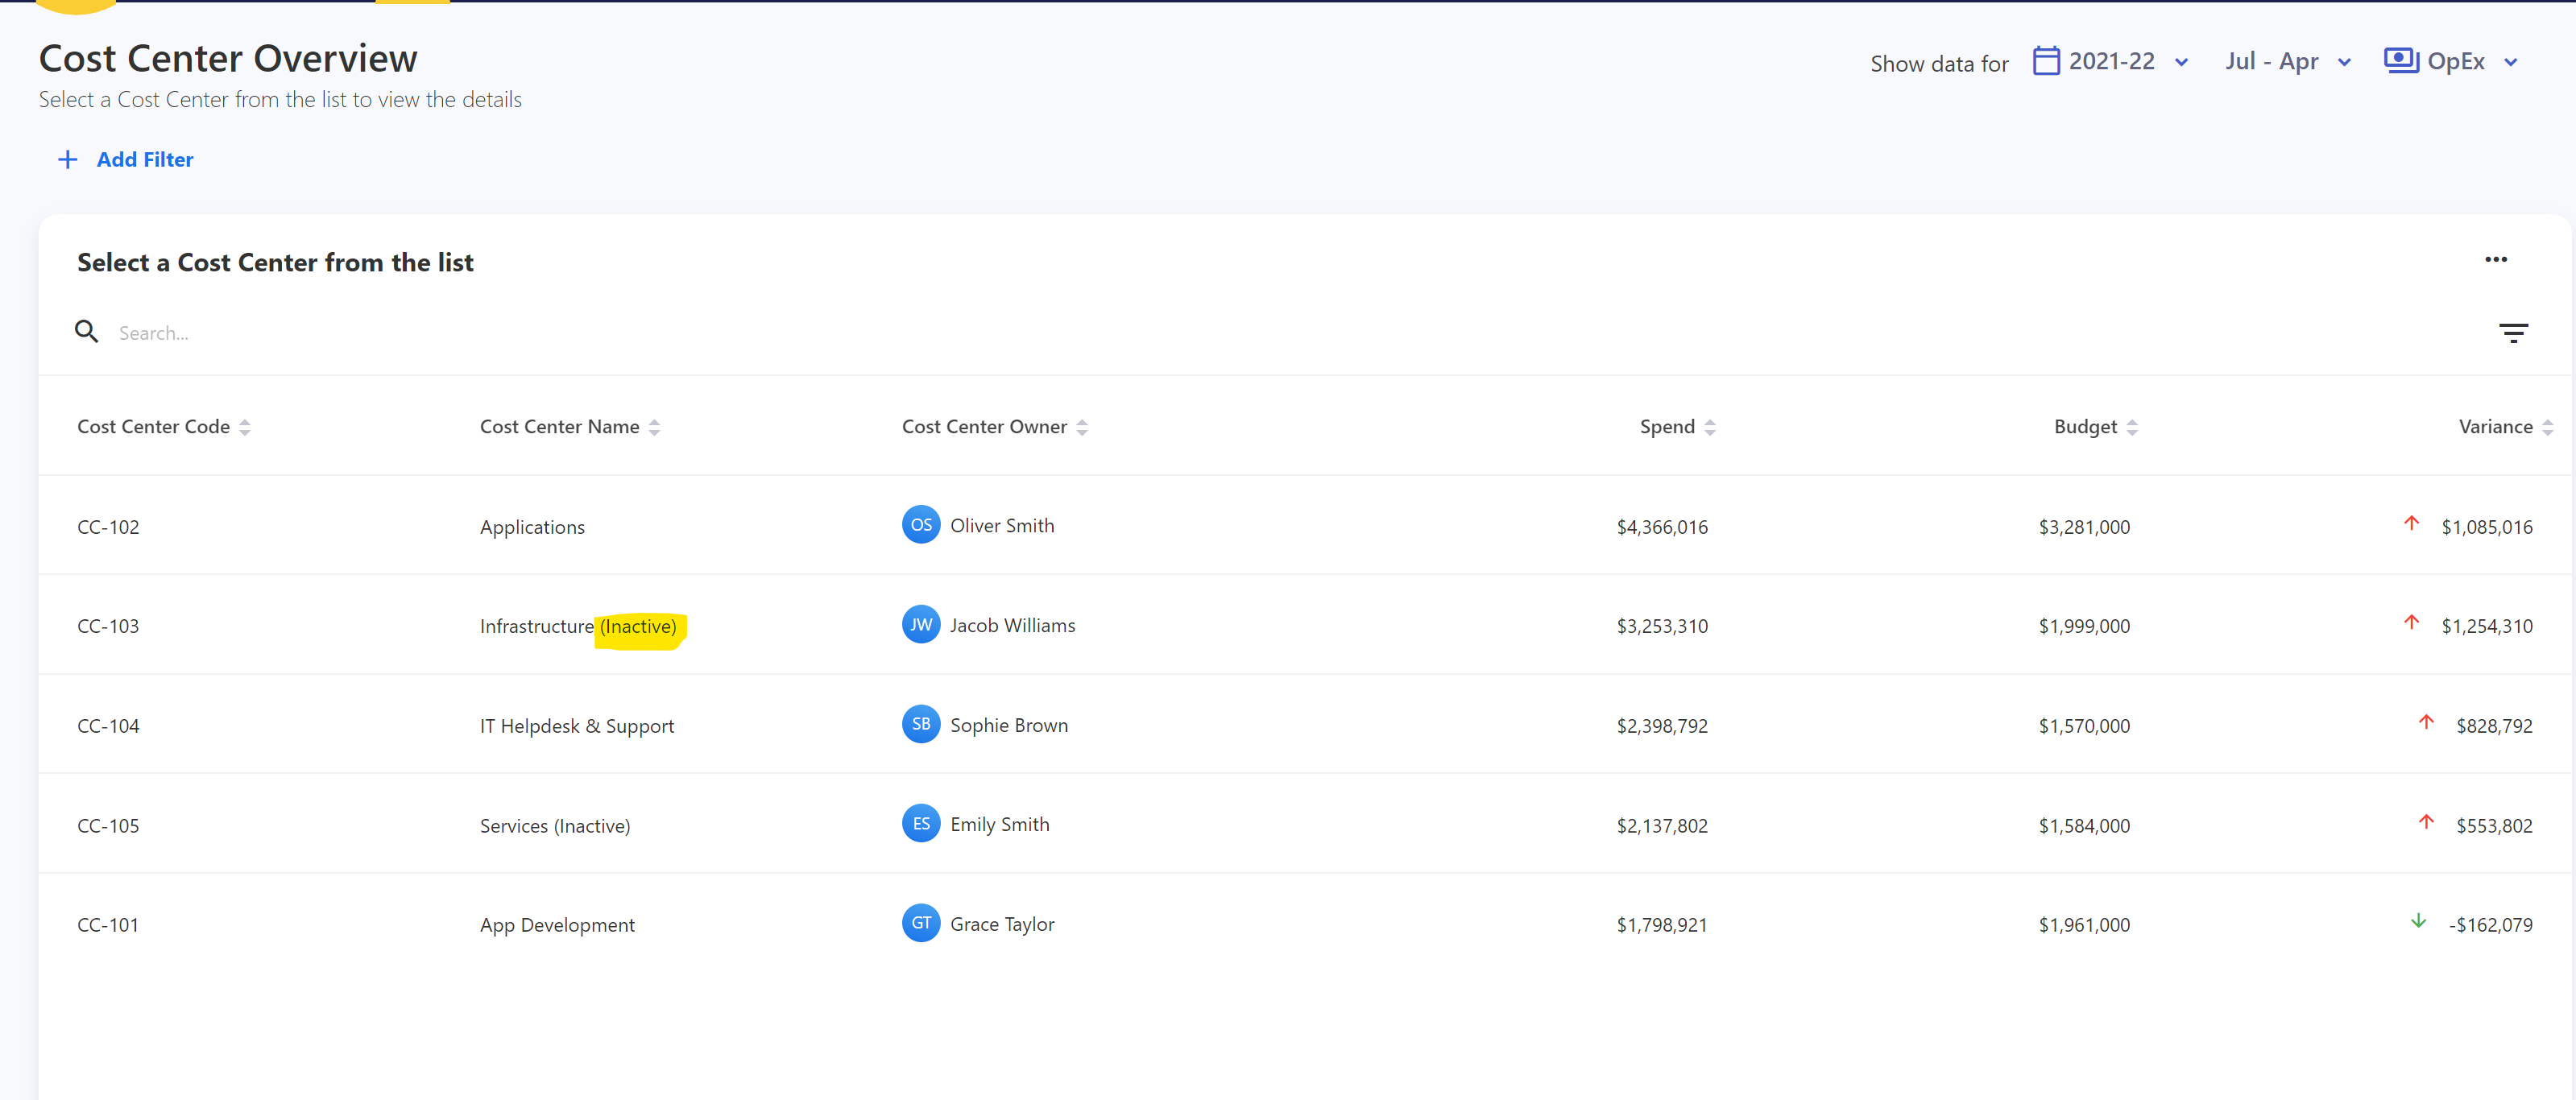
By default inactive master data is not shown int he admin section anymore. You can use the filter to make them visible.
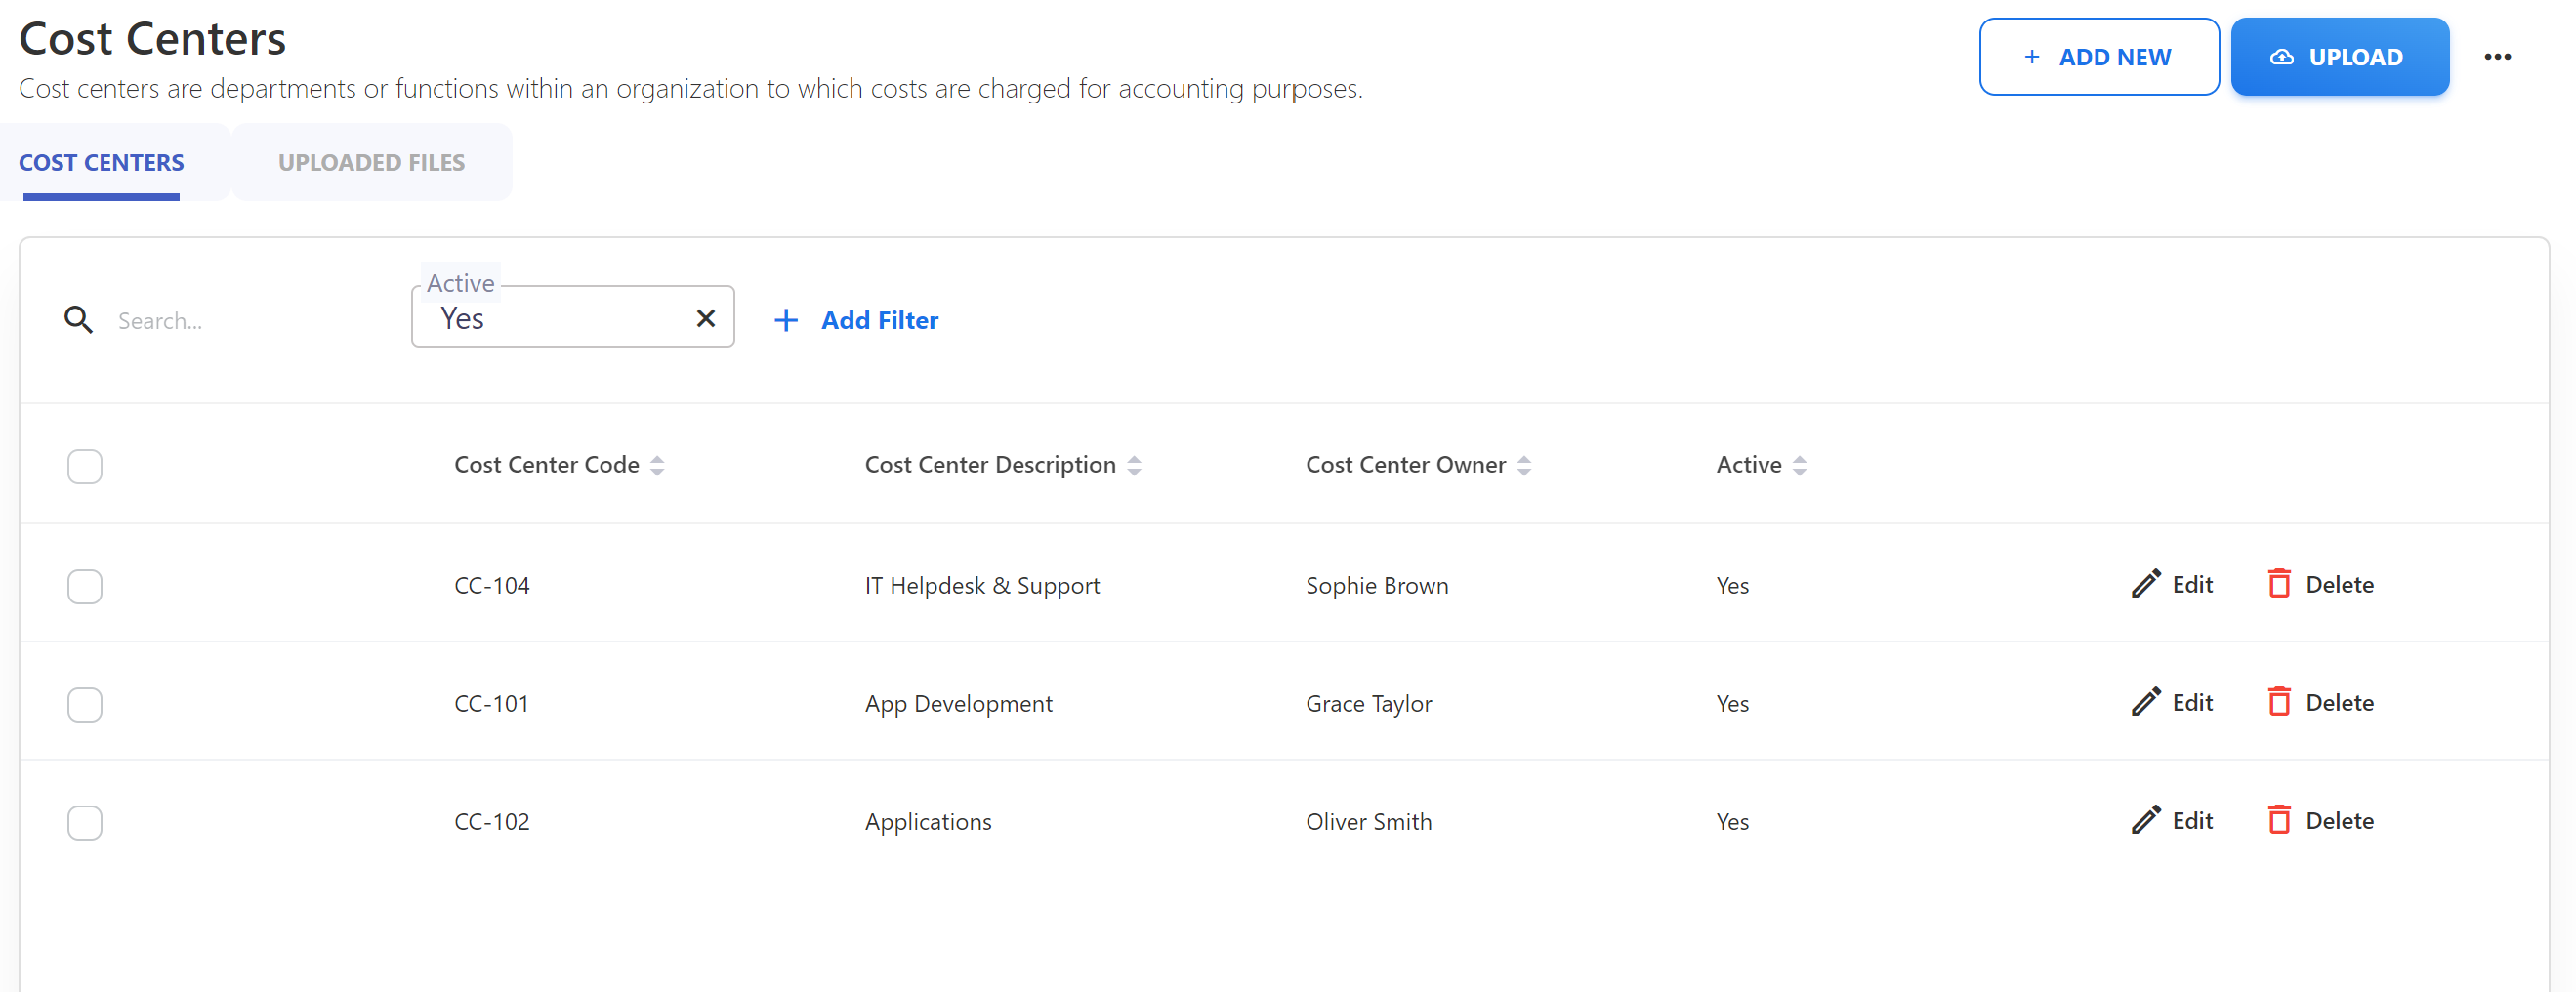
In the dashboards and reports inactive master data is shown as inactive.
March 13, 2023
Showback Dashboard
Cloud Overview Dashboard
Solution Business Alignment
Ability to plot Usage as Value and Spend Targets
March 7, 2023
Introduction of Services and Products. Services, Products and Applications are now Capabilities
February 27, 2023
Performance Improvements
February 20, 2023
Incremental refinement of the Designer and Analytics screens.
February 13, 2023
We are saying goodbye to our old “Data Management” screen as now all functionality is available in our new Designer. Also some bugfixes around our cubes and dashboards.
February 7, 2023
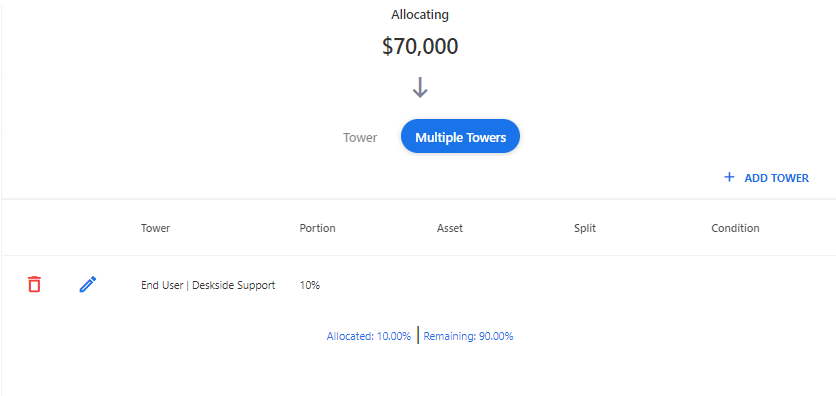
Smaller enhancements to increase usability. Added percentage to the tower allocation screen to improve the process of allocating spend to multiple towers.
January 30, 2023
This release focused on performance improvement across all our dashboards by improving the caching.
January 27, 2023
This release focused mainly on smaller bugfixes.
January 17, 2023
Introducing new dashboards for Solutions and Asset types
January 9, 2023
Ability to view mapped GL line items when reviewing Cost Pool and Tower rules.
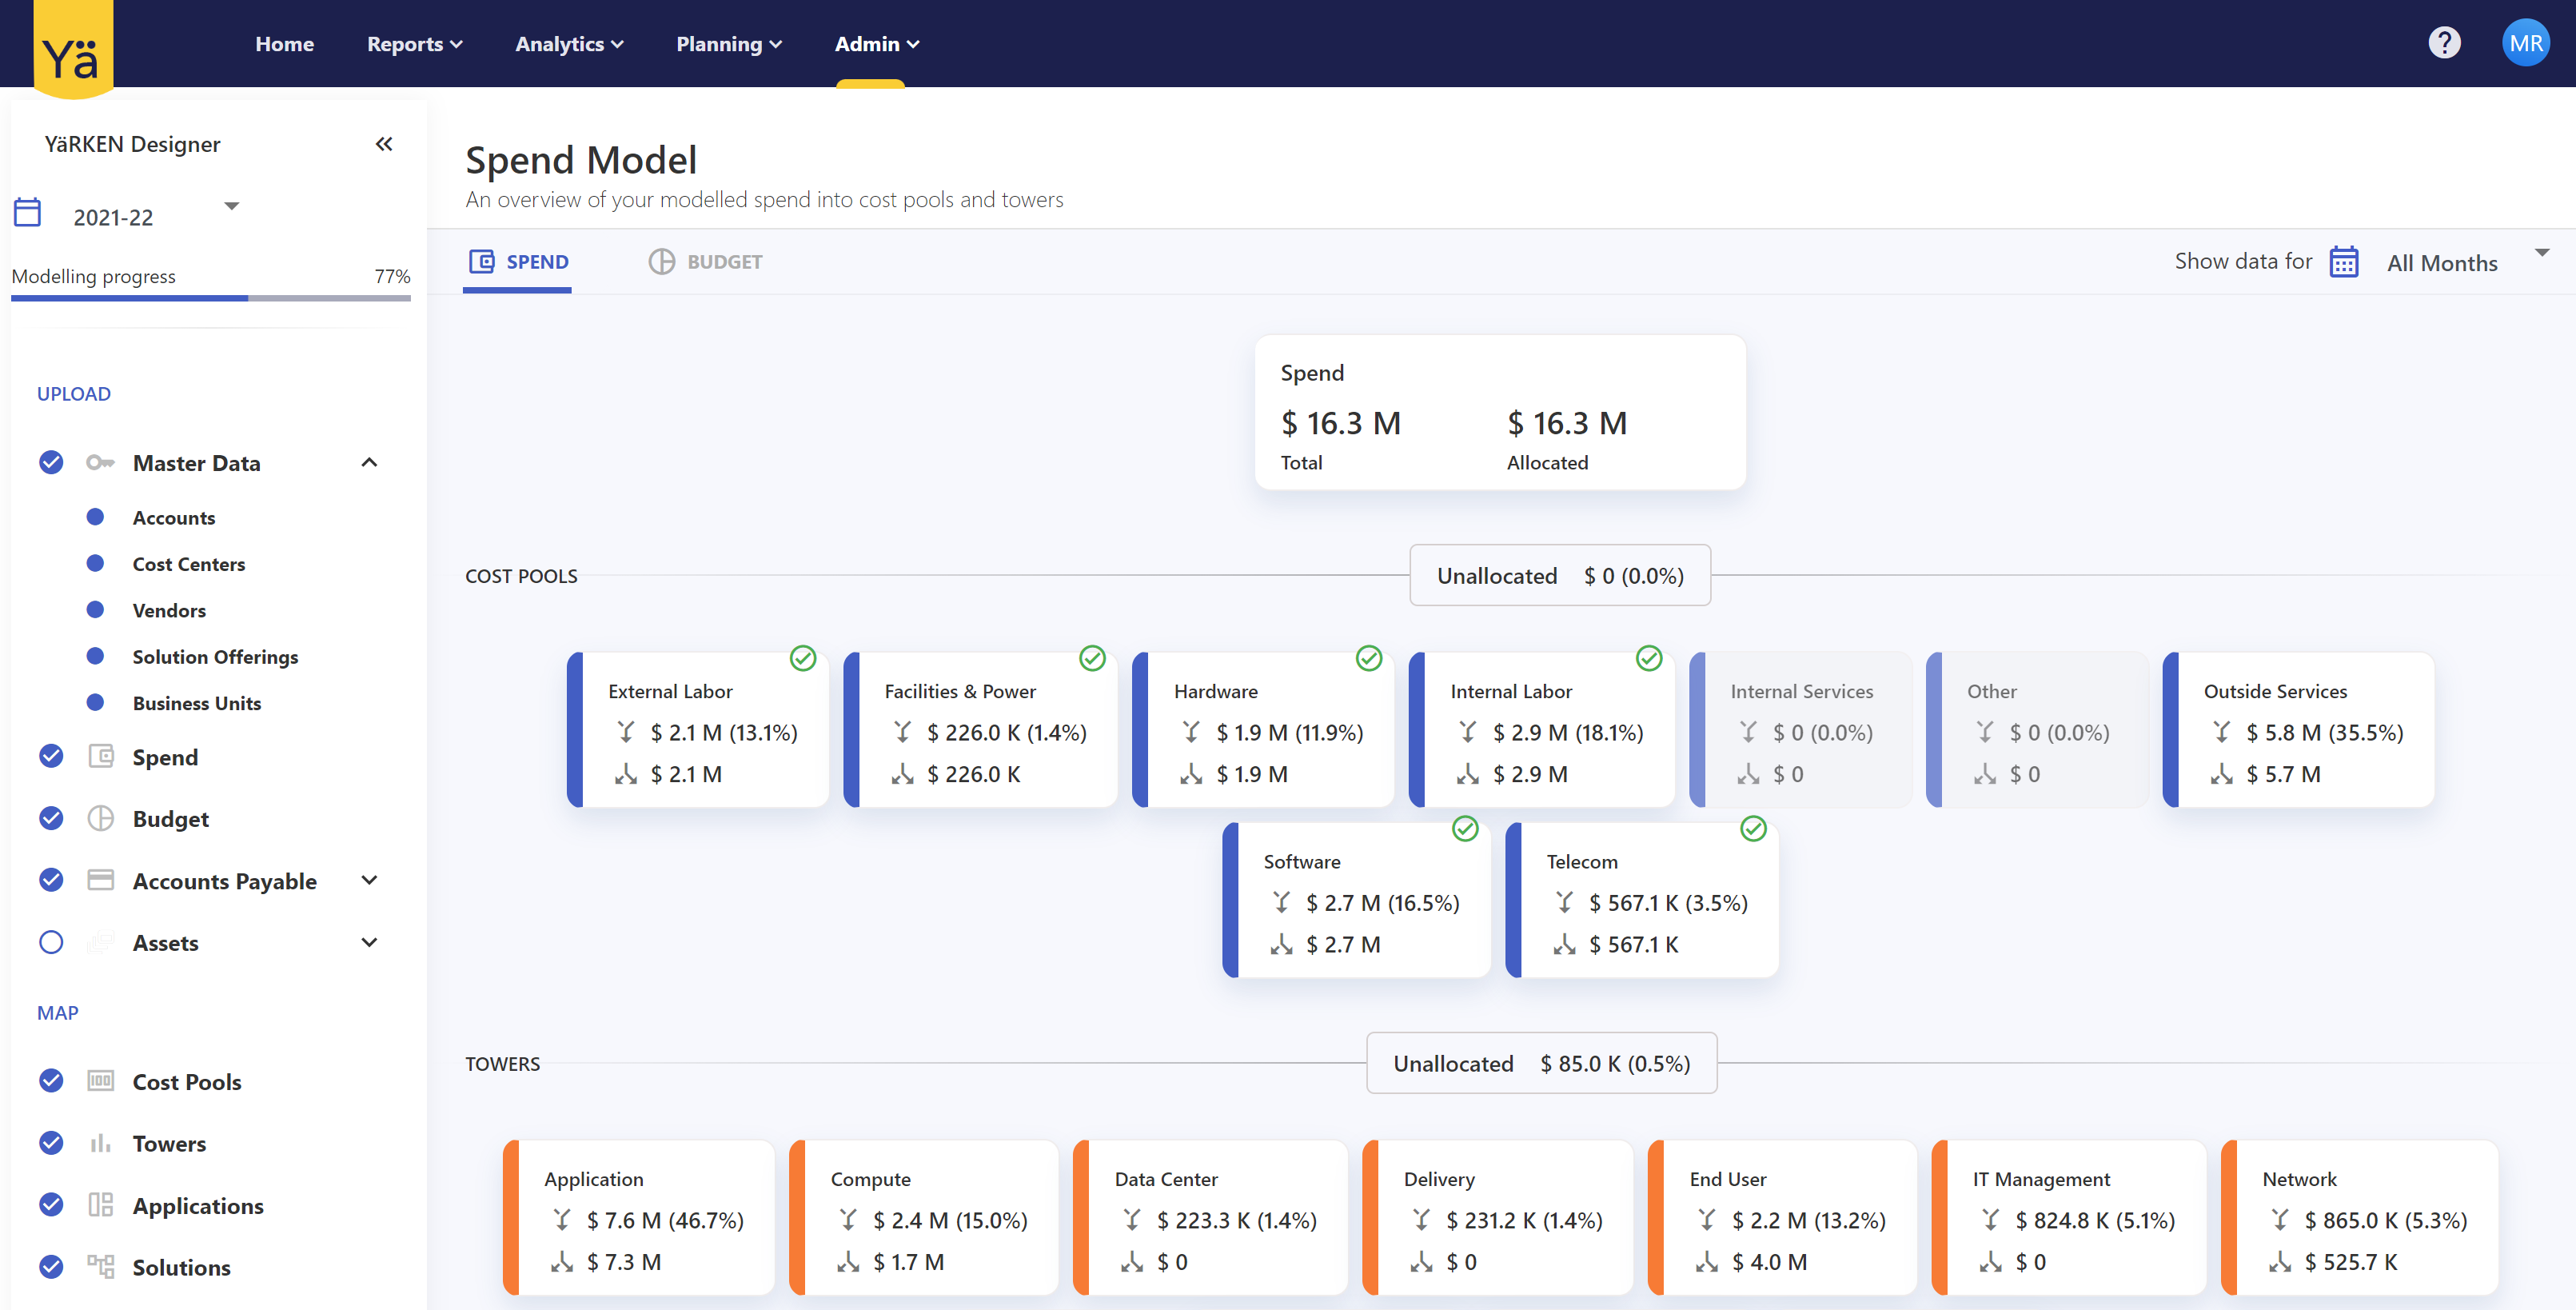
Added a month filter to the Designer Spend Model.
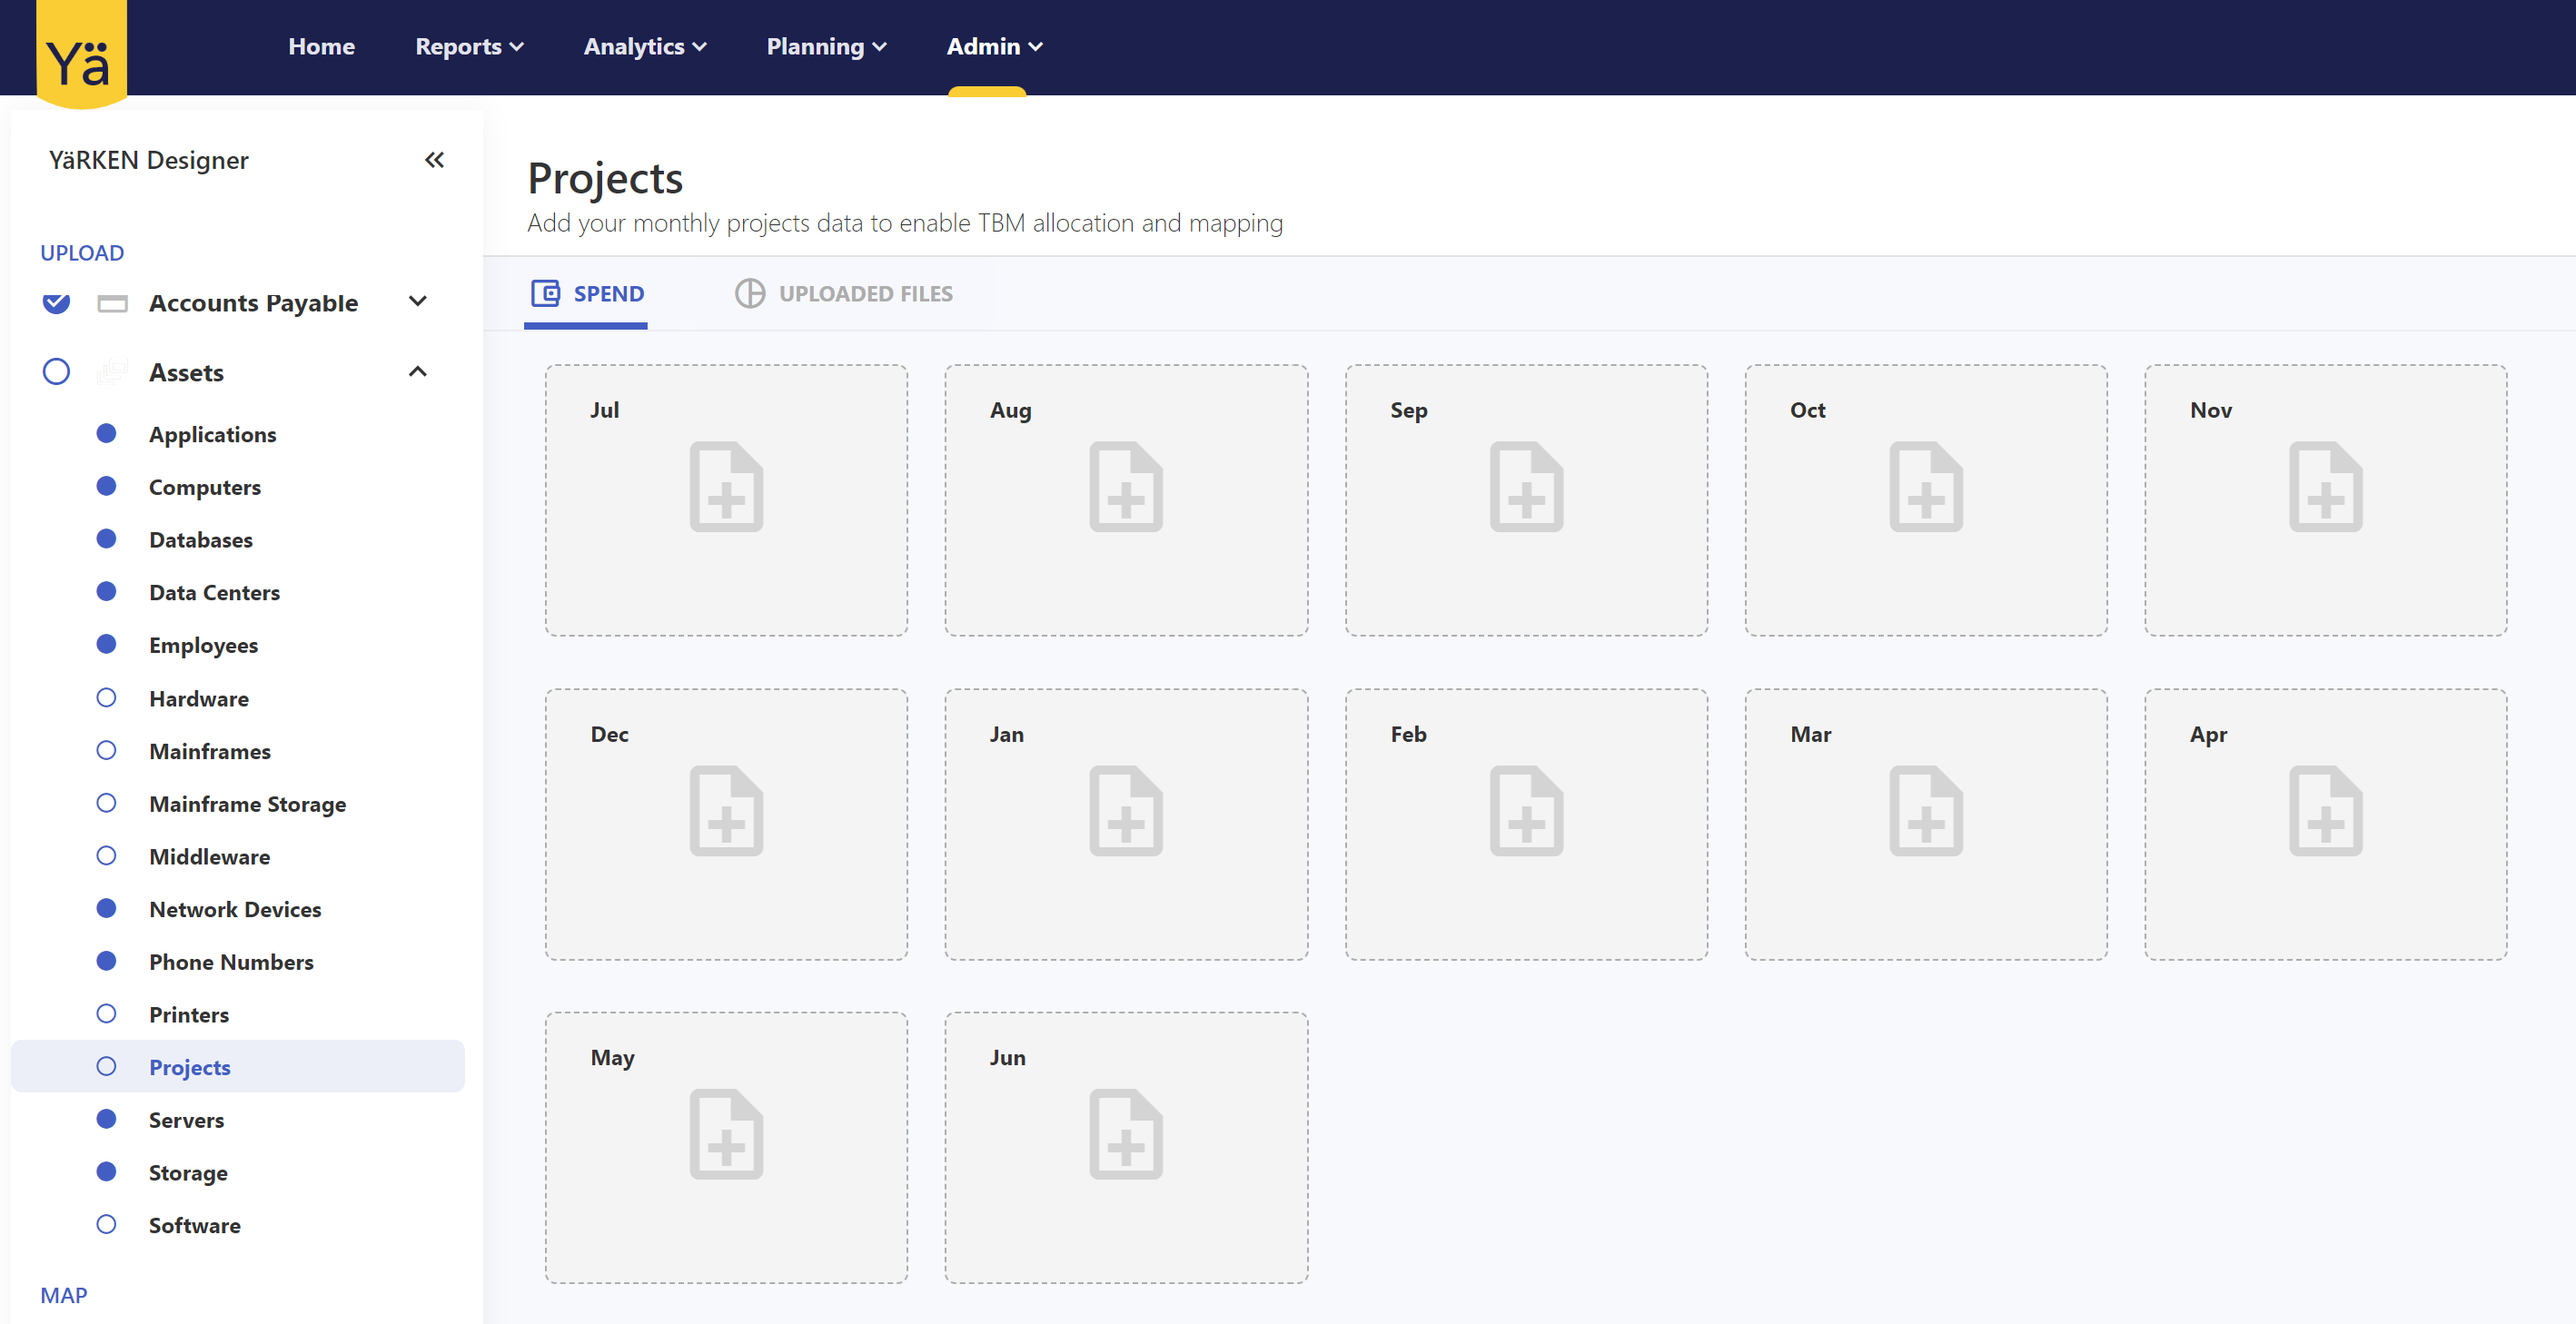
Ability to use Projects and timesheets during asset allocation of spend.
January 2, 2023
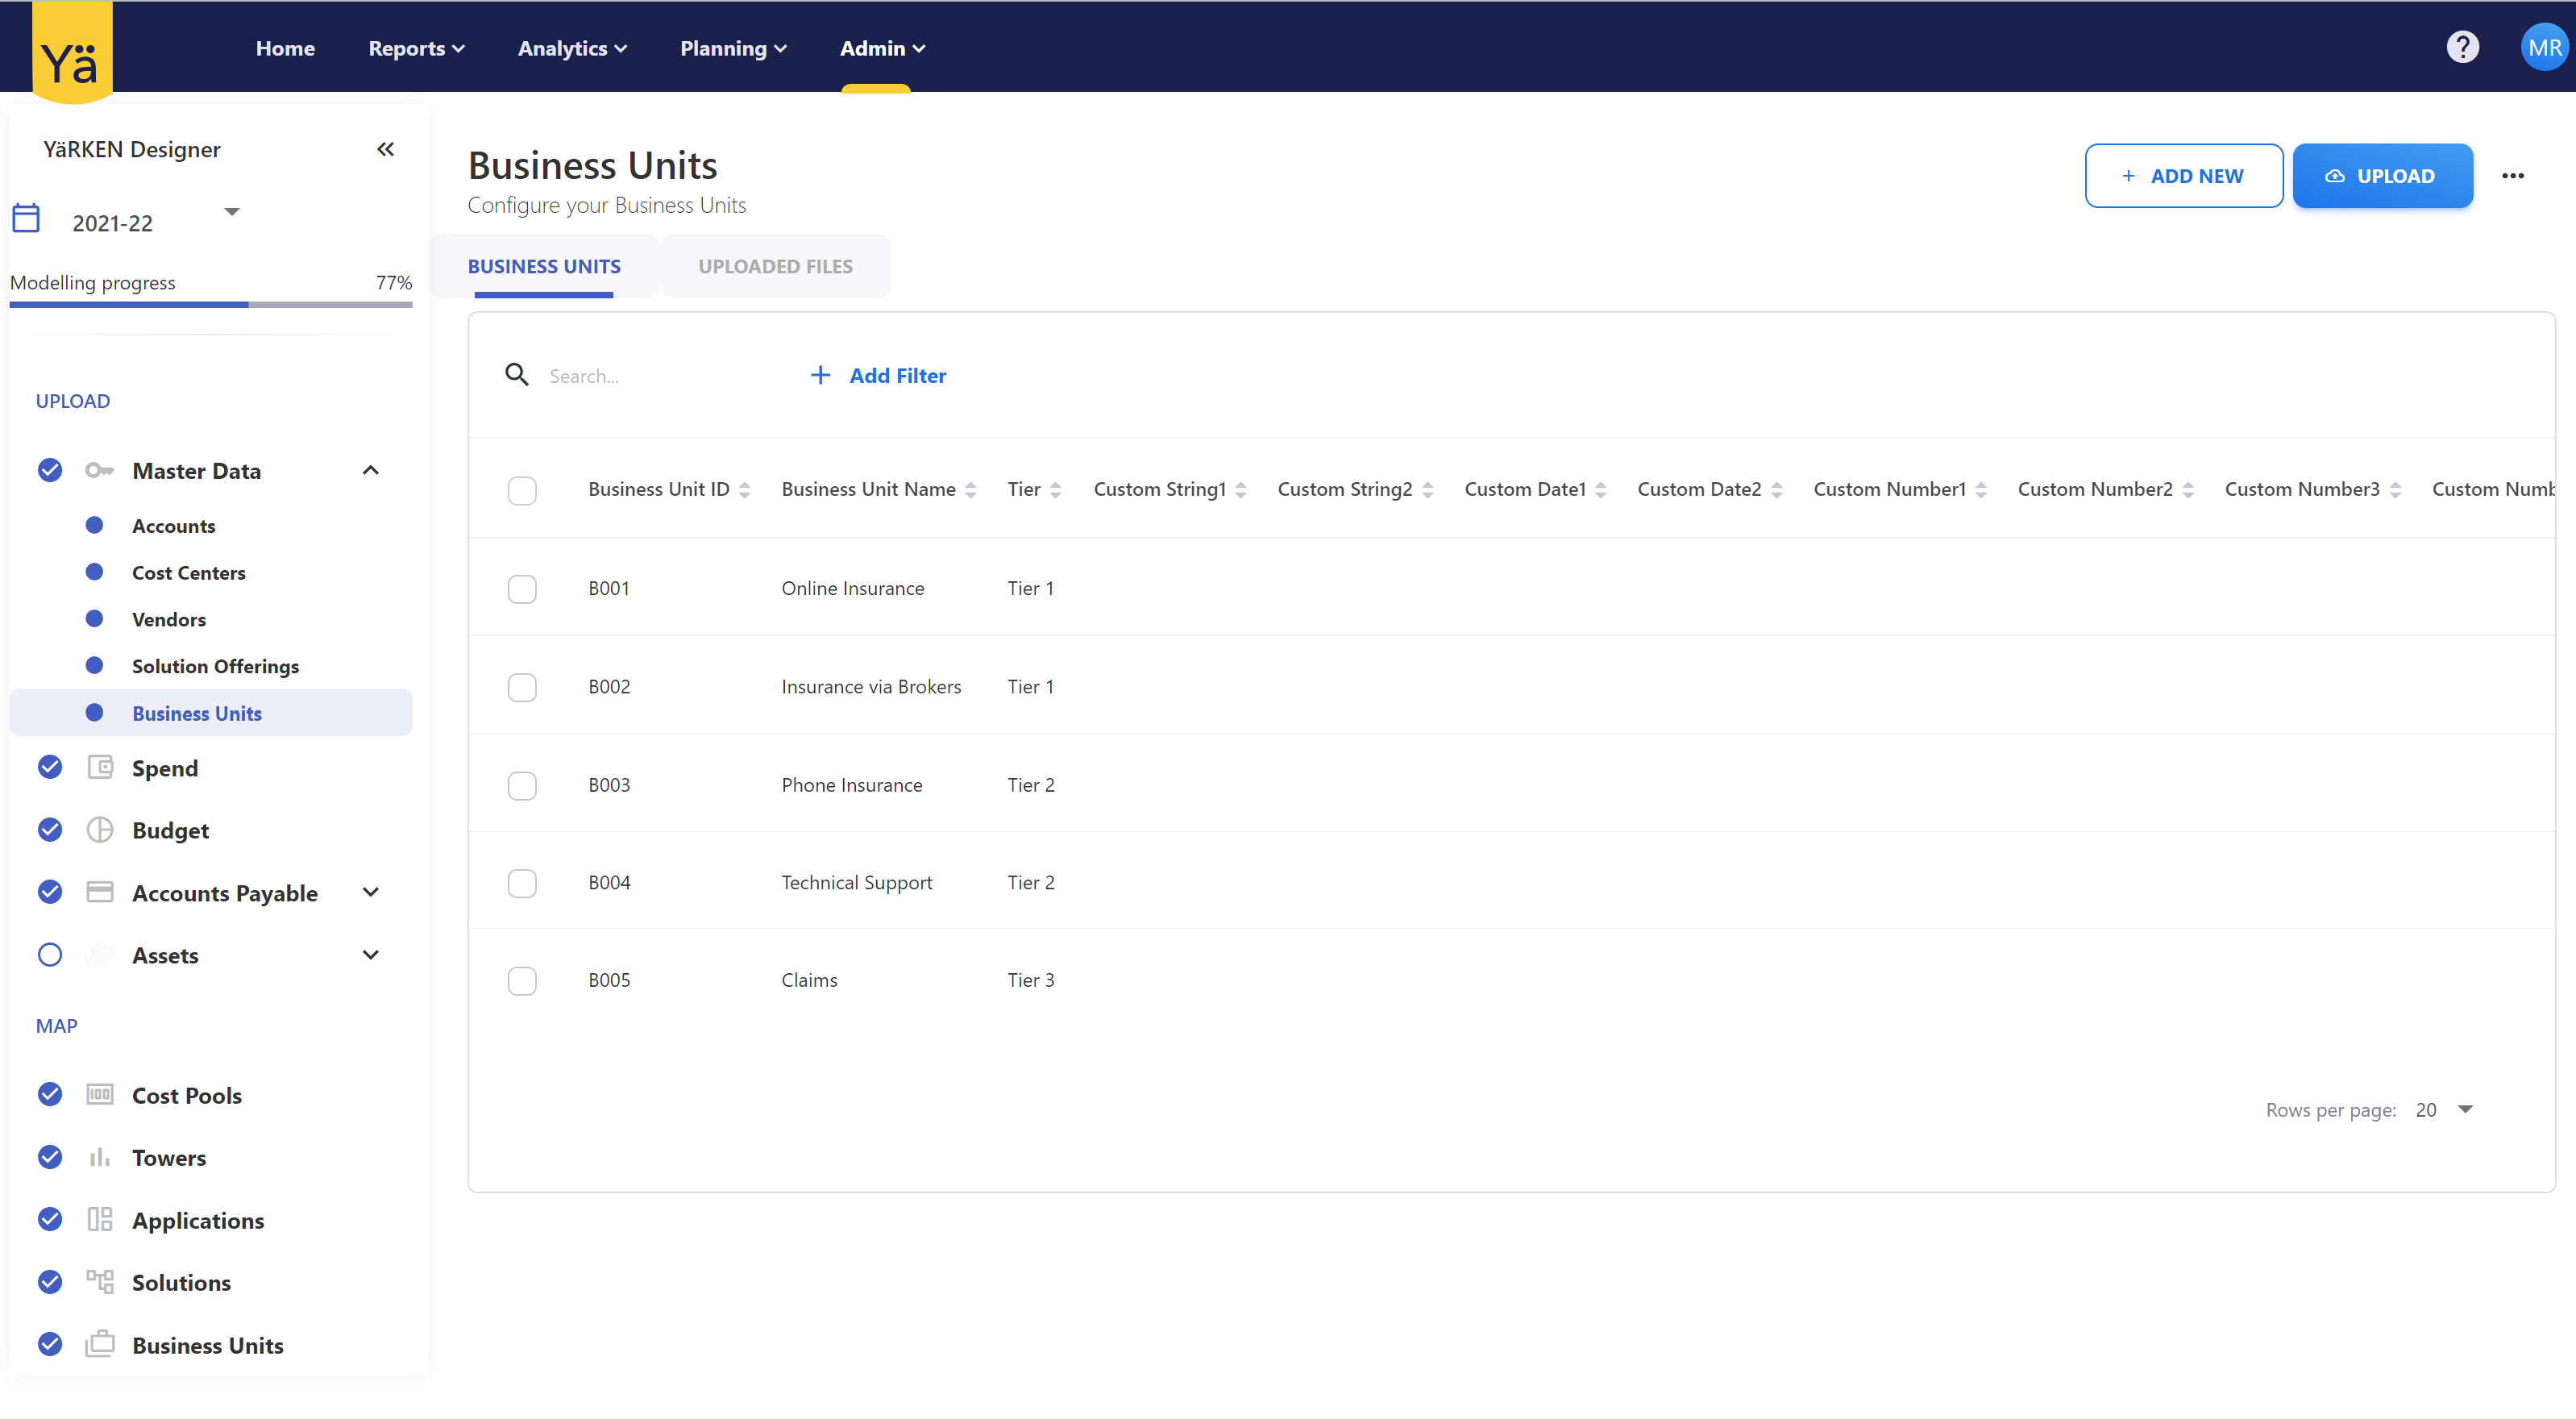
Introduction of YäRKEN Designer Advanced. We have added the capability to configure business units and have exposed solution offering in the Designer as well.
Related content