
Enhancements
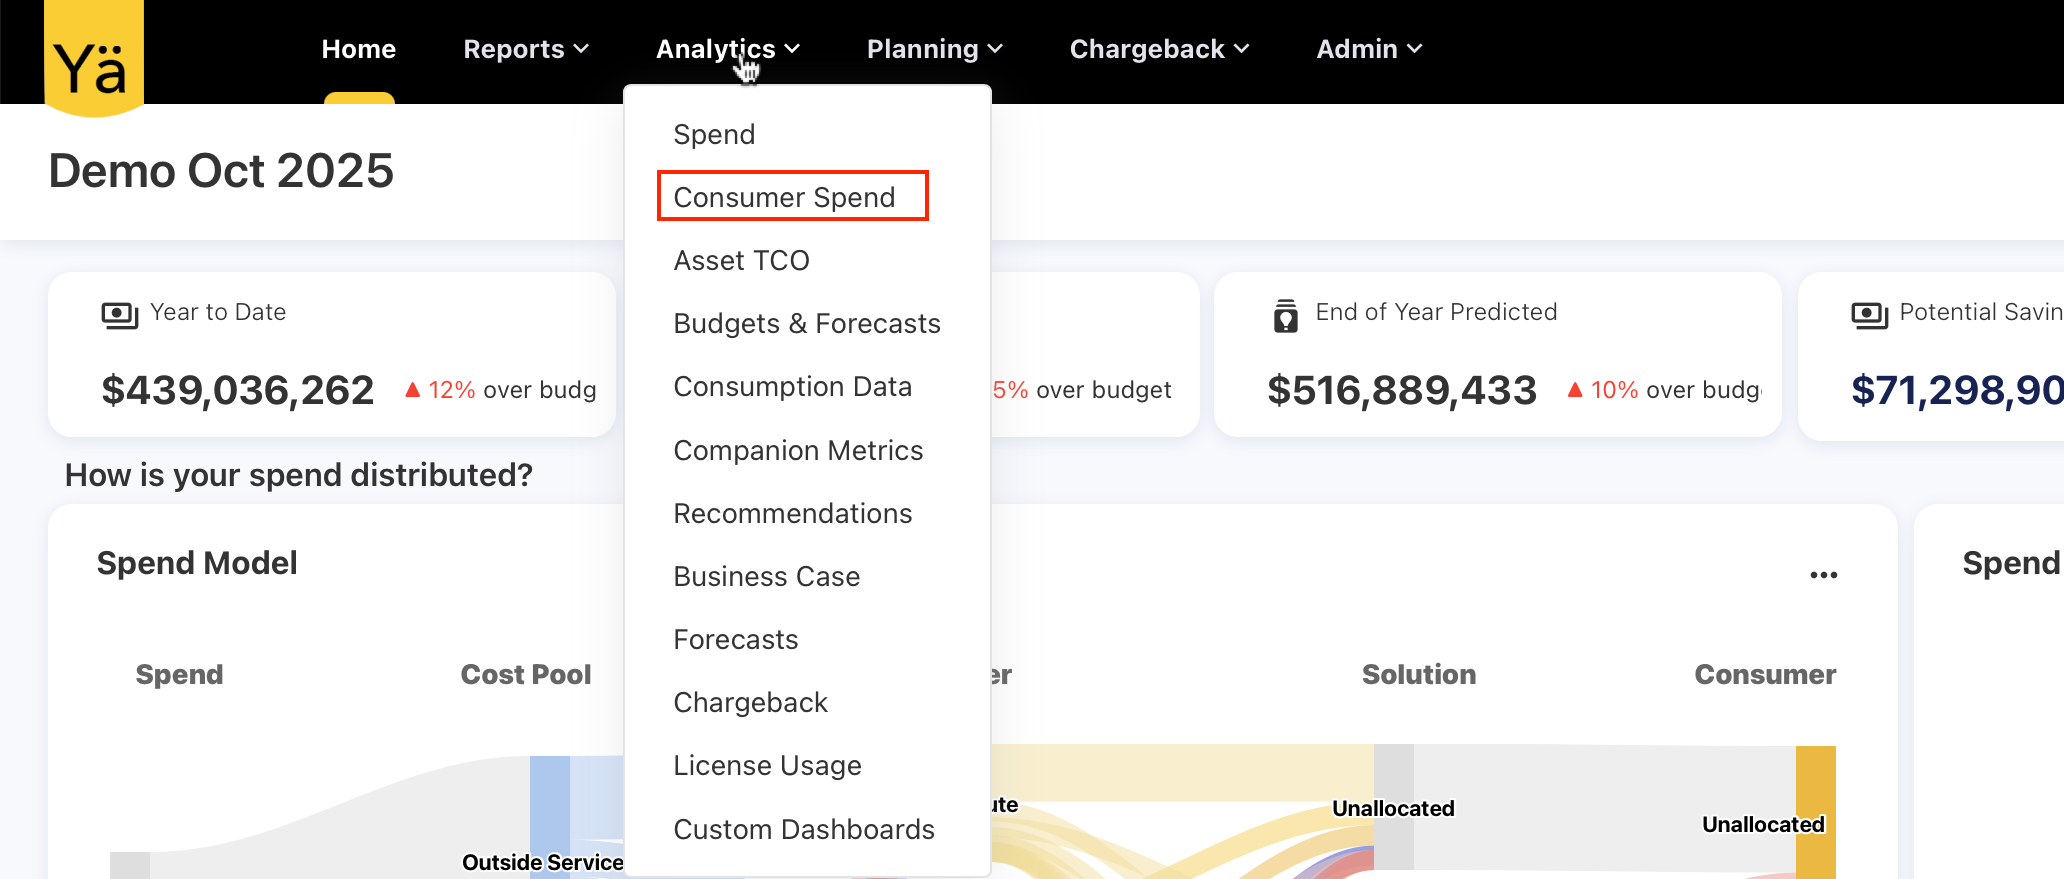
Consumer Spend Cube Separation and Multi-Query Execution
As part of ongoing cube performance optimizations, the Consumer cube has been separated from the Spend cube to improve scalability and reduce pre-aggregation processing time. By isolating consumer-related data, the system significantly reduces the complexity and duration of cube pre-aggregation, resulting in faster refresh cycles.
In addition, multi-query execution has been introduced for selected dashboards and analytics views. This enhancement allows the application to merge data from multiple cubes at query time and fetch results directly from the server instead of relying solely on a single pre-aggregated cube. Together, these changes improve cube performance and enhance query flexibility.
Enhancement
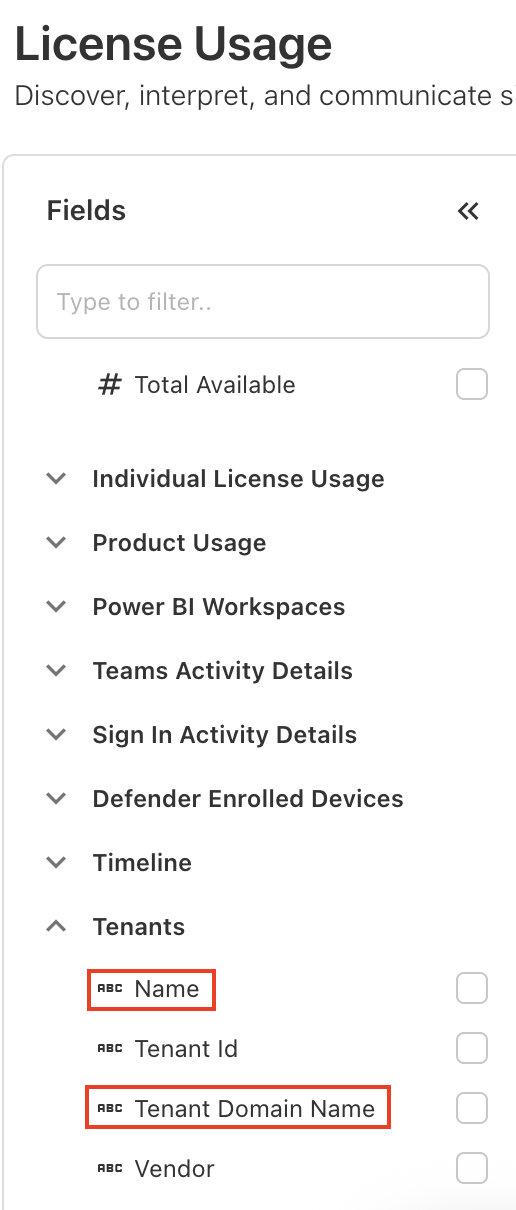
Tenant Cube Enhancements: New Name Field and Updated Labeling
We’ve introduced a new Name field in the Tenants cube and updated Tenant Name to Tenant Domain Name for better clarity. The new Name field allows you to assign a custom or friendly name based on your configured lookup types and upload rules.
When a pipeline is created via the consent URL and users want the Name field to reflect a custom value, corresponding lookup mappings must be defined. If no lookup types or upload rules are configured, the application will default the Name field to the Tenant Name.
Enhancements and bug fixes
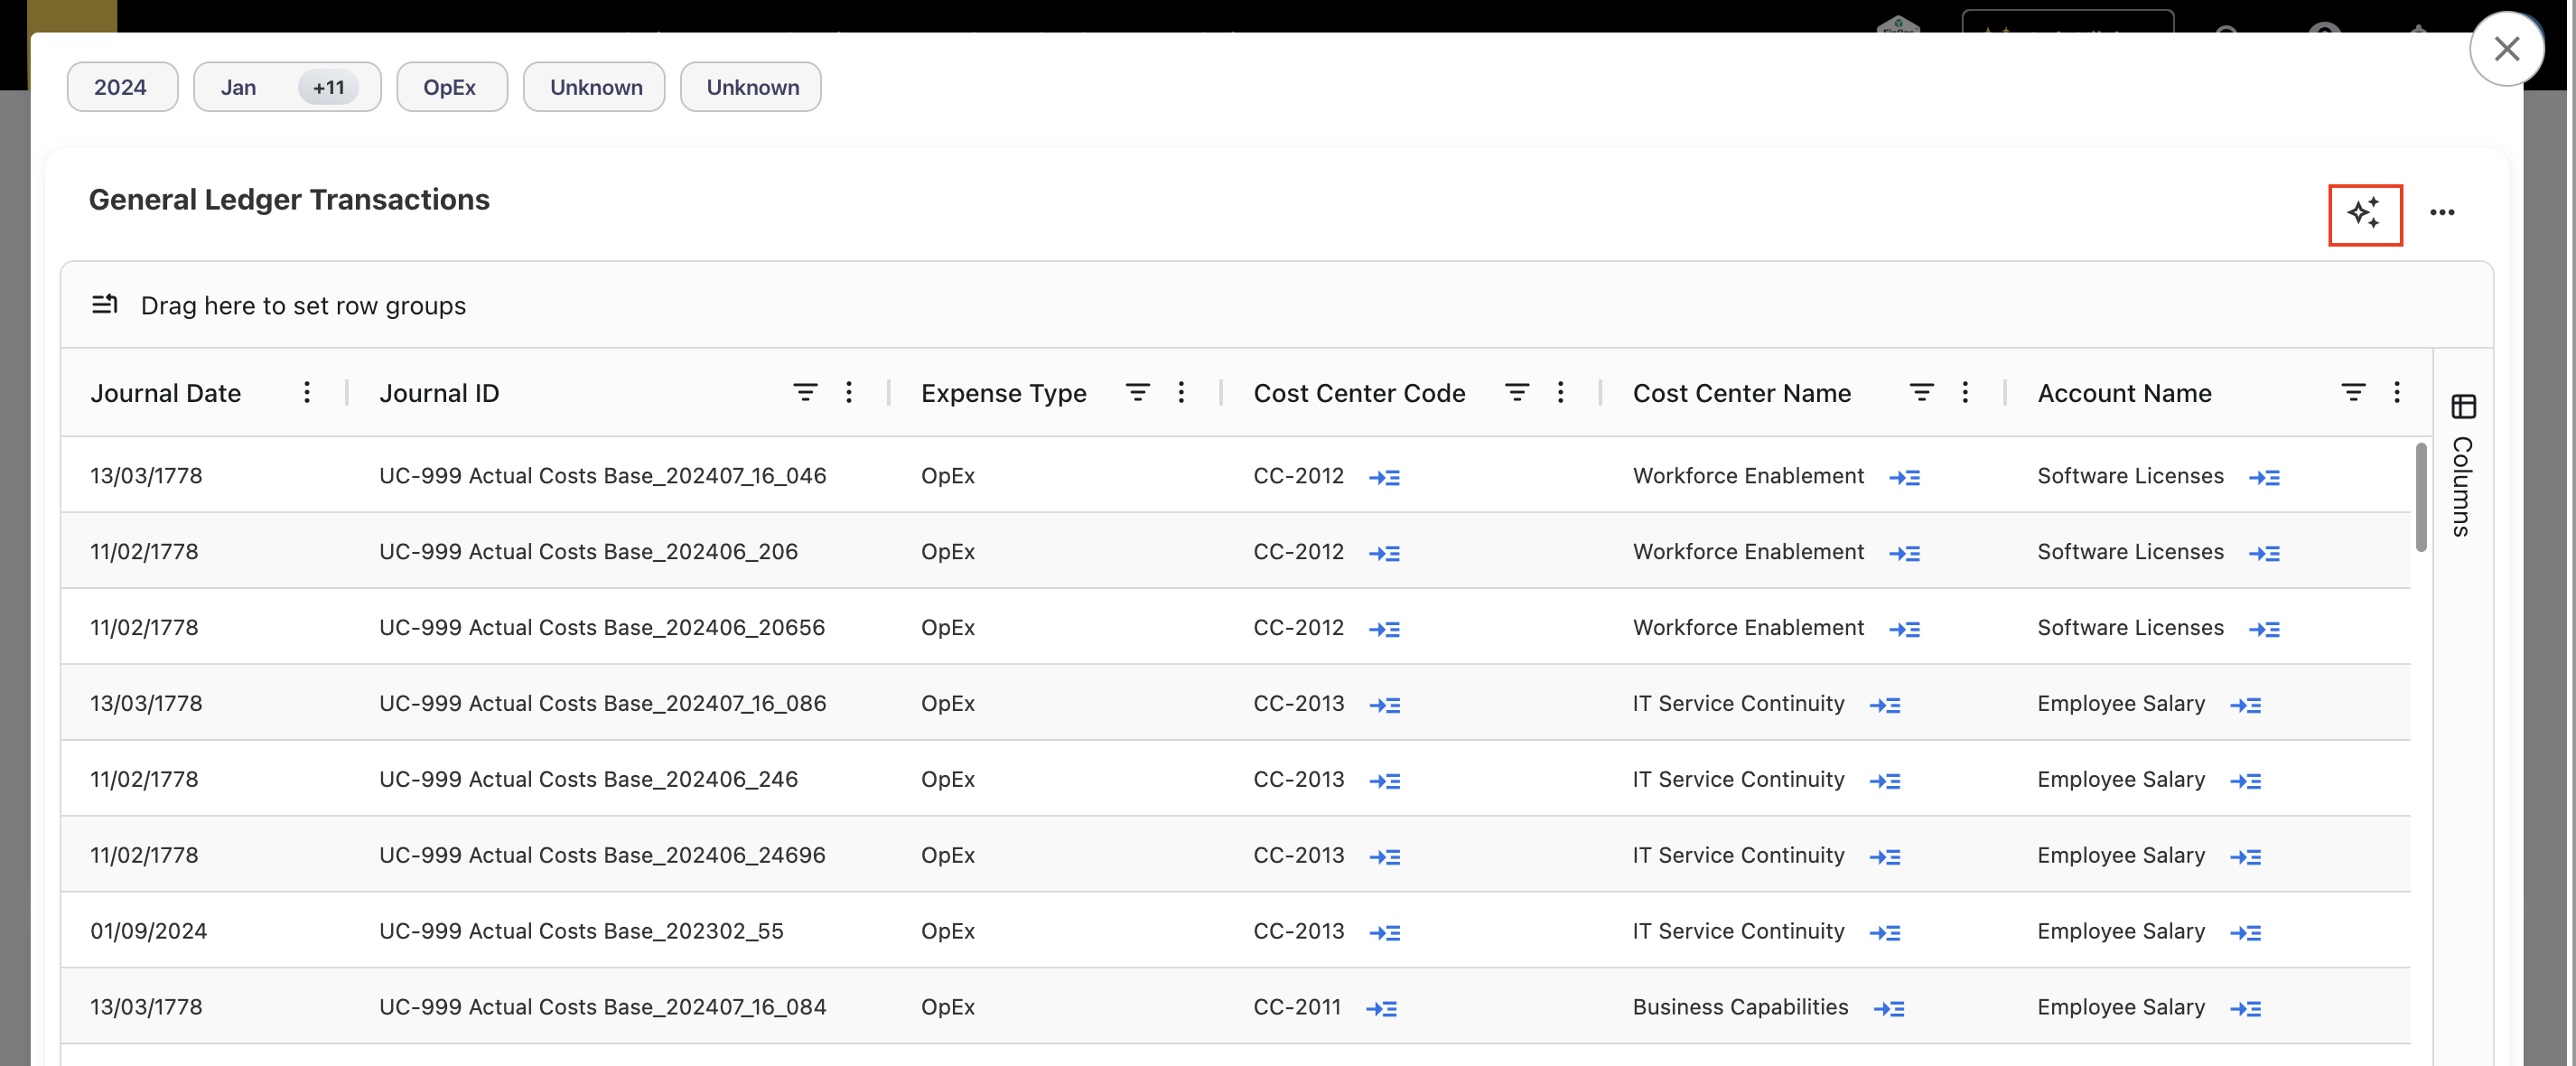
Ask YäRKEN for Tables
We’ve expanded the Ask YäRKEN’s capability across the application to make insights easier and faster to access. Ask YäRKEN is now available on all tabular views in dashboards and reports, helping users quickly interpret table data. We’ve also enabled Ask YäRKEN on GL transaction popups.
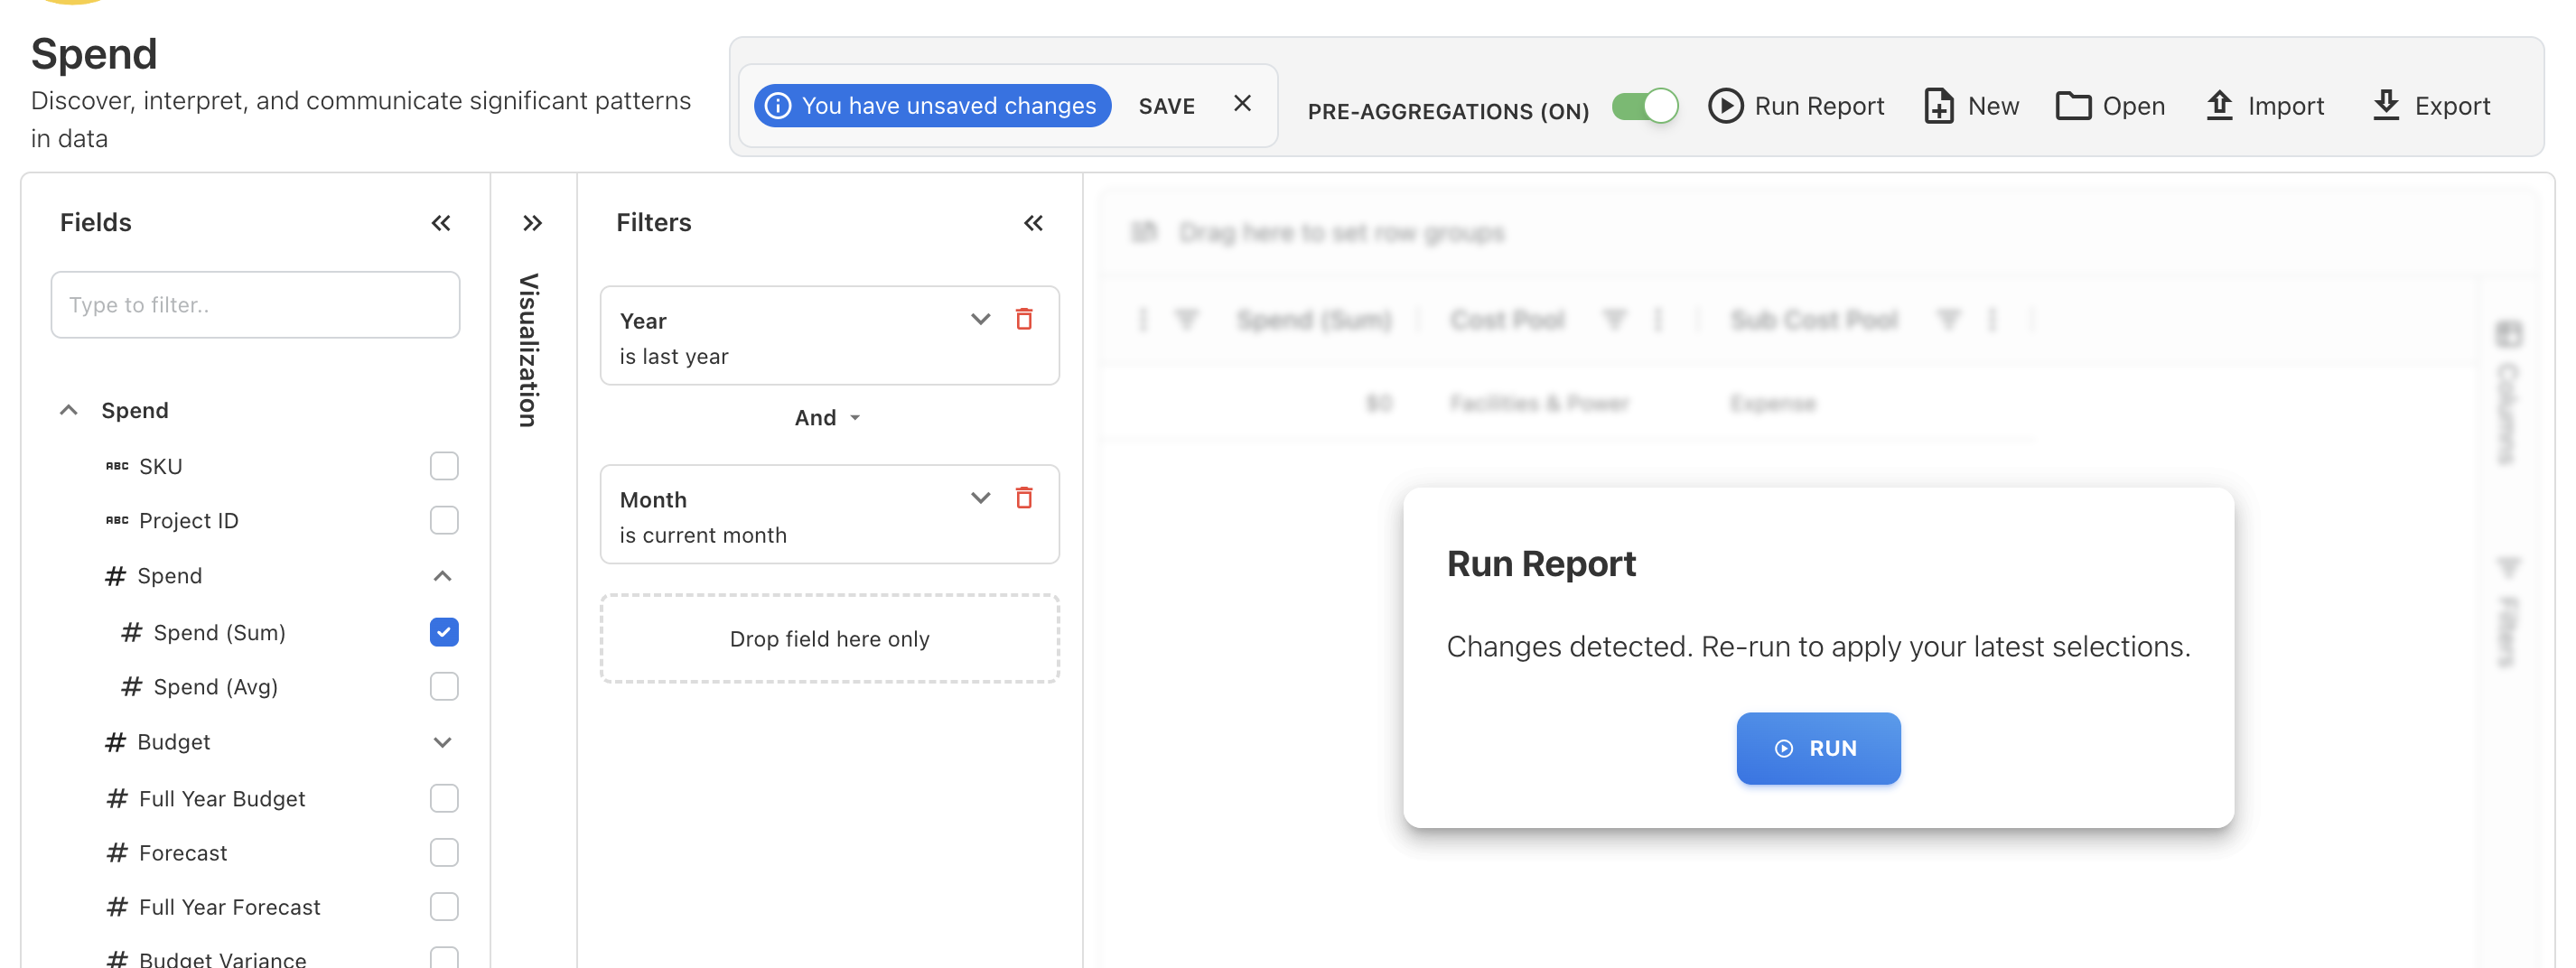
Performance Improvement – Explicit Run Report in Analytics & Custom Dashboards
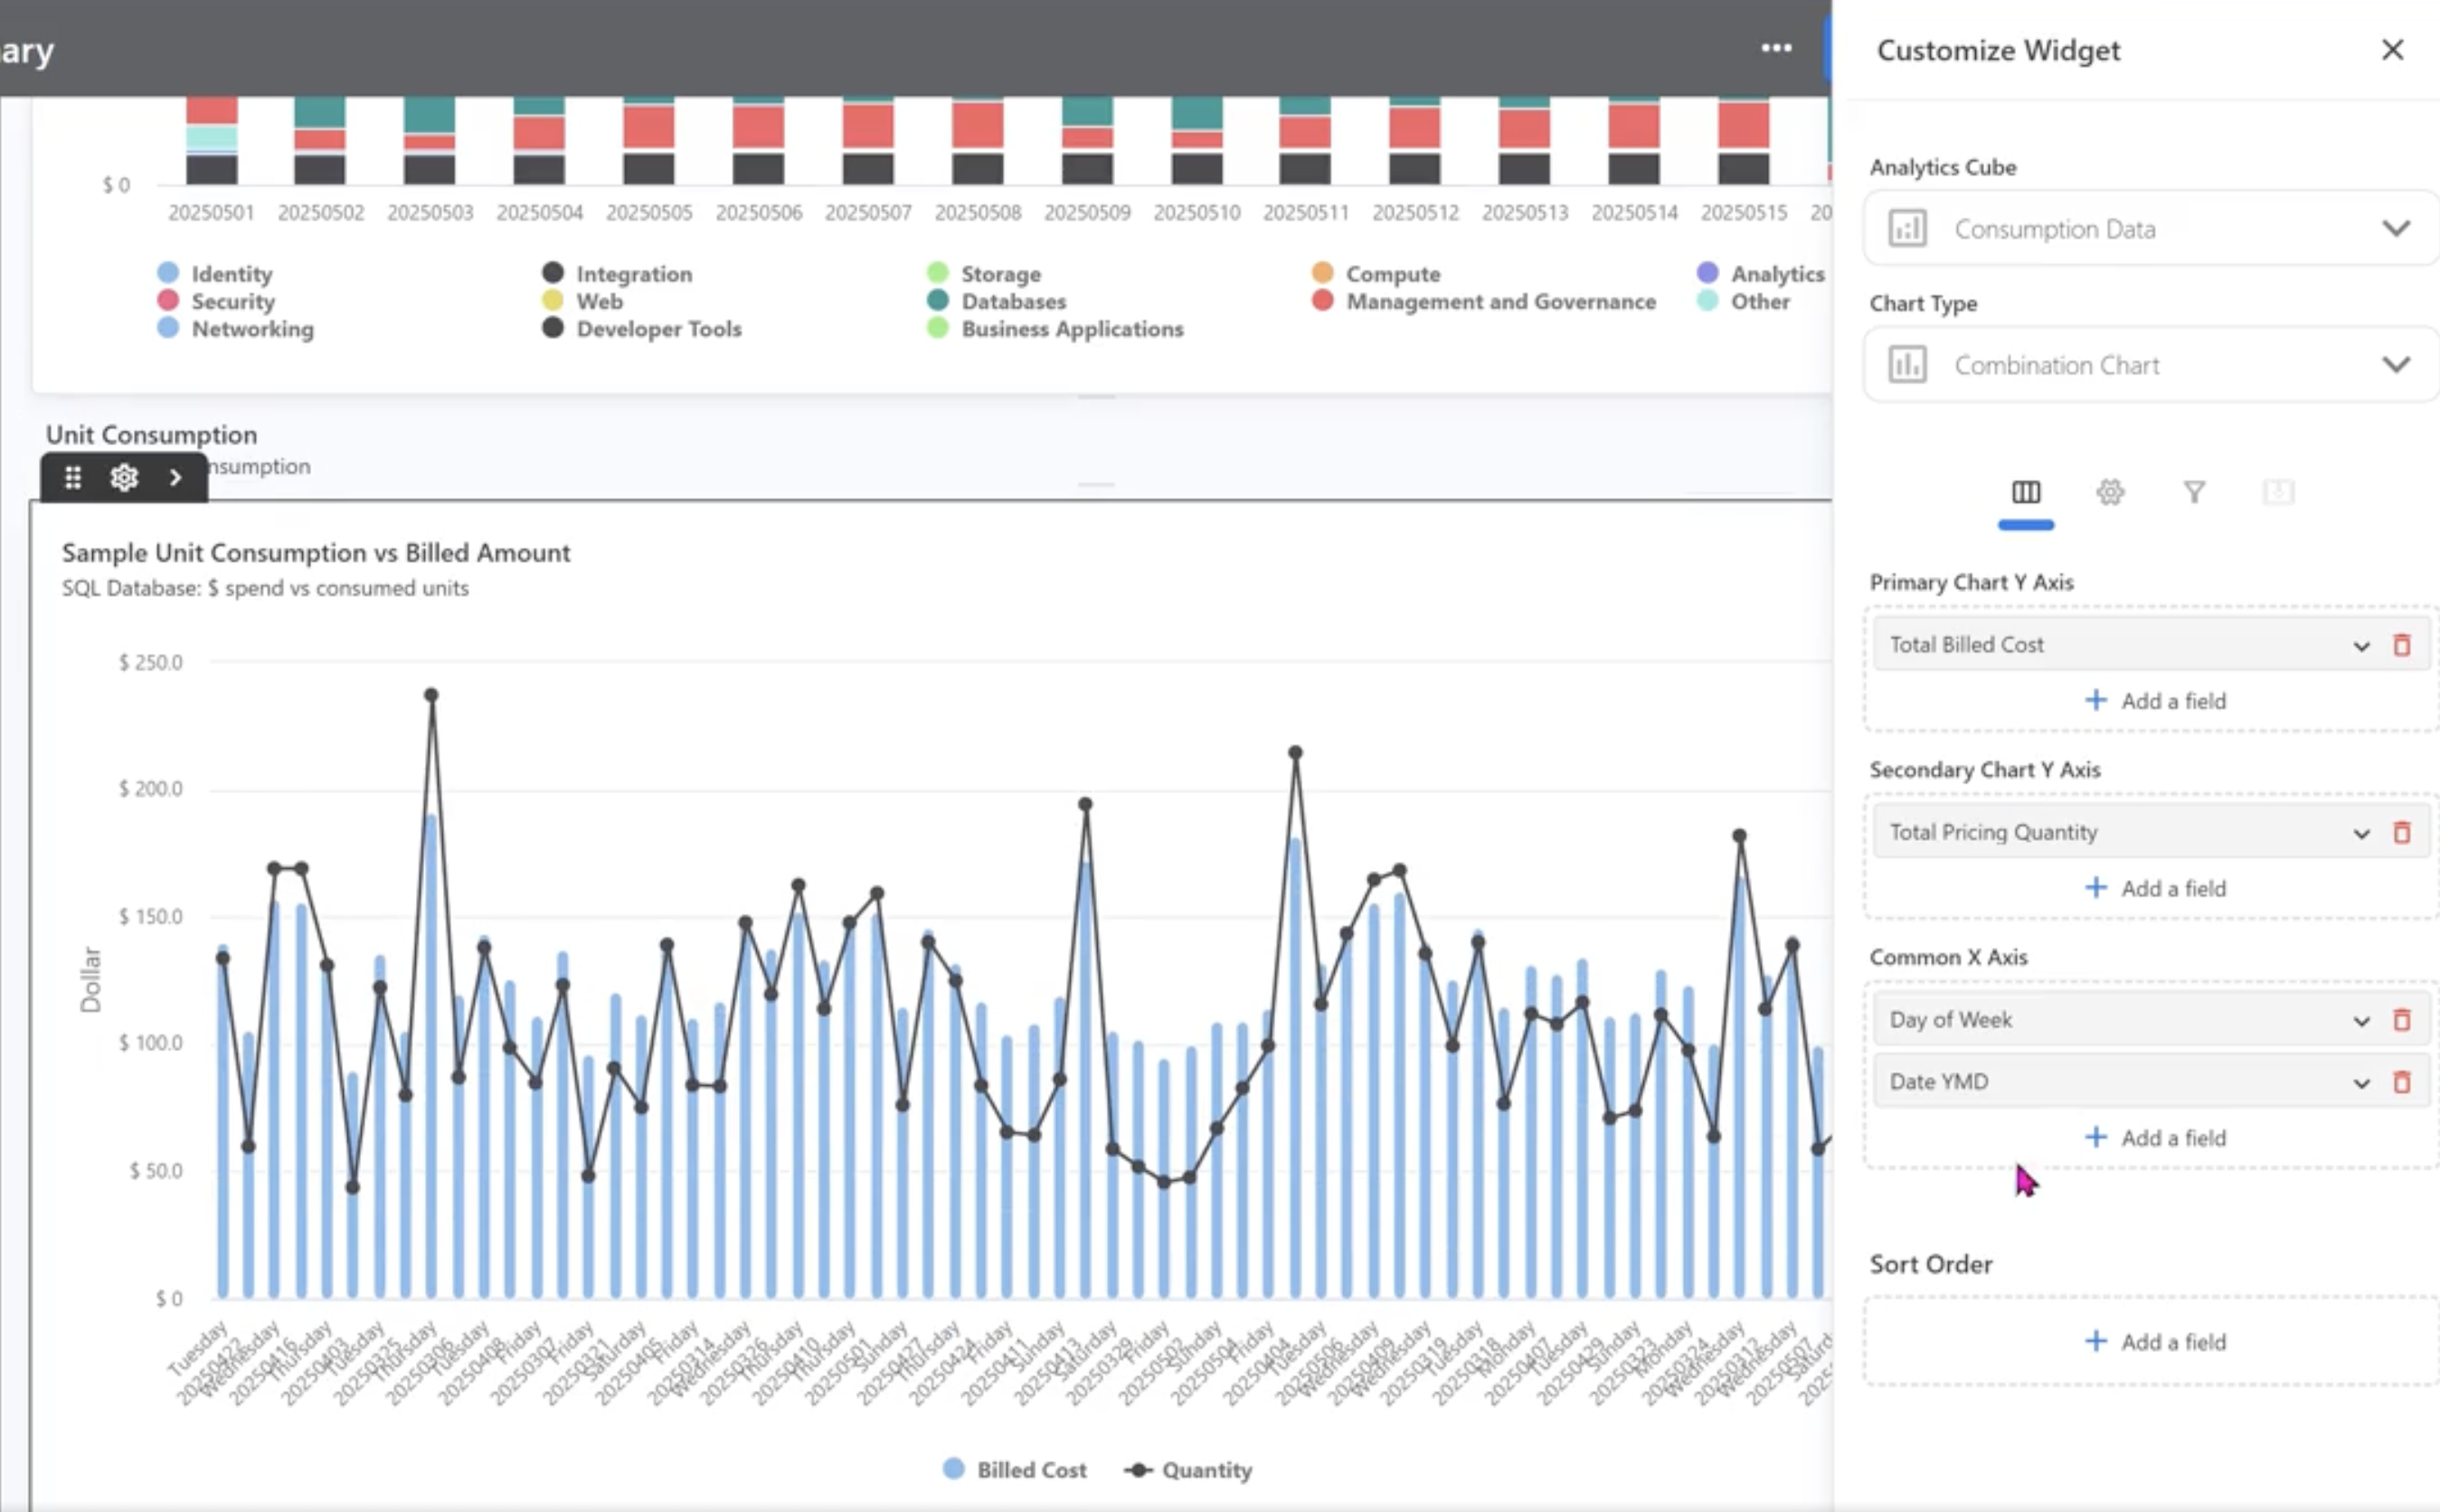
To improve performance and reduce unnecessary cube/database queries, Analytics and Custom Dashboards now executes fewer automatic calls. Previously, every change—such as adding a field, modifying filters, or updating visual settings—would immediately trigger an implicit query, causing slowdowns and unnecessary processing.
With this enhancement, Analytics and Custom Dashboards now detects changes and prompts you with a Run Report dialog. This indicates that modifications have been made and allows you to explicitly choose when to refresh the results. The report is only re-run after you confirm, significantly improving overall responsiveness and reducing backend load.
Enhancements and bug fixes
Month Filter Fix for Reopening Charts in Analytics
An issue was identified in the Open in Analytics option where updated month filters were not being passed correctly after the initial launch. For example, if a chart was opened in Analytics with filters set from January to October and later reopened with an expanded filter range (e.g., January to December), the additional months (November–December) did not appear in Analytics.
This issue is now fixed. Open in Analytics always applies the latest month filter selection and ensures all newly selected months display correctly in Analytics every time you reopen a chart.
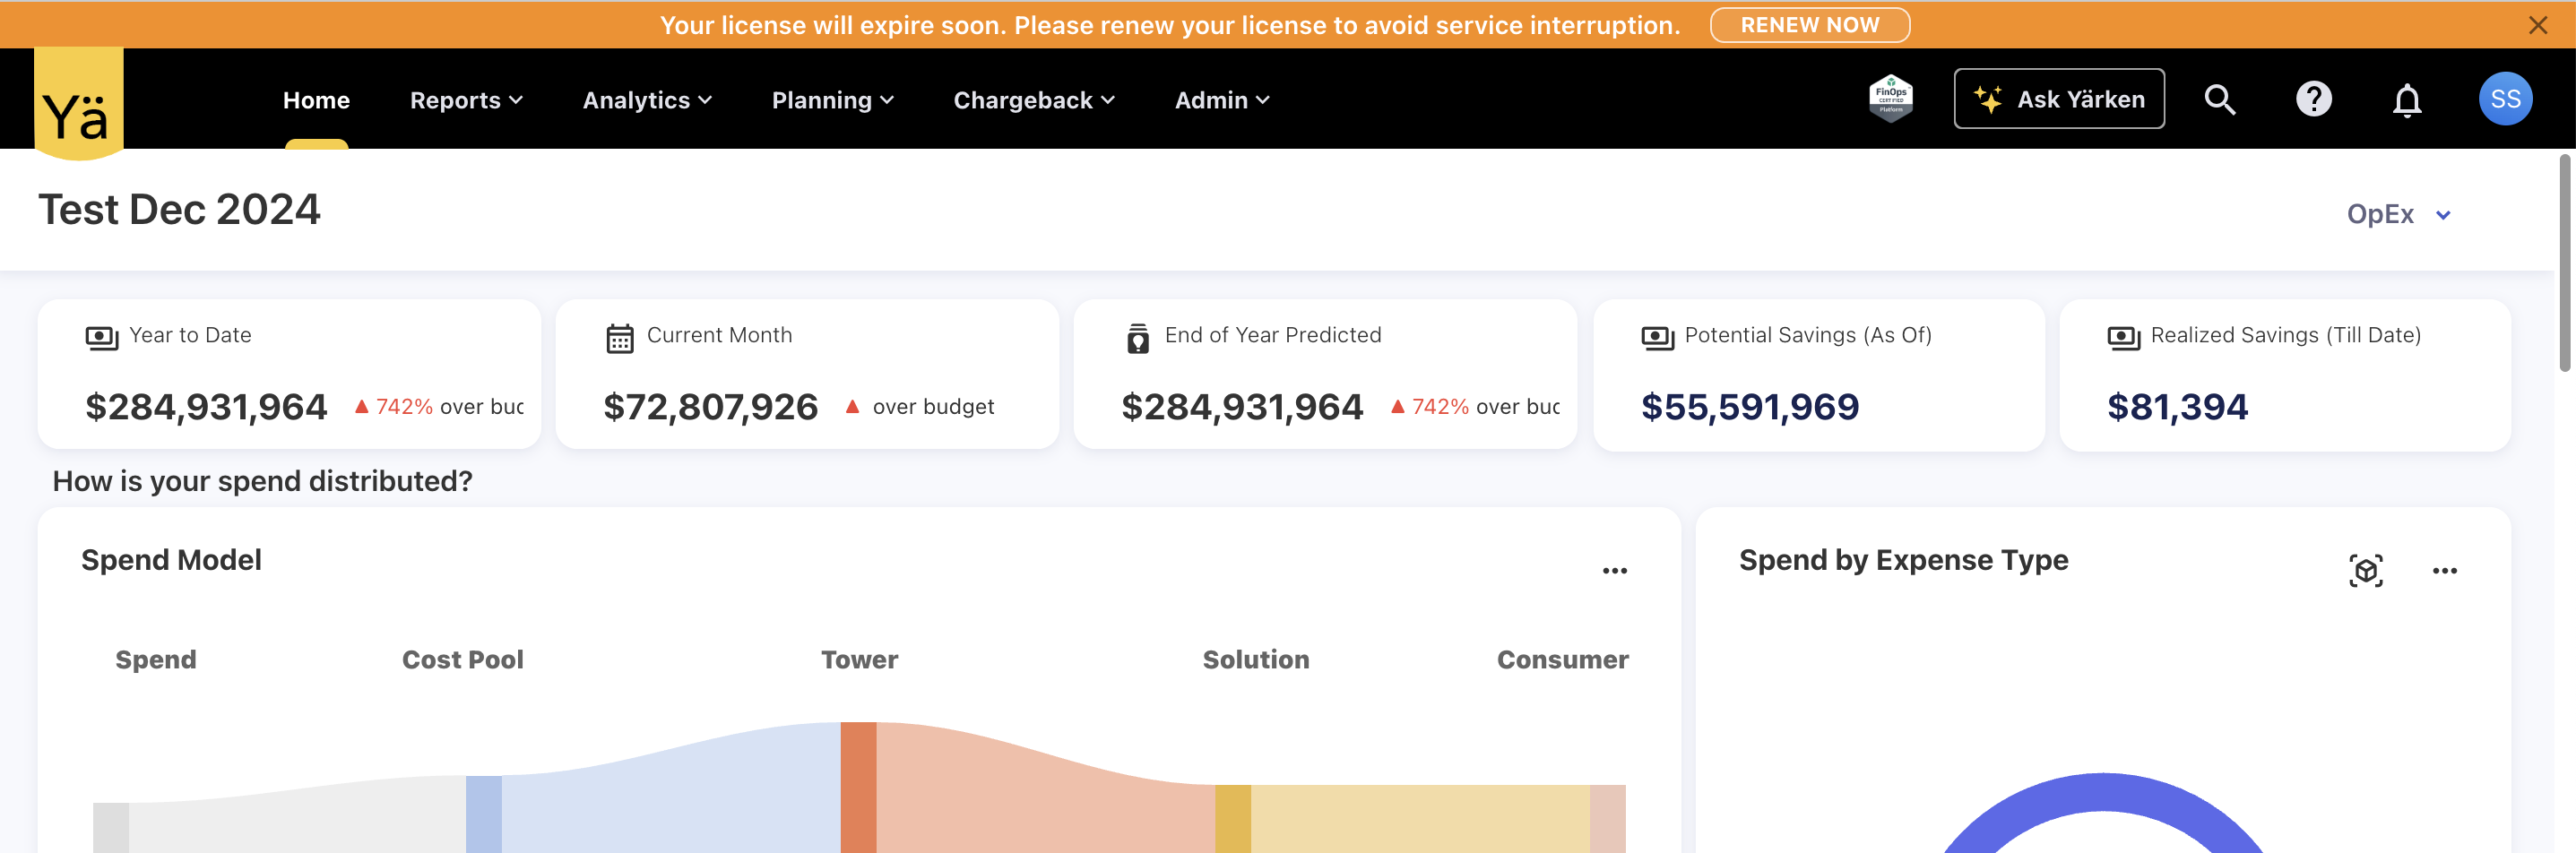
Upcoming License Expiry Warning
A new early-warning notification is added to help admin proactively manage license renewals. The application will now display a license expiration warning 30 days before the license end date. This ensures that the customers have sufficient time to renew before access is impacted.
Note: All existing customer instances with licenses set to expire this year have been granted an extension. These licenses are now valid until 31 March 2026.
Relative Date Auto Refresh on Custom Dashboards
An issue was identified on the custom dashboard’s relative date filters where cloud-related metrics and charts on custom dashboards—specifically those using last n days or last n months filters—were not refreshing after cloud consumption data was reloaded. These widgets continued to reference the date or month from when they were originally created, resulting in outdated values. The widgets only refreshed if the user entered Edit mode, which was not the expected behavior.
This issue has now been fully resolved. Metrics and charts that rely on relative date filters (such as Last 7 Days, Last 30 Days, Last Month, etc.) will correctly recalculate based on the current system date, ensuring they always display the most recent cloud consumption data immediately after reload—without requiring any manual editing.
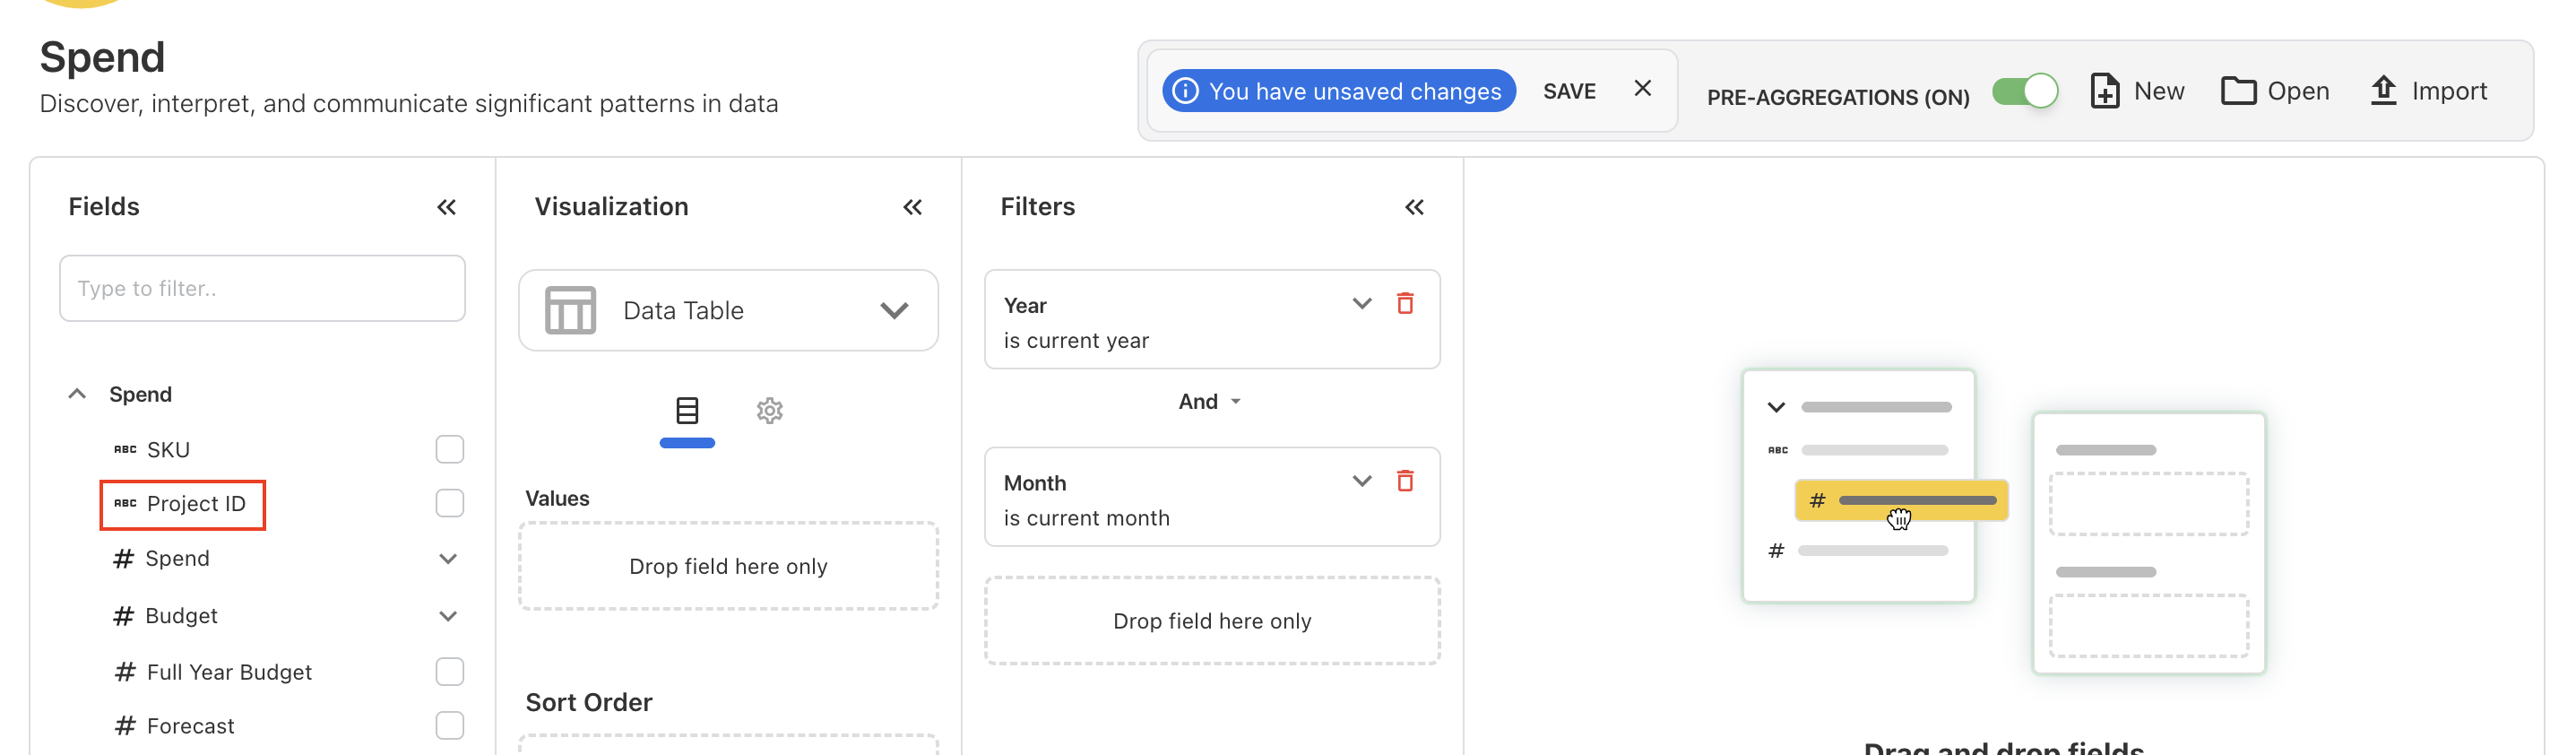
Reporting on Project ID
You can now report on Project ID across spend, budget, and forecast data. The Project ID field is fully available in Analytics, allowing you to filter, group, and analyze financial data by project. With this update, teams can track spend patterns and compare planned vs. actual values at the project level with greater clarity.
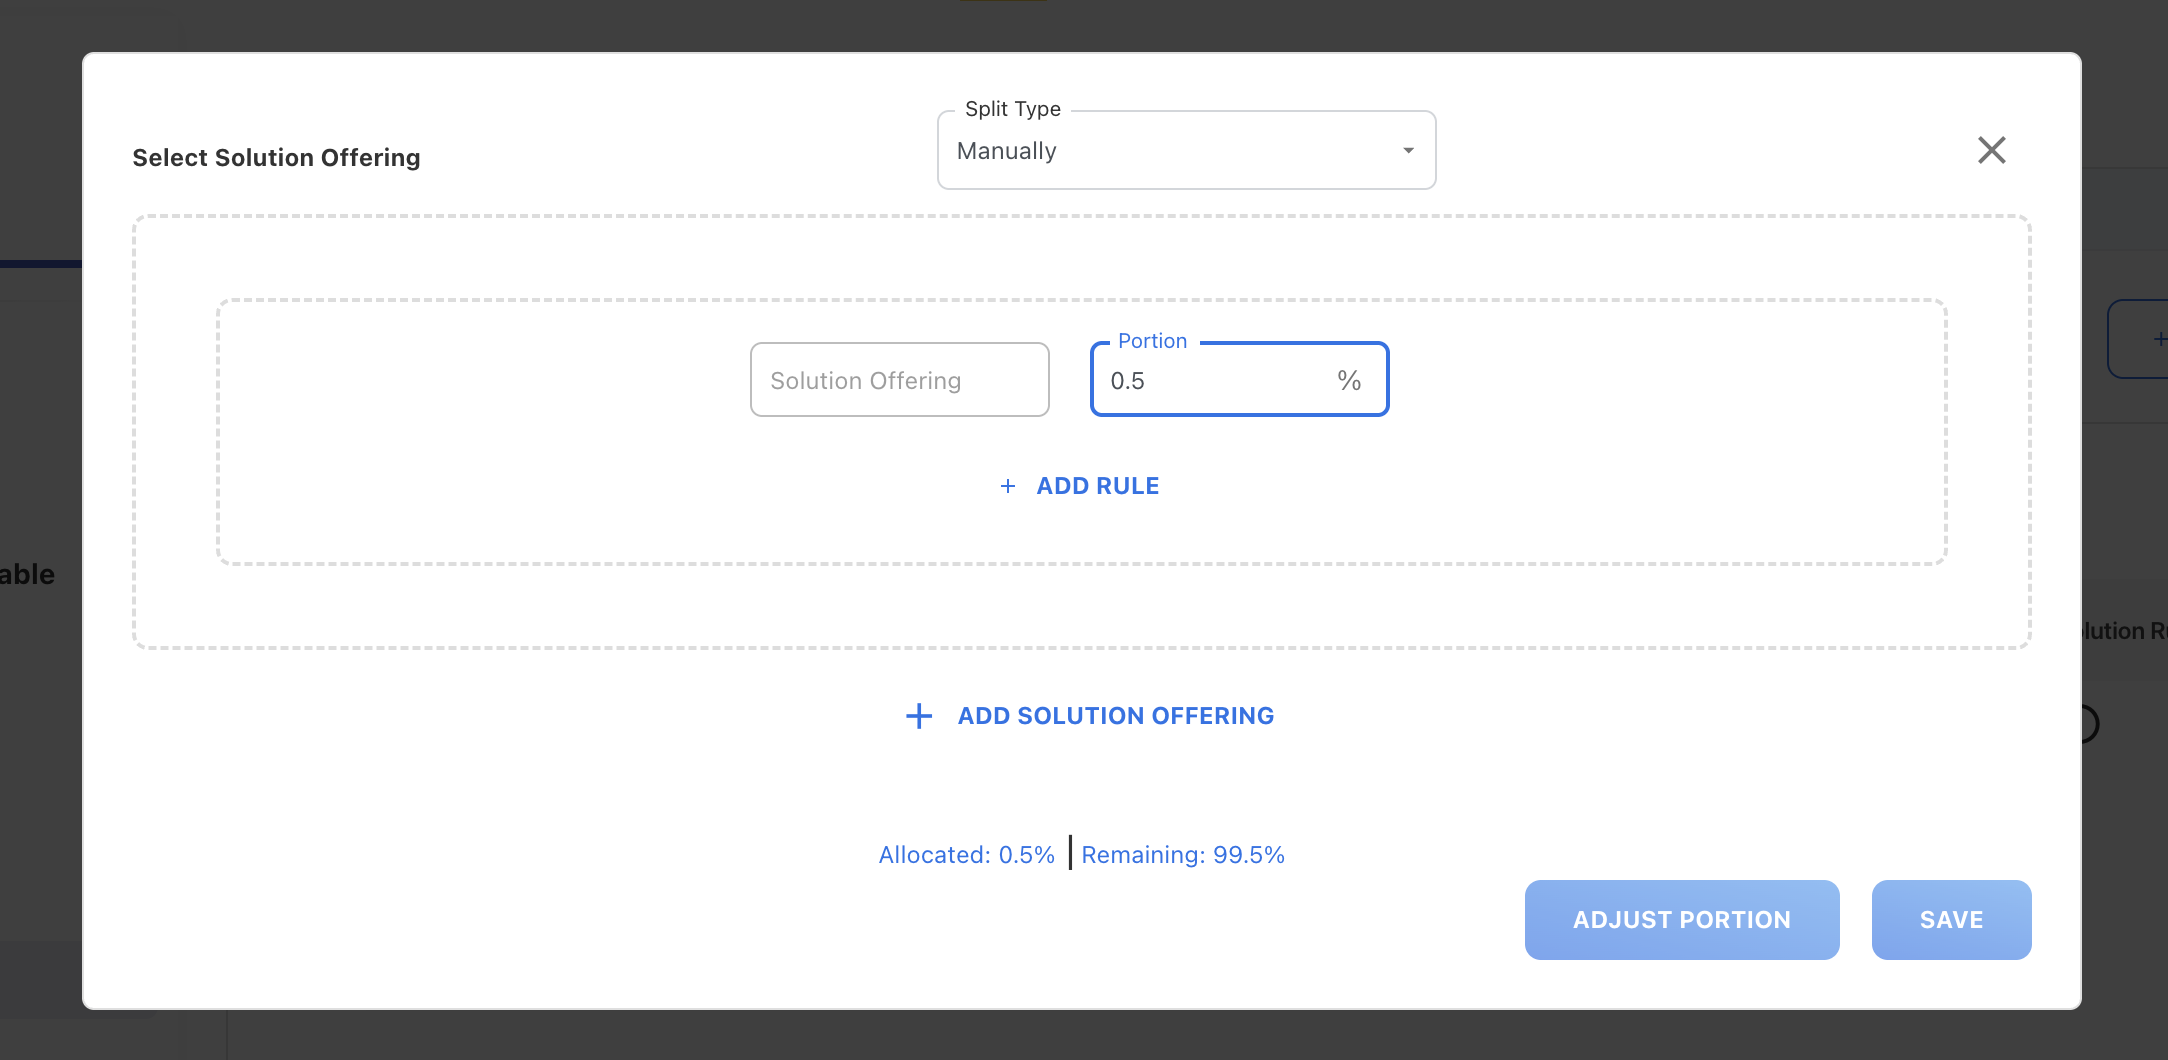
Decimal Portion for Solution Rules
In the Solution Rule configuration, you now enter decimal portion values between 0 and 1 (such as 0.1, 0.25, 0.75) without interruption. Previously, real-time validation prevented entering values that began with 0, making it difficult to record fractional portions. This has now been fully resolved. Validation is applied after the user finishes typing. Users can freely enter precise decimal values without interruption.
Enhancements and bug fixes
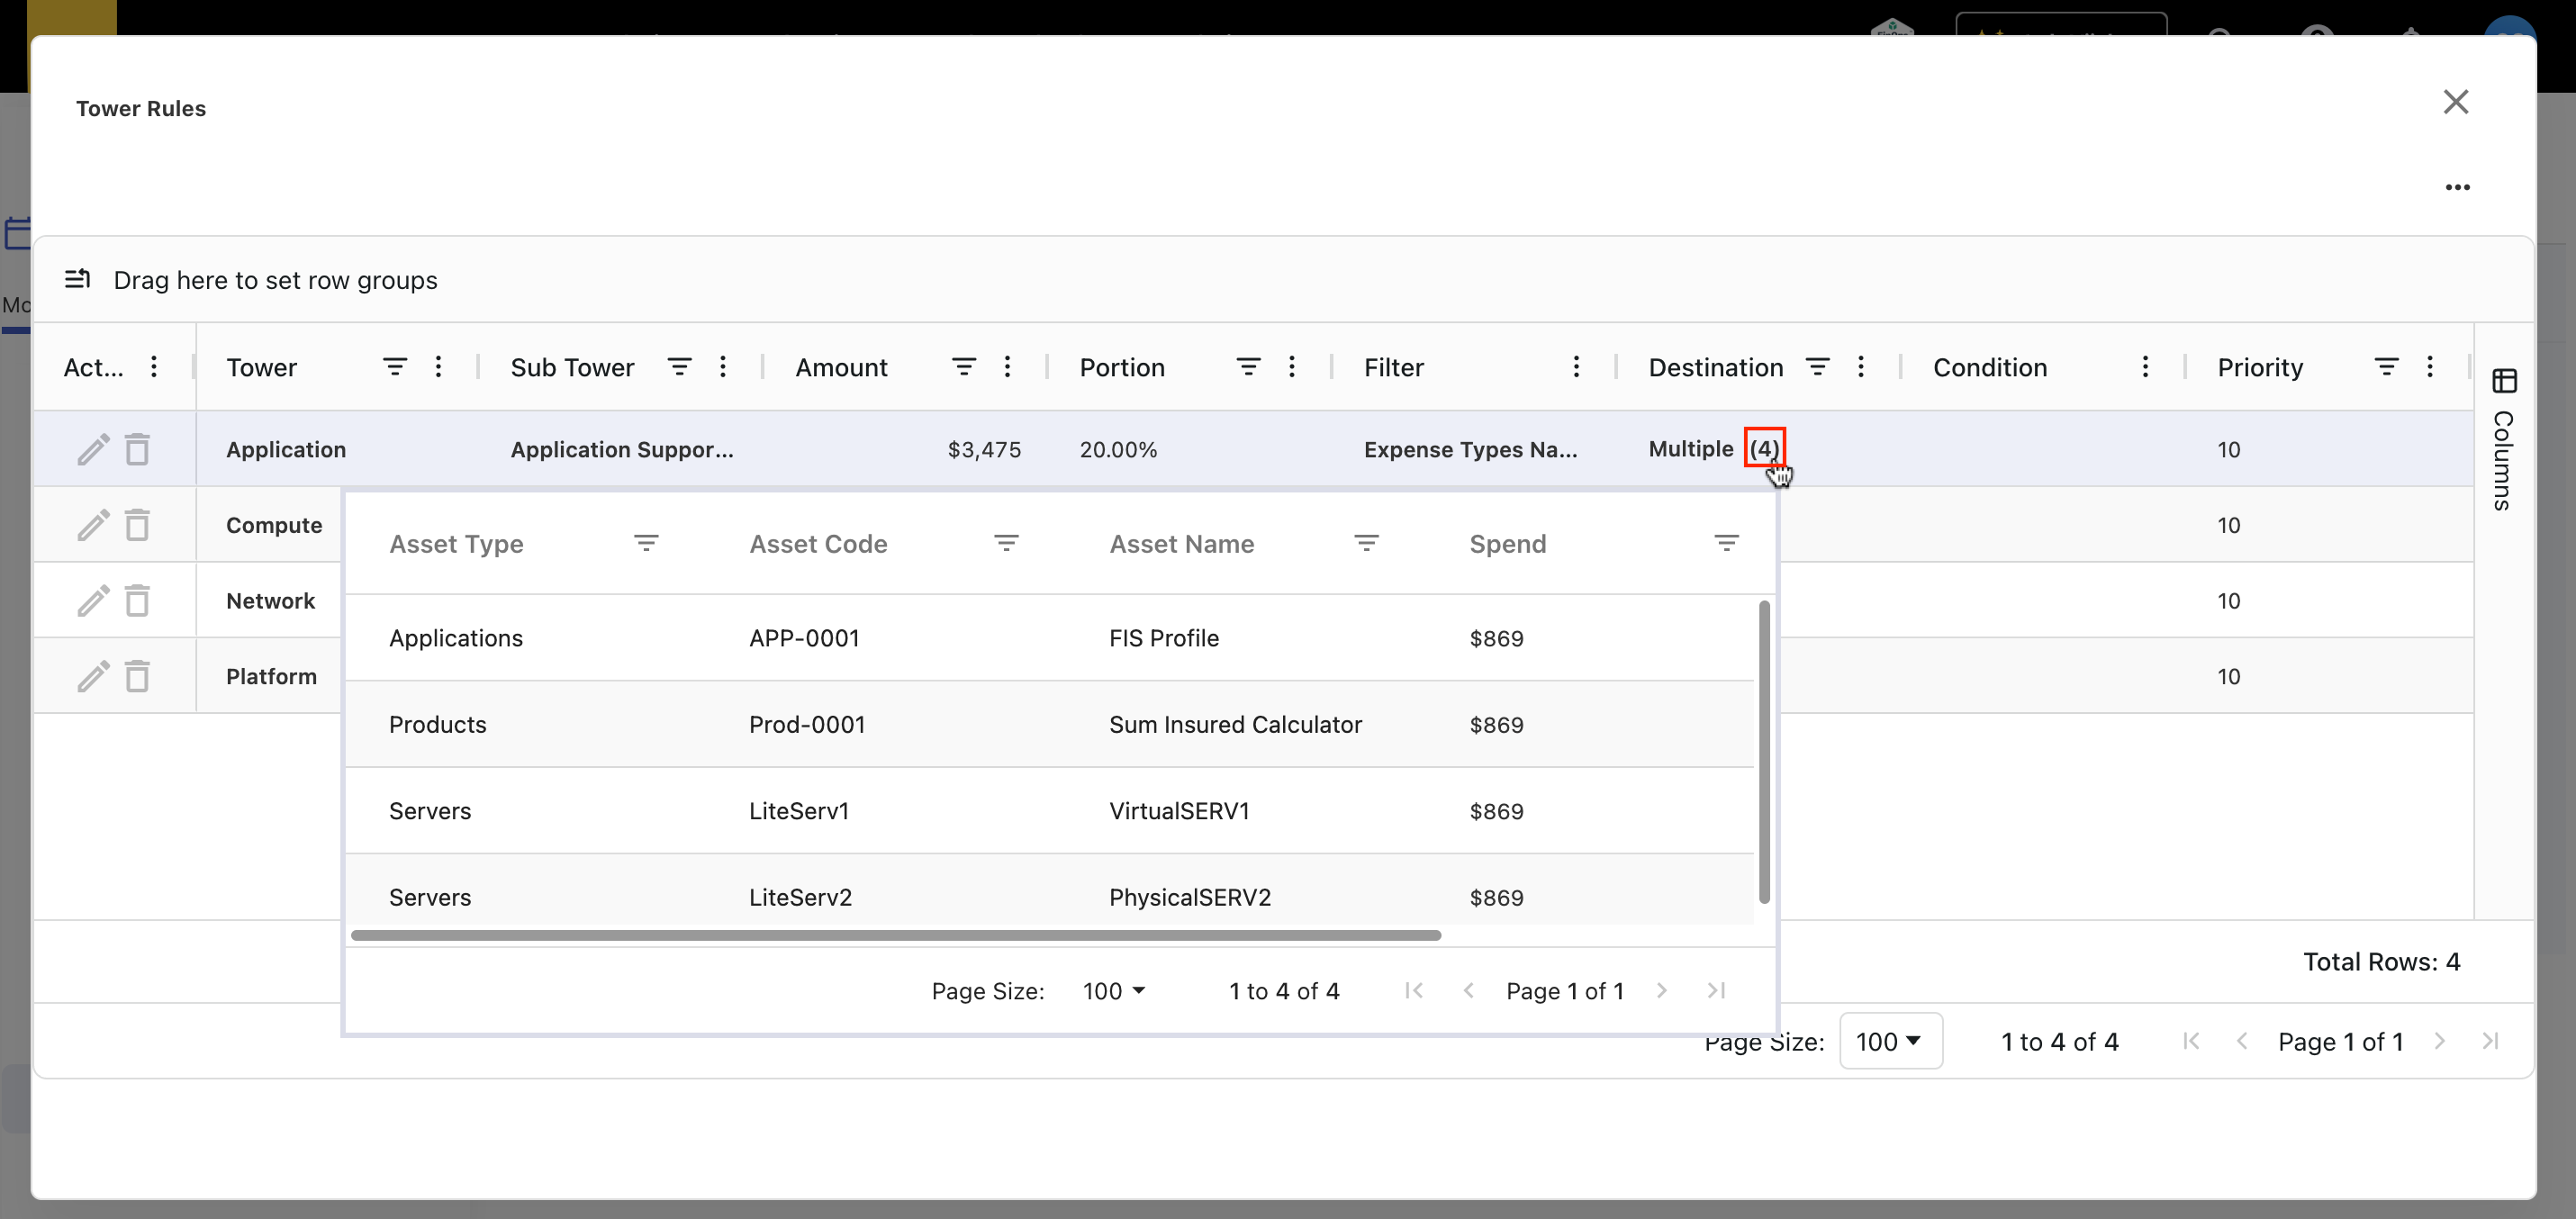
Visibility in Asset-Level Distribution on Tower Rules
We have enhanced the Destination column in tower rules to provide clearer and more detailed visibility into how spend is being allocated to assets. Previously, the Destination column only indicated whether the allocation was going to a single asset or multiple assets, without offering any further details.
With this update, the Destination column now displays the exact number of assets to which the spend is distributed. The count appears in brackets next to the asset name (or the word multiple). In addition, when hovering over the Destination column, a detailed popup now appears showing each asset included in the distribution along with its allocated amount and percentage.
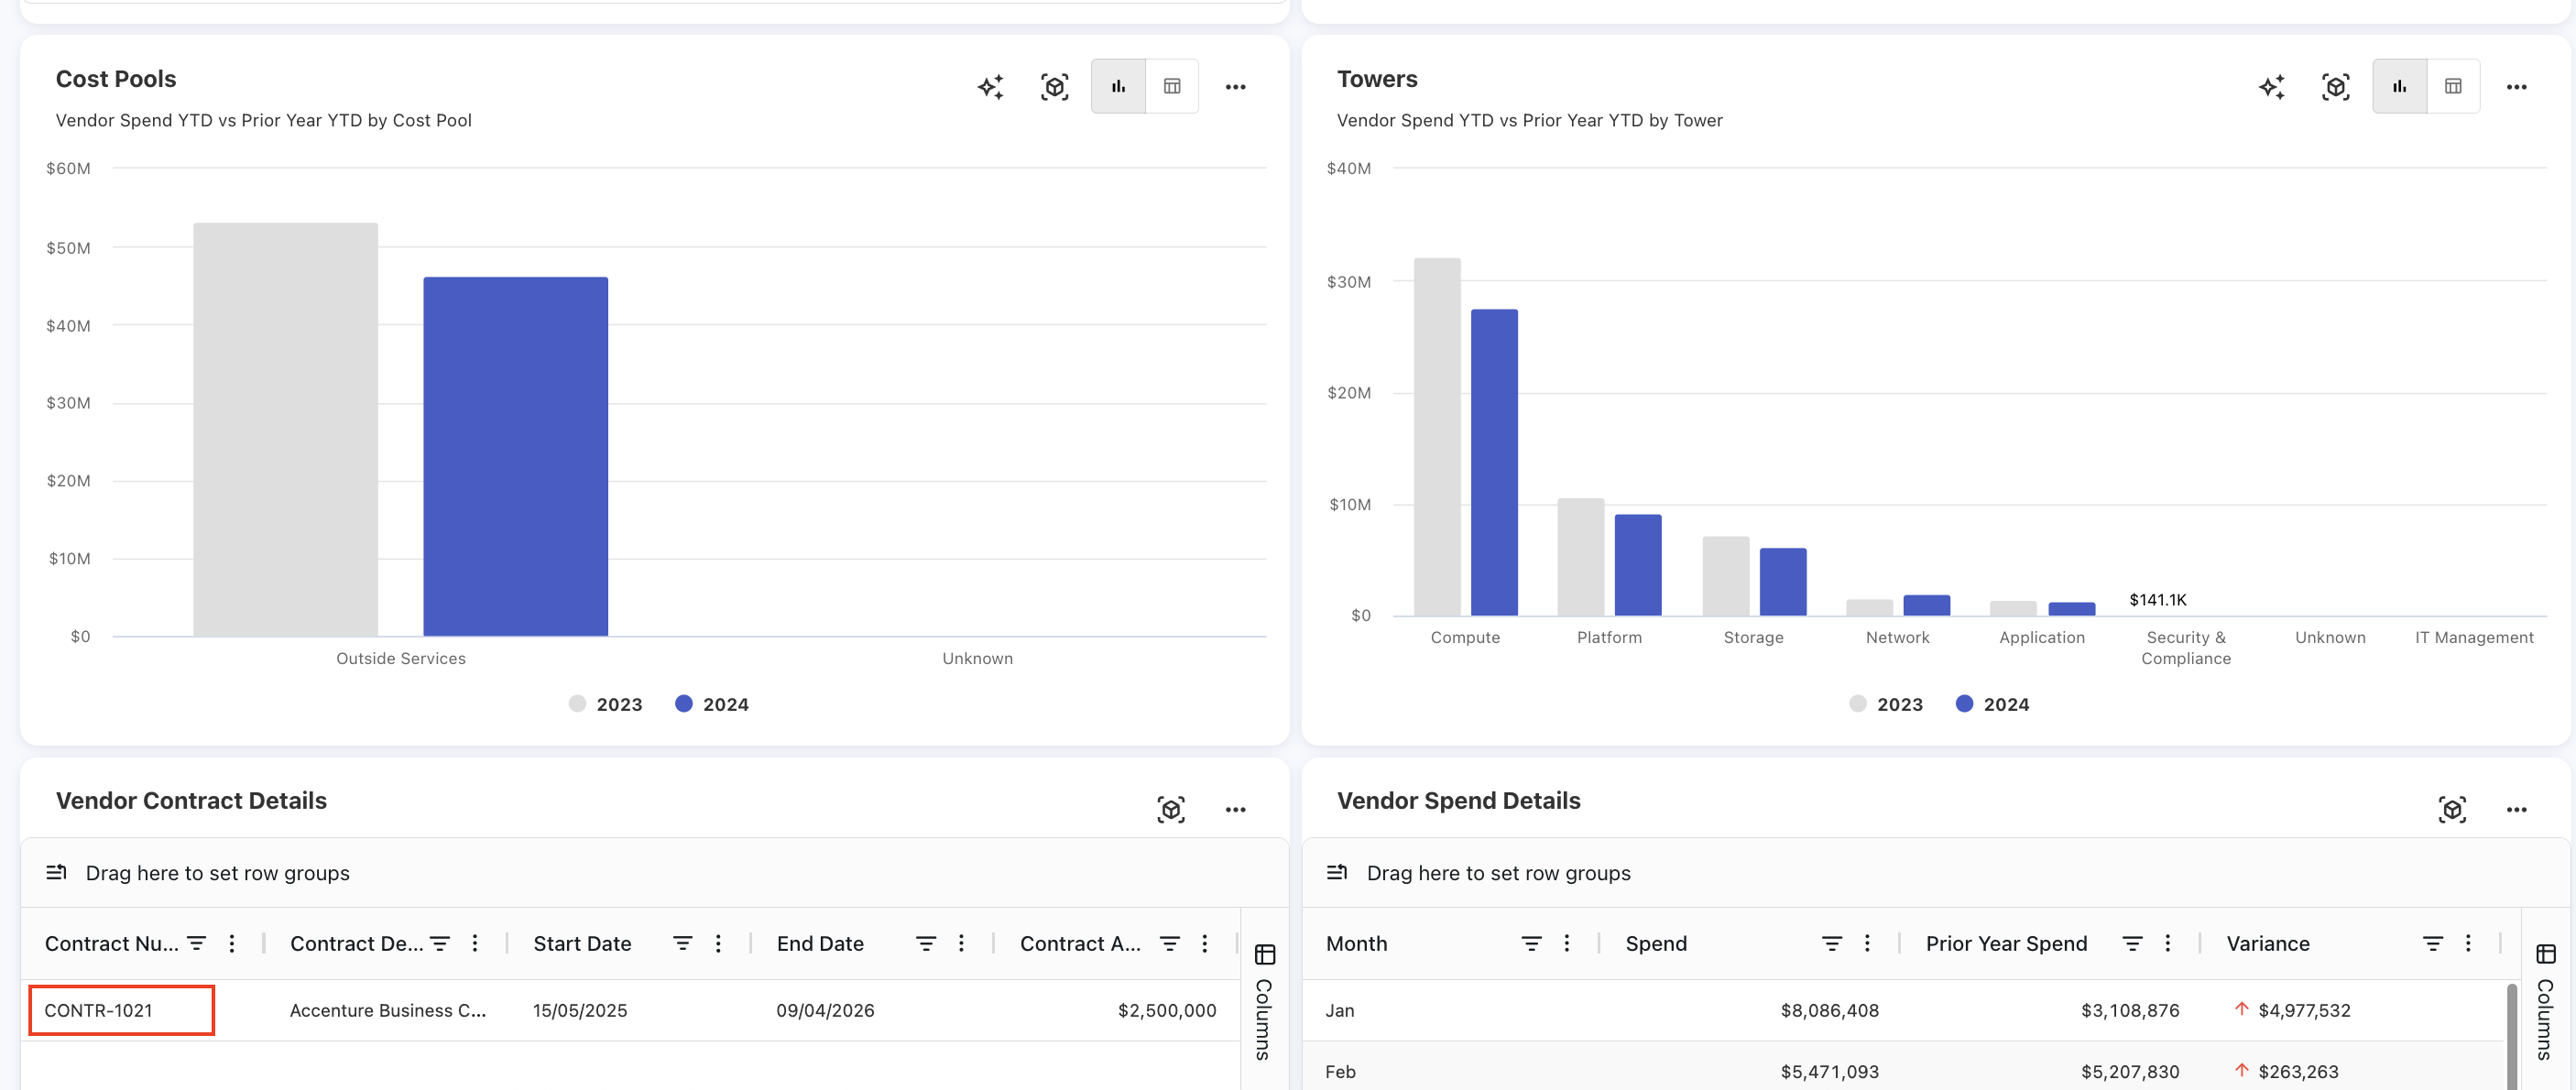
Link Between Vendor and Contract Dashboards
We have added a new drill-down capability in the Vendor Details > Vendor Contract Details table. When users click any contract row, the application now opens the Contract Details dashboard for that specific contract in a new browser tab.
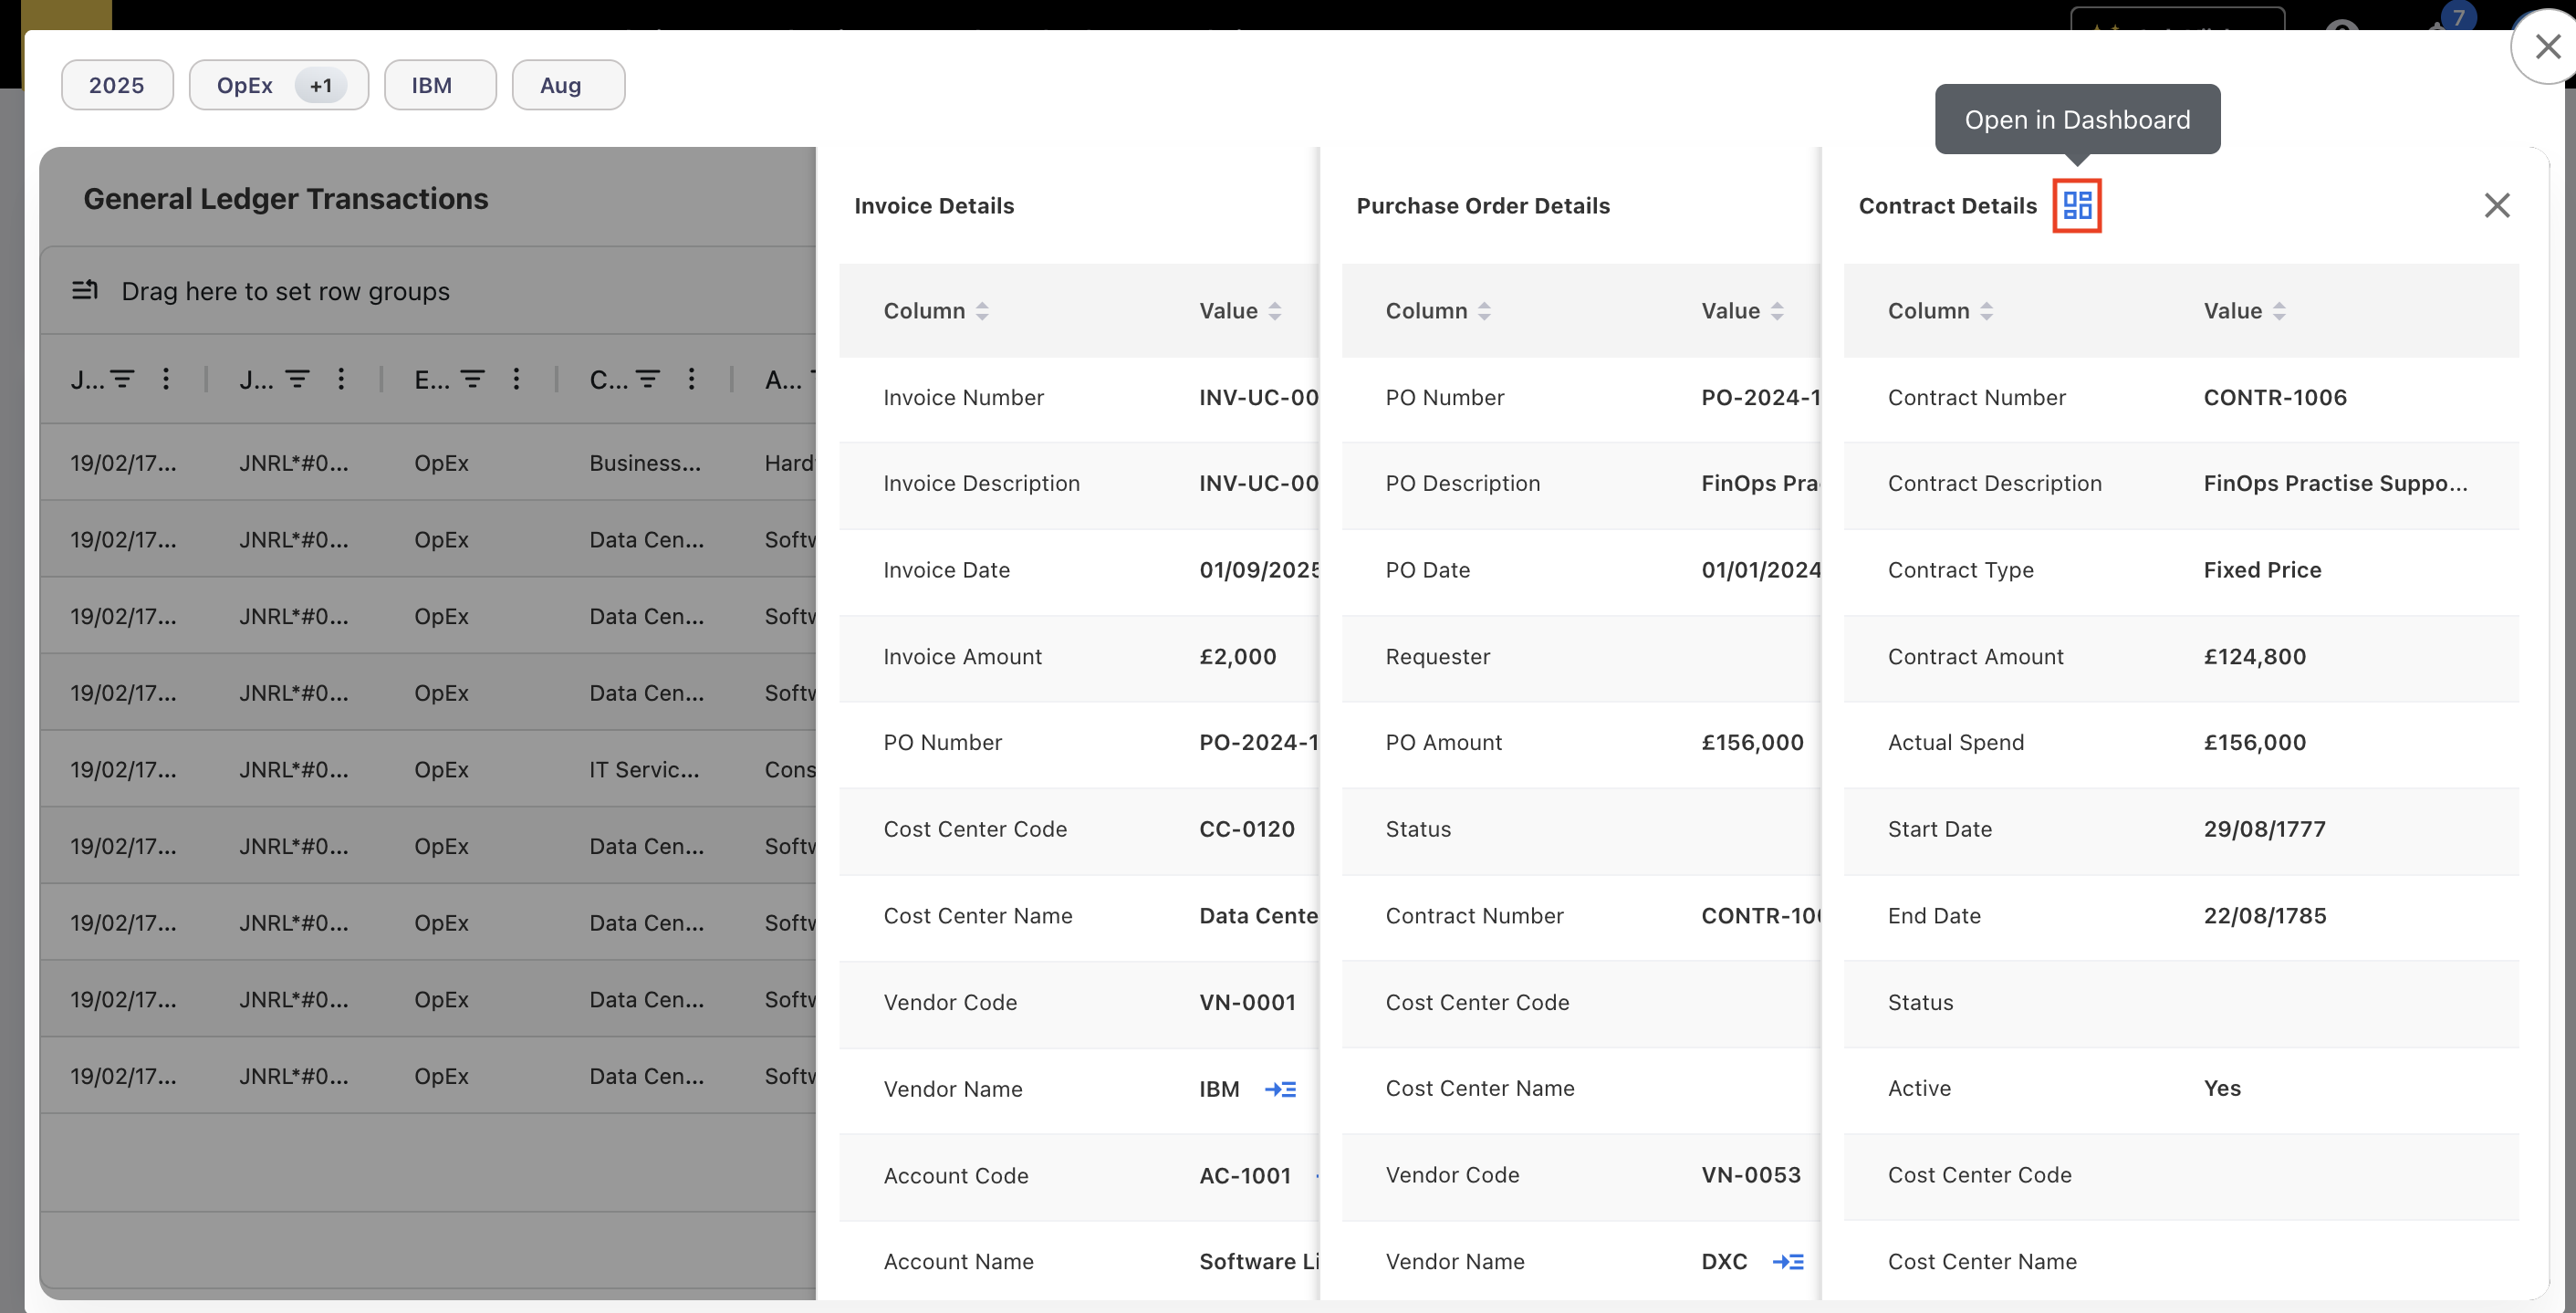
Additionally, a new Open in Dashboard action is introduced exclusively for the contracts within the GL popup’s expanded detail panel (accessible via View more…). This enhancement allows users to open the selected contract directly in the contract dashboard.
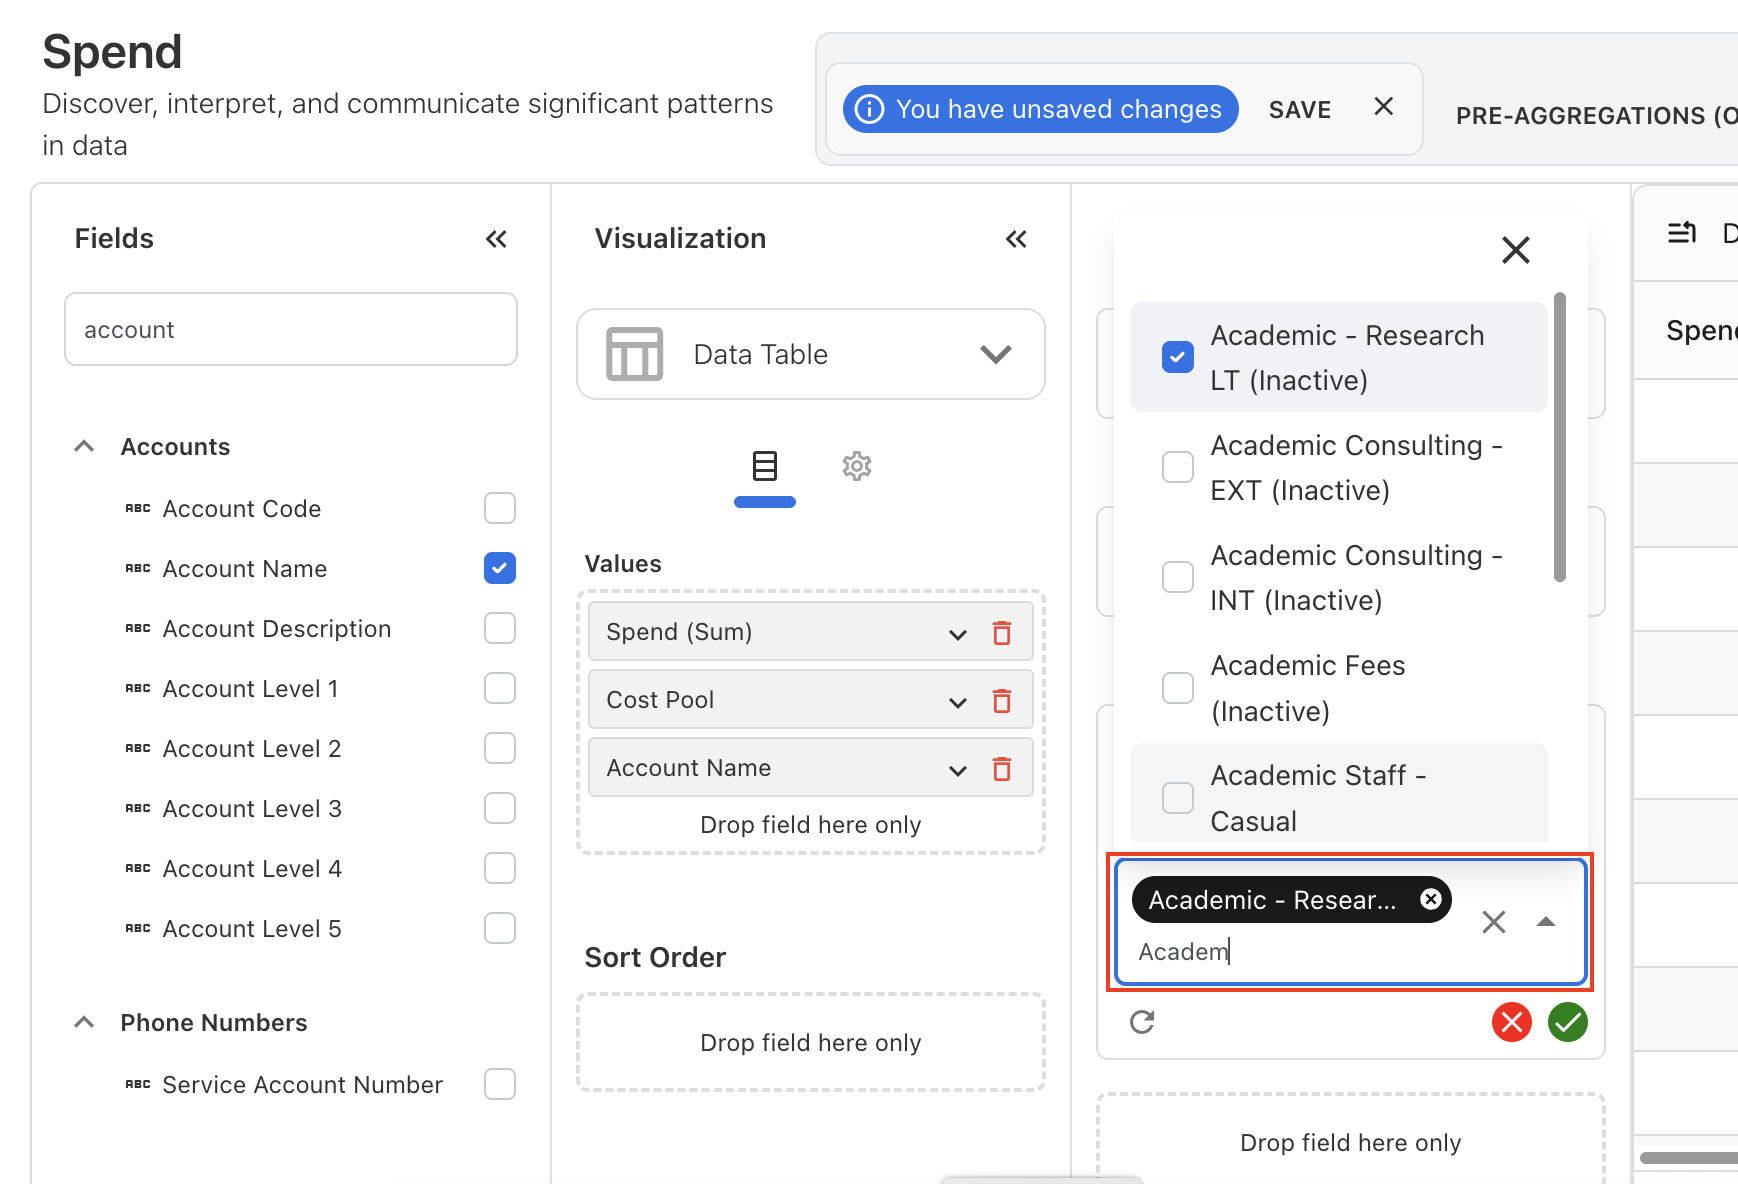
Retaining Search Value in Analytics Dropdown
The dropdown selection behavior is changed for all searchable dropdown fields in the Analytics. Previously, when users typed text into a dropdown search box and selected a value from the filtered results, the typed text was cleared immediately after selection. This issue caused inconvenience when users needed to refine or select multiple similar results. With this update, the typed text is now retained after making a selection. This fix is currently implemented across dropdown-based filters within the Analytics.
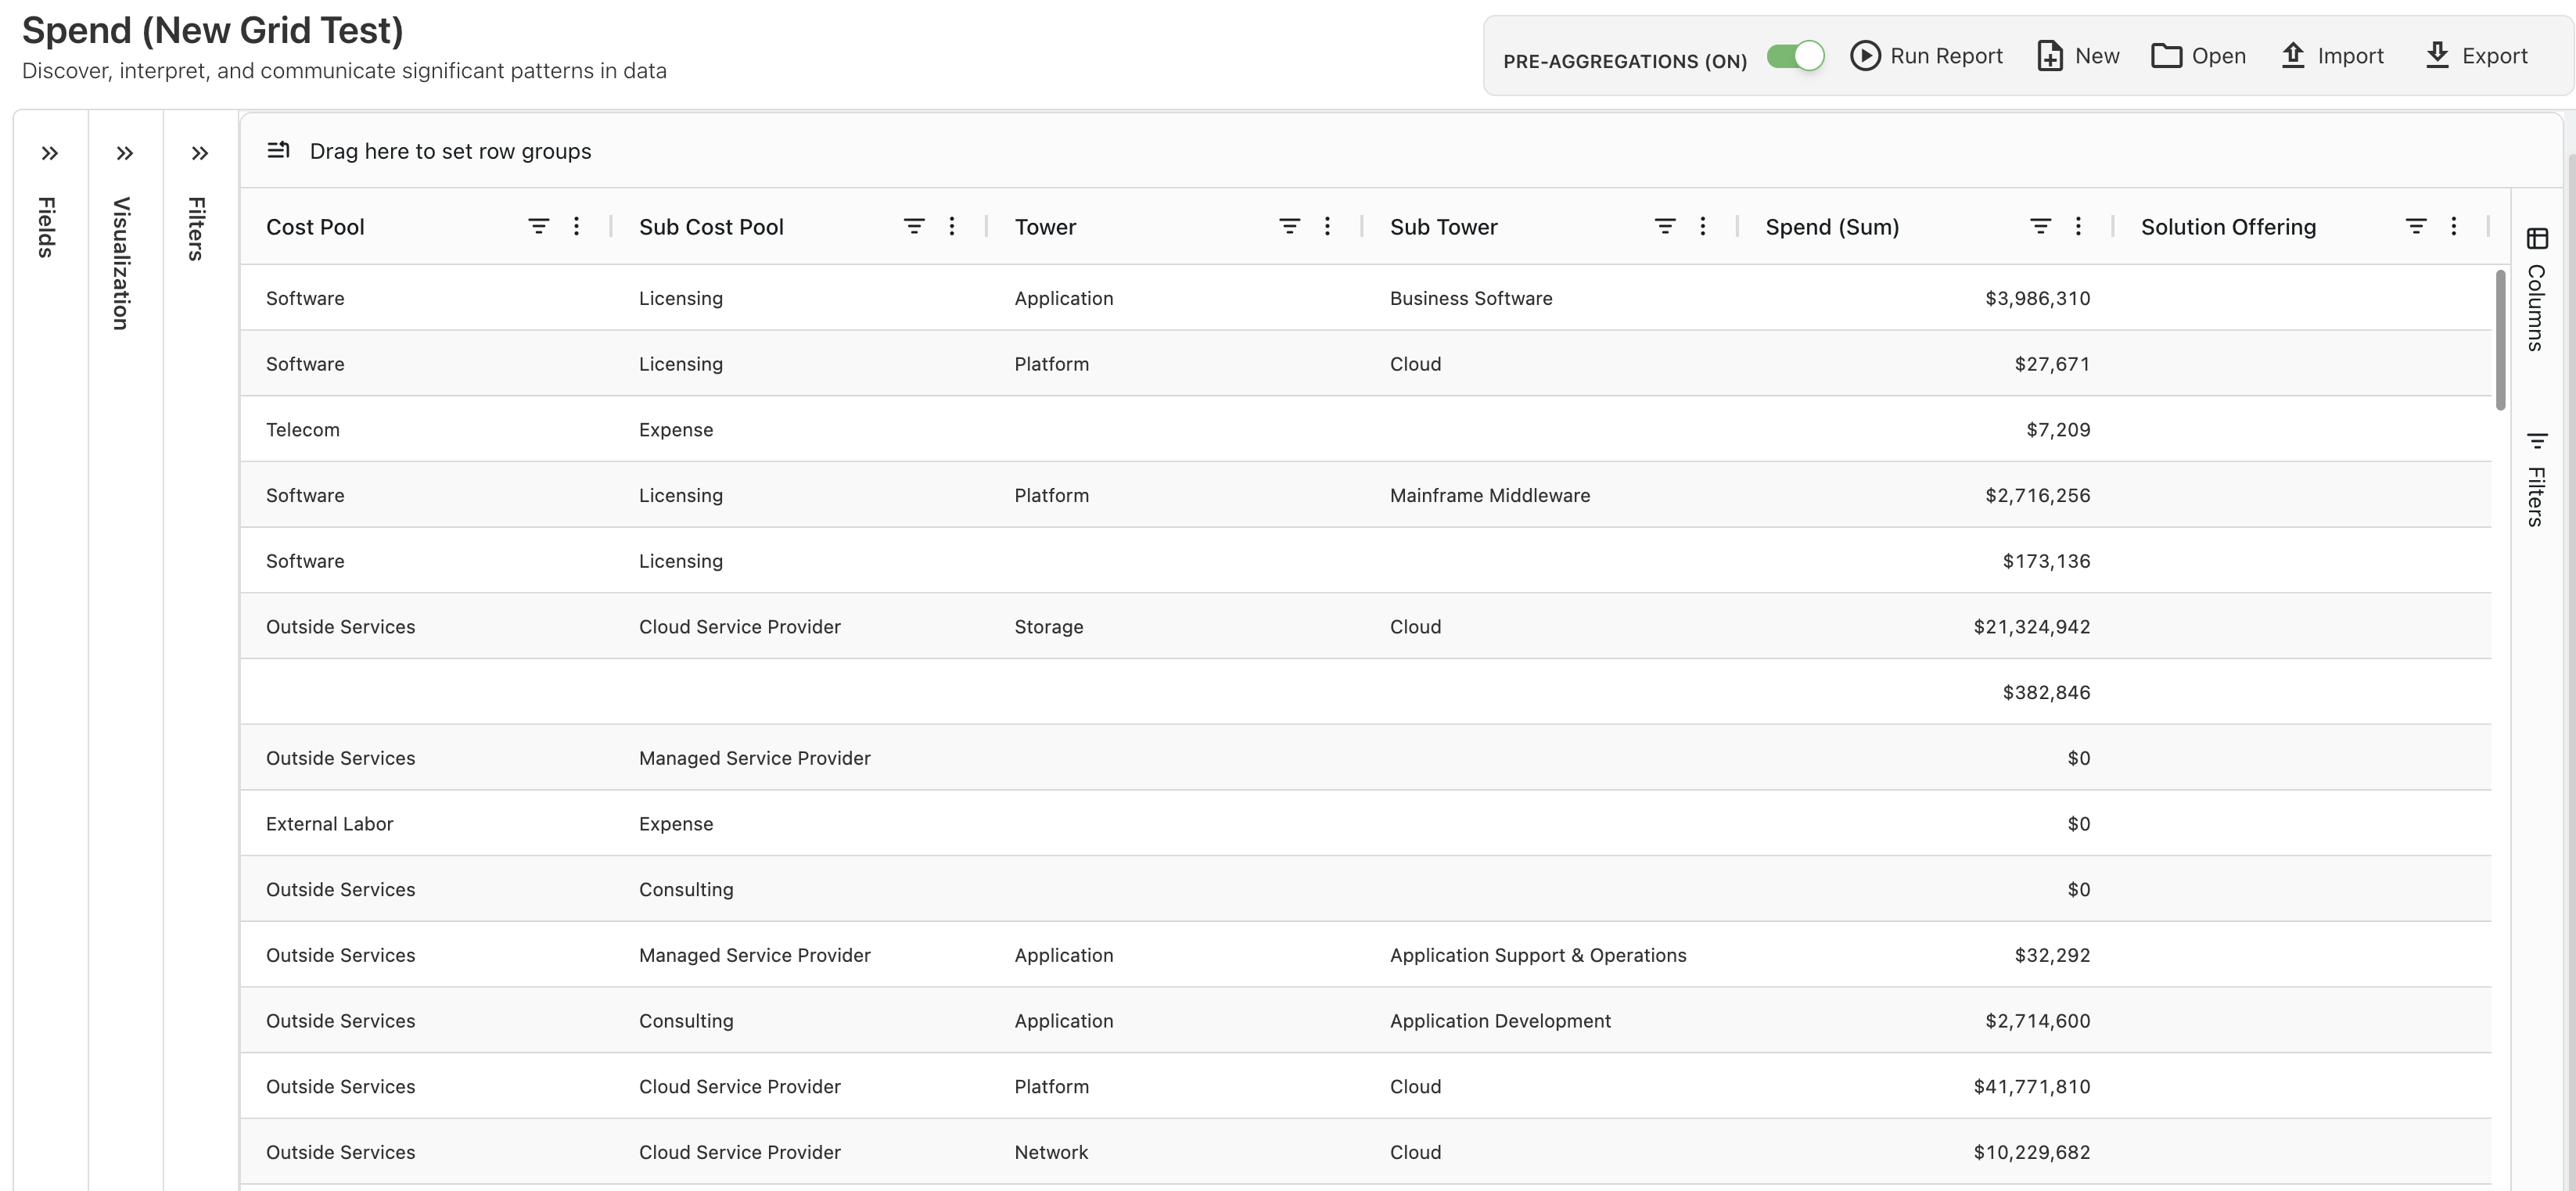
Auto-sizing in Grid Table
The new table component is enhanced to provide more intuitive interaction when customizing table size. Previously, when users added more columns to the table, the overall table width shrunk, making the layout difficult to navigate. This issue is handled by setting auto-sizing of column width by default, which ensures that the table adjusts to fit new columns without compressing the existing structure. This update improves readability and maintains a stable table structure.
Enhancements and bug fixes
New TBM v5.0.1 Framework Integration
The YäRKEN application now supports the TBM version 5.0.1, the latest standard from the TBM Council. The new version introduces richer classification across data, AI, security, and ESG.
What changed:
-
TBM v5.0.1 introduces enhanced visibility for cloud and AI investments through new Cloud Services cost pools and an AI Models sub-tower. It also expands the Solutions layer with AI-focused offerings.
-
Certain IT Towers have been renamed and reorganized to better represent modern technology delivery models.
-
The Business layer is renamed to Consumer layer for better identifying and describing the organizational units or roles that consume technology services.
Key changes in the applications
Cost Pools
-
Cloud Services is a new standalone cost pool created to elevate transparency of cloud investments for all public, private, and hybrid cloud services, including IaaS and PaaS.
-
Software cost pool is updated to Software & SaaS.
-
Staffing replaces Internal Labor. External Labor is no longer supported.
-
Managed Services and Other Operating are introduced across multiple pools.
-
Several new sub cost pools are added.
Towers
-
New towers such as Smart Devices and Data are introduced.
-
Platform and Output towers are retired.
-
New sub towers related to AI and IoT are added.
-
Security & Compliance is split into Security and Risk & Compliance.
Solutions
-
Introduced a new solution type for Artificial Intelligence.
-
Retired the Platform solution type.
-
Added a new Solution Category for Sustainability & ESG under Shared & Corporate Services.
Business Units
-
Business Units layer is renamed to Consumers layer.
Dashboard and reporting
-
Dashboards and reports have been updated to reflect the new TBM version labels and groupings.
-
The cost allocation model and reference lists in the system are updated to reflect the new TBM 5.0.1.
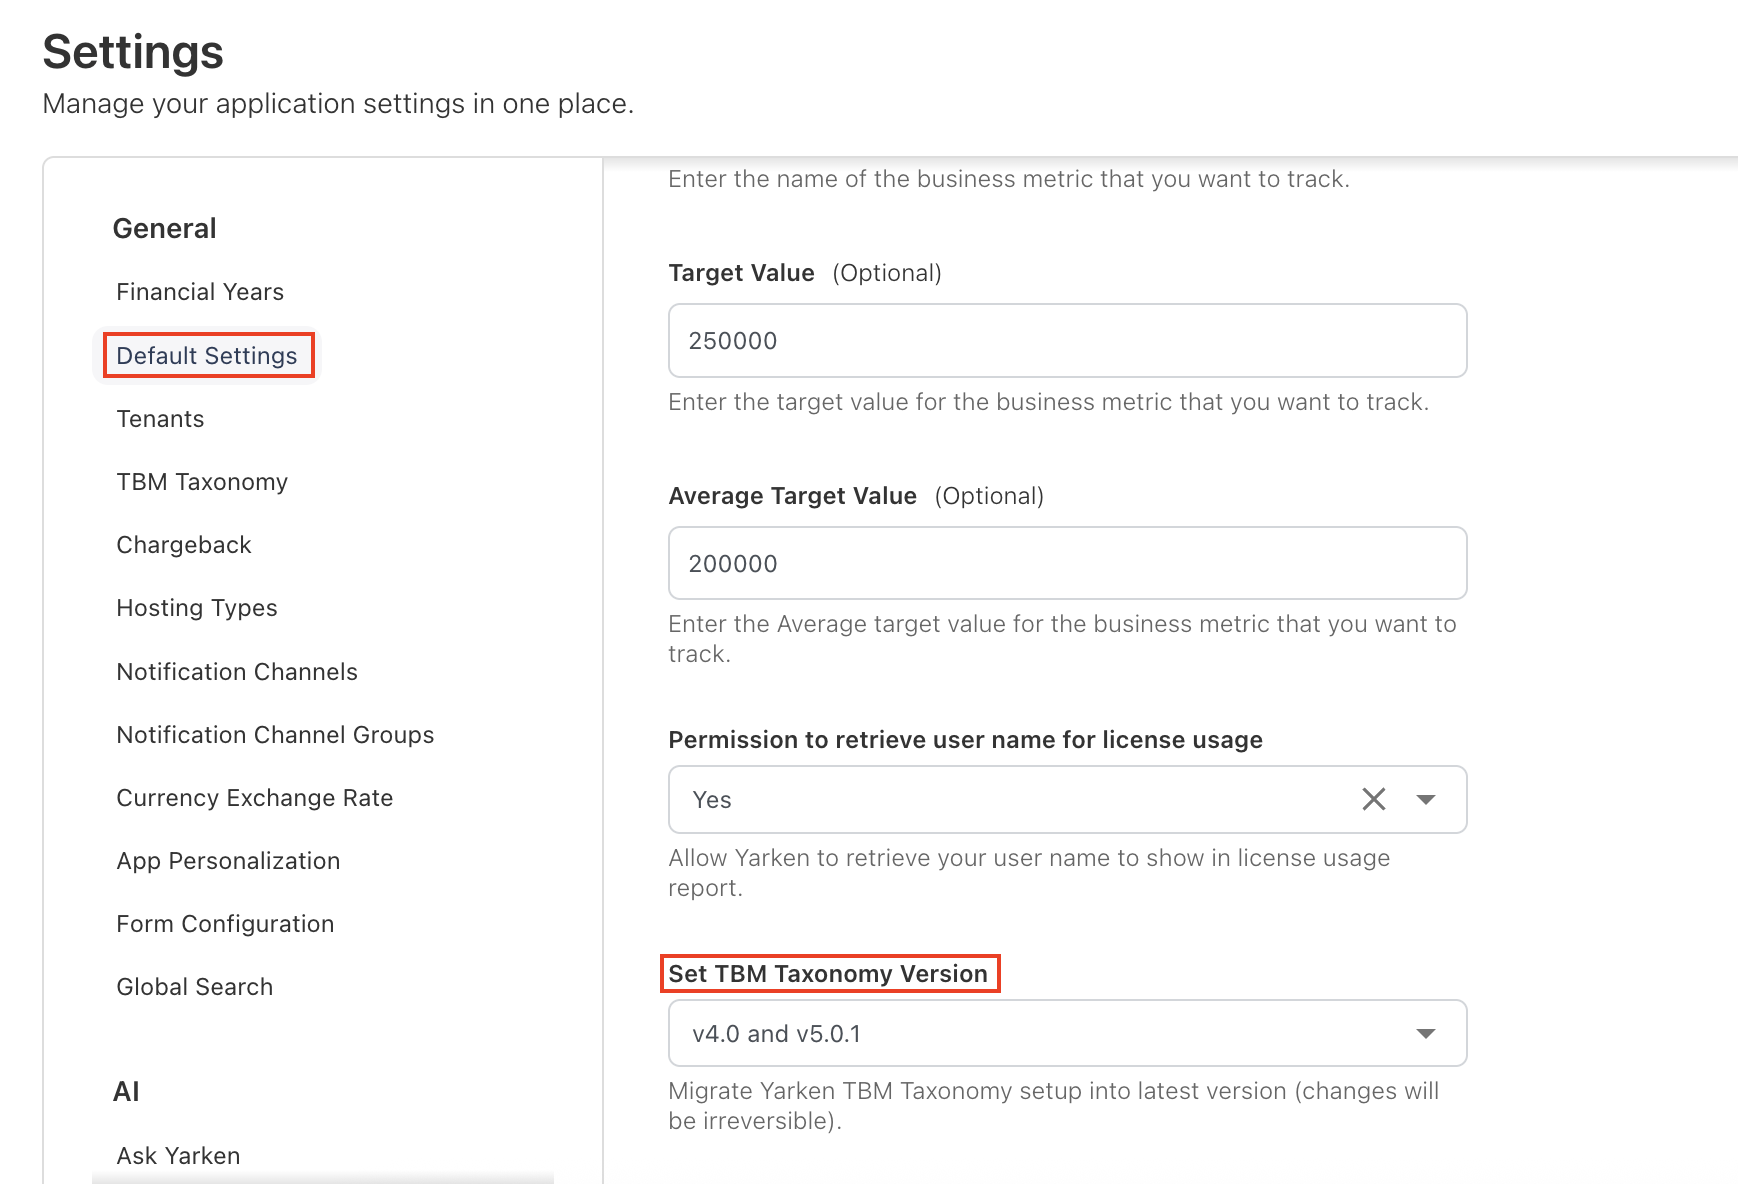
How to use:
We’ve introduced a new configuration option — Set TBM Taxonomy Version — that allows you to choose the desired TBM version to apply within the YäRKEN application. Reports and dashboards dynamically adapt based on the version selected.
You can now select from:
-
TBM v4.0
-
TBM v5.0.1
-
TBM v4.0 and TBM v5.0.1
|
Version |
Description |
TBM Version Behaviour |
|---|---|---|
|
TBM v4.0 |
Continue using the legacy TBM 4.0 framework for backward compatibility. |
When you select TBM v4.0, you may still see TBM v5.0.1 elements in the Spend Model (Designer) and Analytics, as long as the spend exists in v5.0.1. However, rules, and mappings logic remain restricted to TBM v4.0 only. |
|
TBM v5.0.1 |
Leverage the latest TBM taxonomy, updated cost pool, sub cost pools, towers, sub towers structure. |
When you select TBM v5.0.1, you may still see TBM v4.0 elements in the Spend Model (Designer) and Analytics, as long as the spend exists in TBM v4.0. These elements available for reference and comparison. However, rules and mappings logic follow the TBM v5.0.1 taxonomy only. |
|
TBM v4.0 and TBM v5.0.1 |
Use both TBM v4.0 and v5.0.1 concurrently, enabling hybrid environments during transition or validation phases. |
Both TBM v4.0 and v5.0.1 taxonomy elements are available and included in mappings and rules. Spend allocation, modeling logic, and taxonomy-based rules evaluate against both versions simultaneously. |
General note
-
Business units to Consumers: The renaming of Business Units to Consumers applies across all TBM versions (version independent).
New Grid in Dashboard and Analytics
The new grid component has been extended to the all standard dashboards, reports, custom dashboards and analytics.
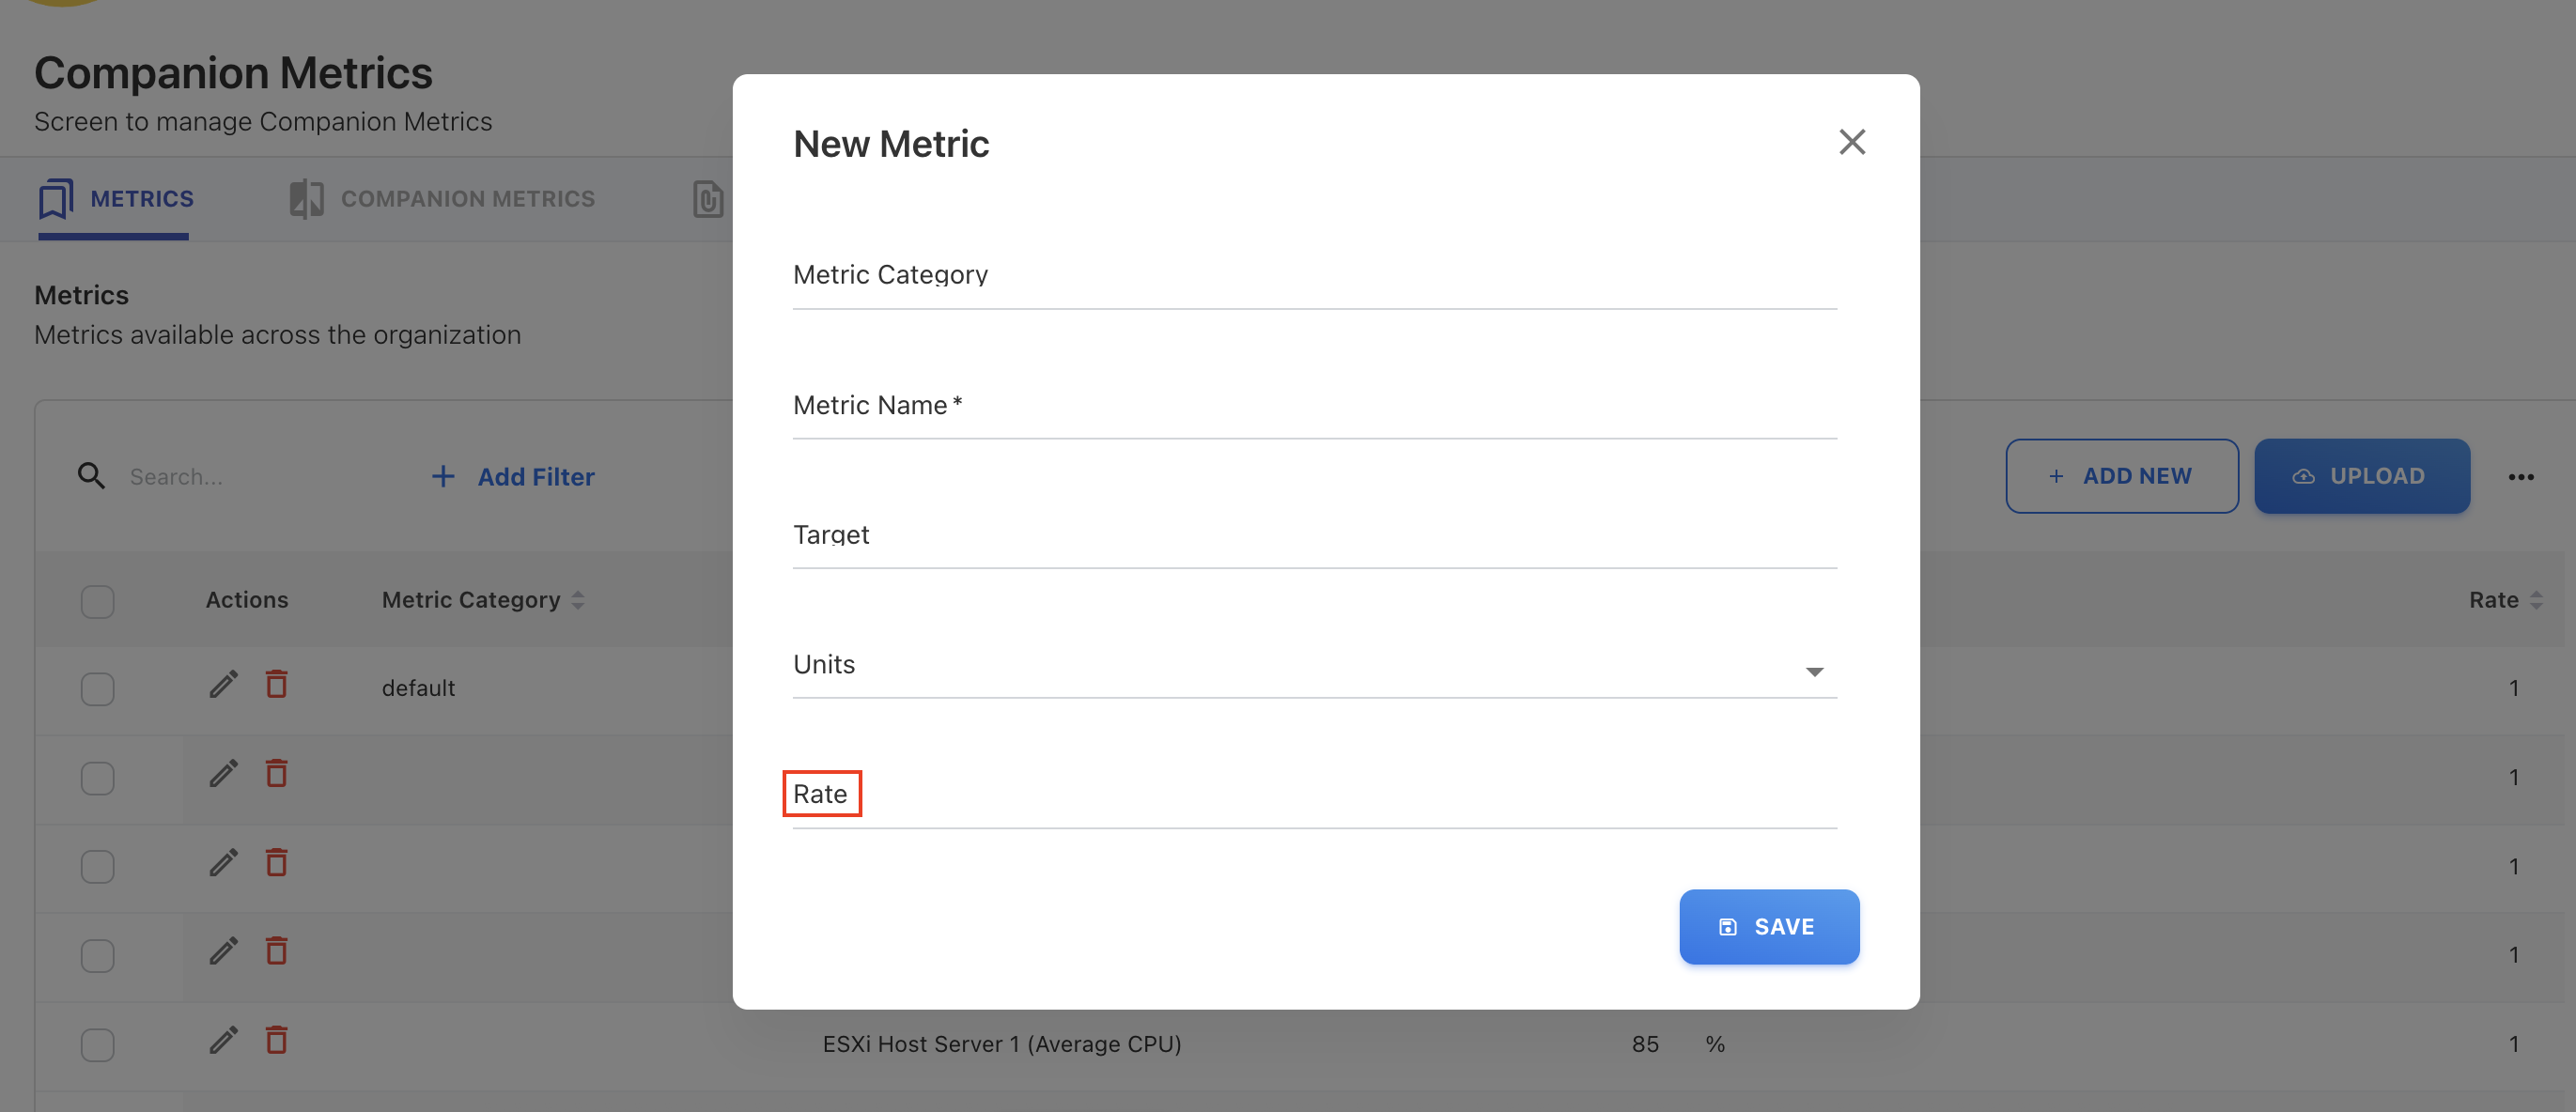
Companion Metrics - A New Rate Column
A new attribute called Rate has been introduced in the Companion Metrics to support accurate amount calculations. The Rate represents the per unit metric rate. When the rate is provided, the Total Amount is automatically calculated by multiplying the Rate with the Metric Value. If no rate is entered, the application will default the rate to 1.
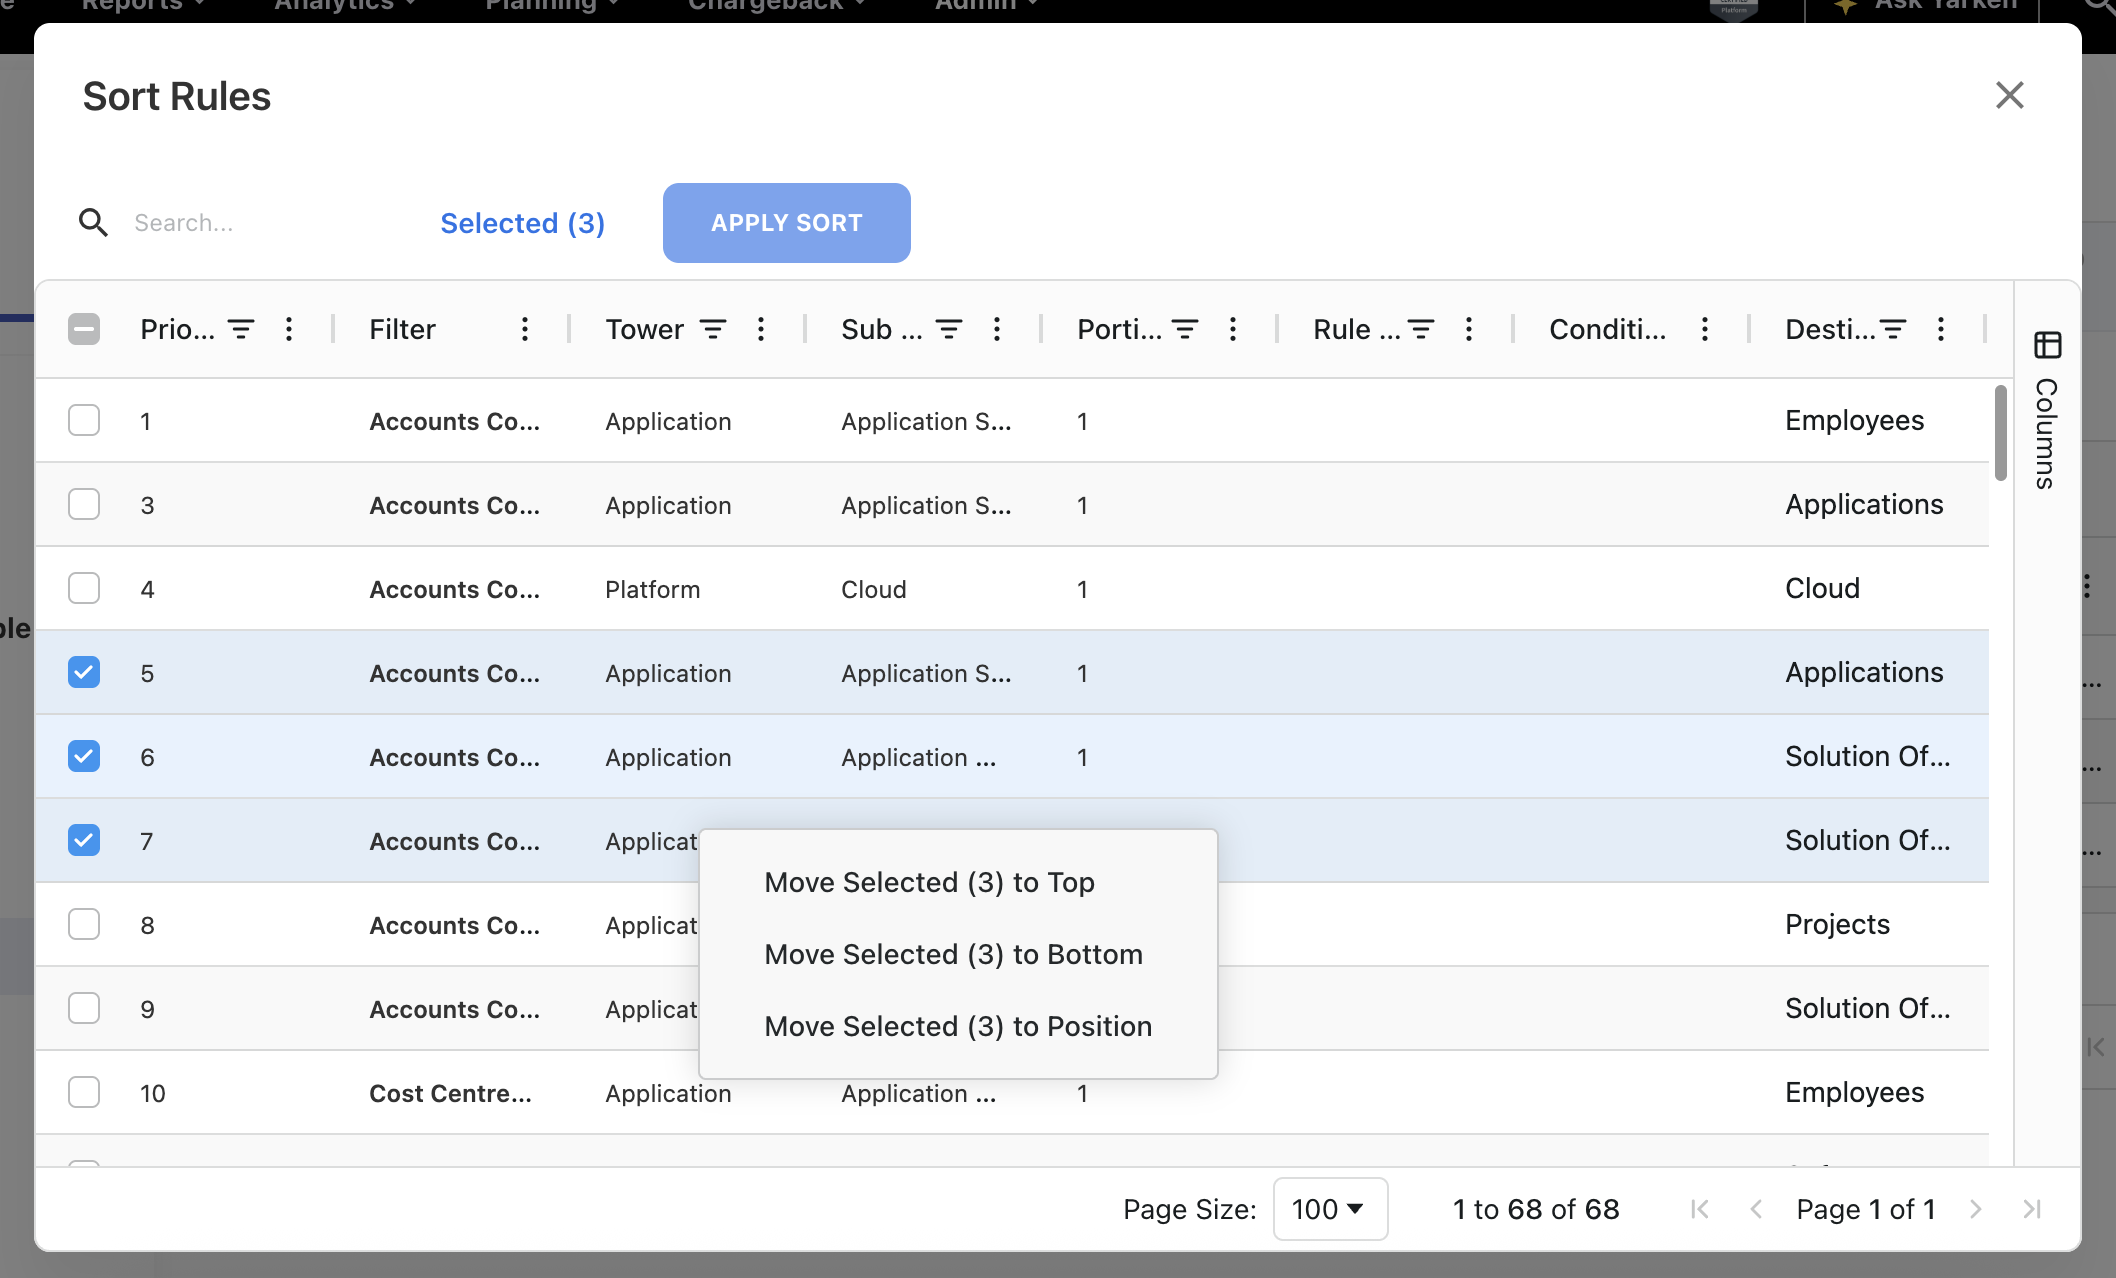
Tower Rule Sorting Enhancements
The tower rule sorting experience has been significantly improved to handle scenarios where a large number of rules are configured. Previously, the sorting of multiple rules using drag and drop was slow. This often resulted the rules in the wrong position. To make sorting faster, accurate, and easier to manage, the following enhancements have been introduced:
-
Added new grid for smooth sorting. The sorting now uses an new grid for faster loading.
-
Added a new sorting option, Move to Position. Instead of relying only on drag-and-drop, users can now use the Move to Position option. User needs to specify a priority number, and choose whether to place the rule before or after another rule.
-
Enabled multi-select rows with checkboxes. Users can now sort or reposition multiple selected rules at once.
These enhancements ensures that the tower rule is more reliable and scalable when working with large rule sets without performance issue.
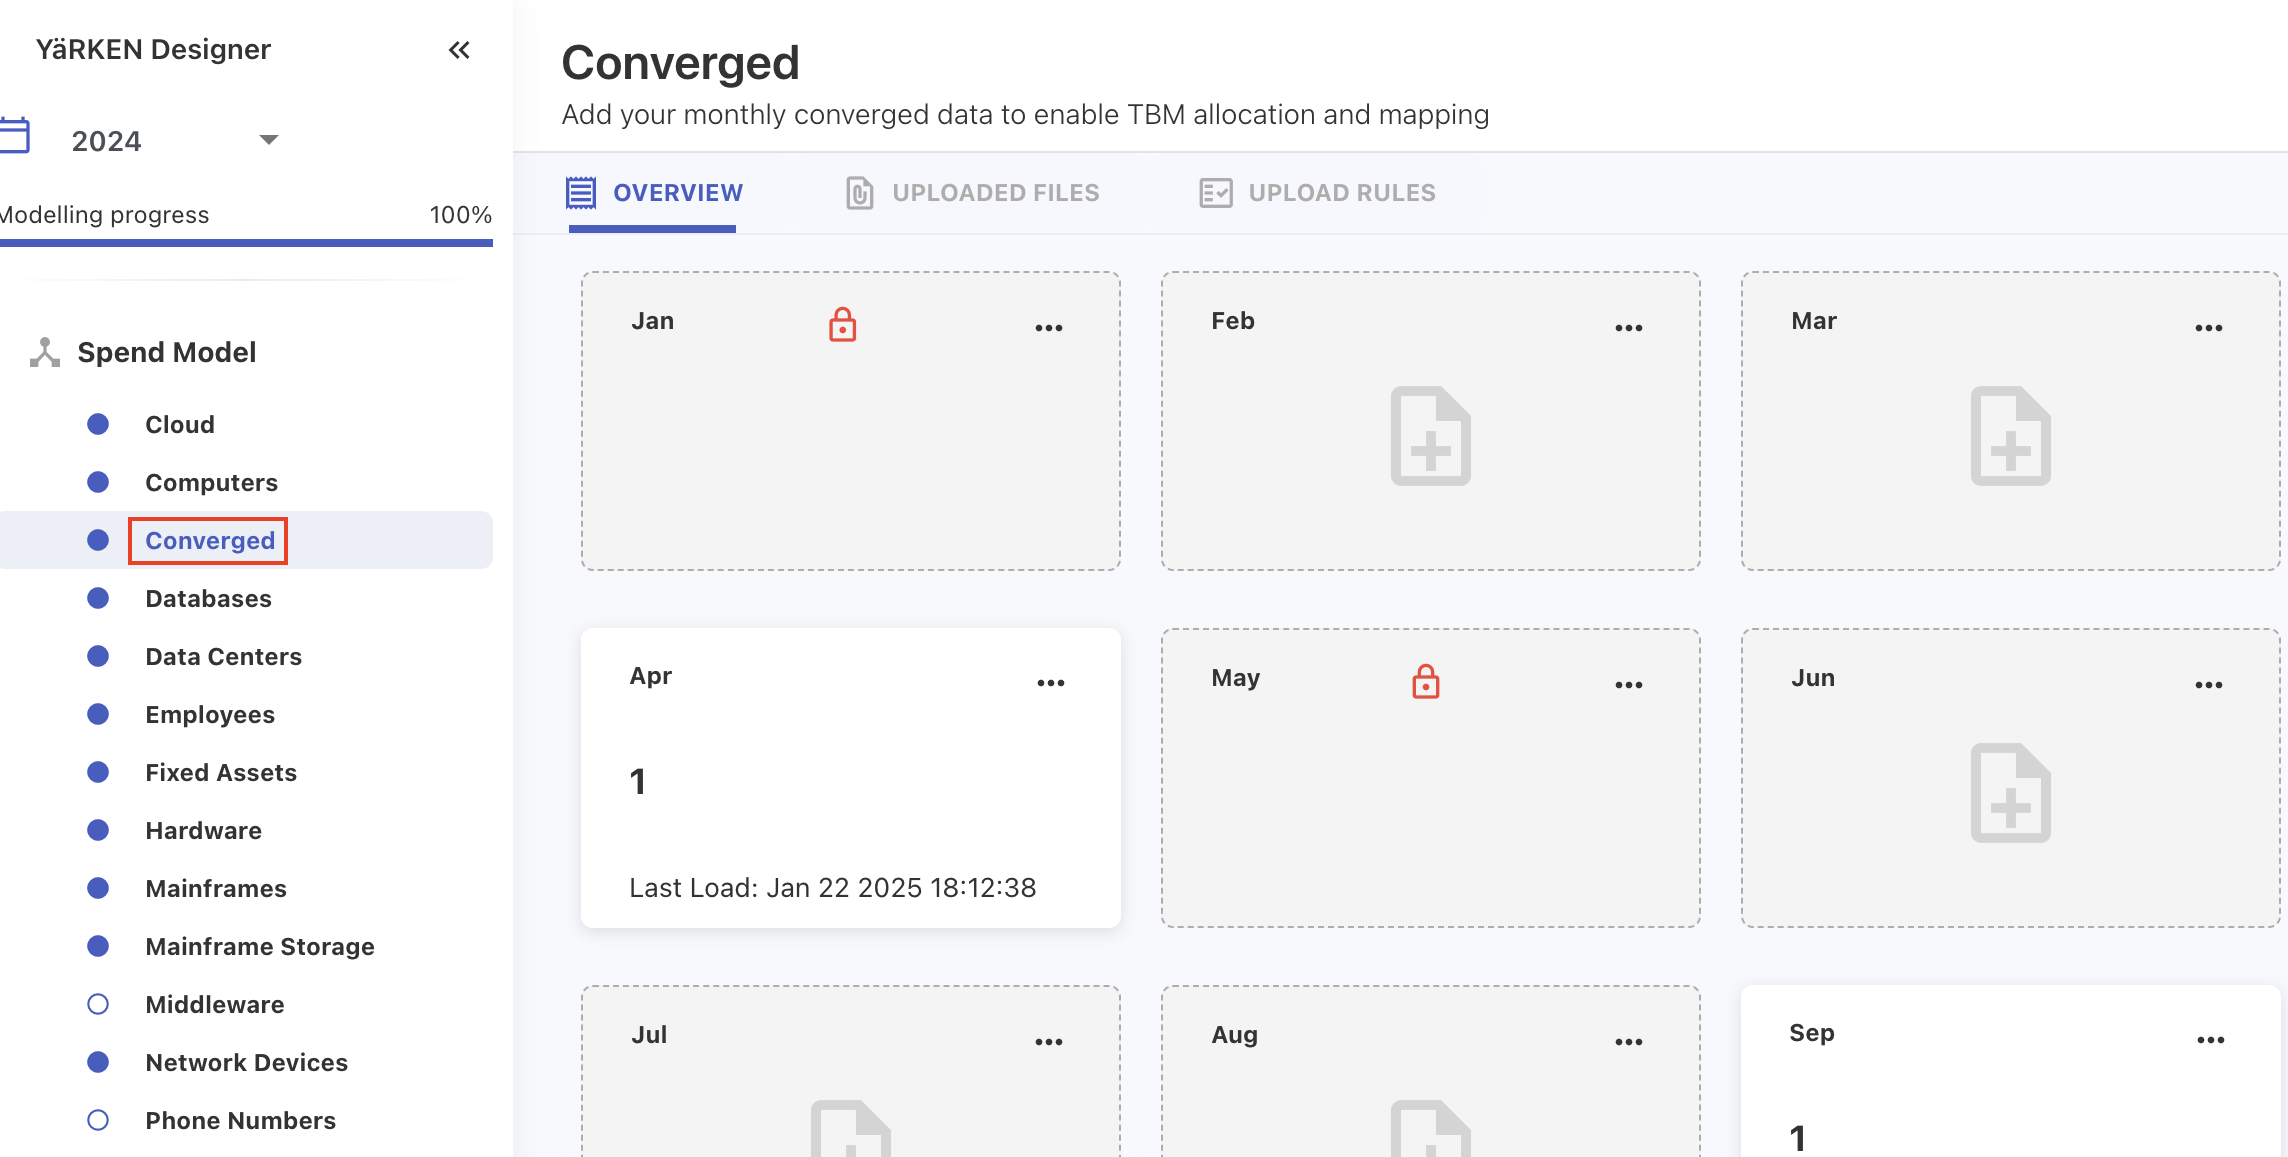
Converged Assets: A New Asset Type
We have introduced a new asset type called Converged that helps the user in a scenario where multiple infrastructure components, for example compute, storage, and network, are managed and delivered as a single package. This makes it easier for the organizations to categorize and report spend related to the converged or integrated platforms. The converged asset can now be created or loaded and included in the reporting and allocation rules.
Allocation (100%) Percentage Calculation Logic
The allocation percentage calculation logic is now improved to show 100% distribution. In some cases, the allocation percentage appeared as 99% instead of 100%, even though the difference between the allocated and total amounts was negligible (at the sub-decimal level). We have fixed this by implementing a tolerance rule: If the absolute difference between the allocated and total amount is less than or equal to 1 dollar, the system will treat it as 100% allocation.
Enhancements and bug fixes
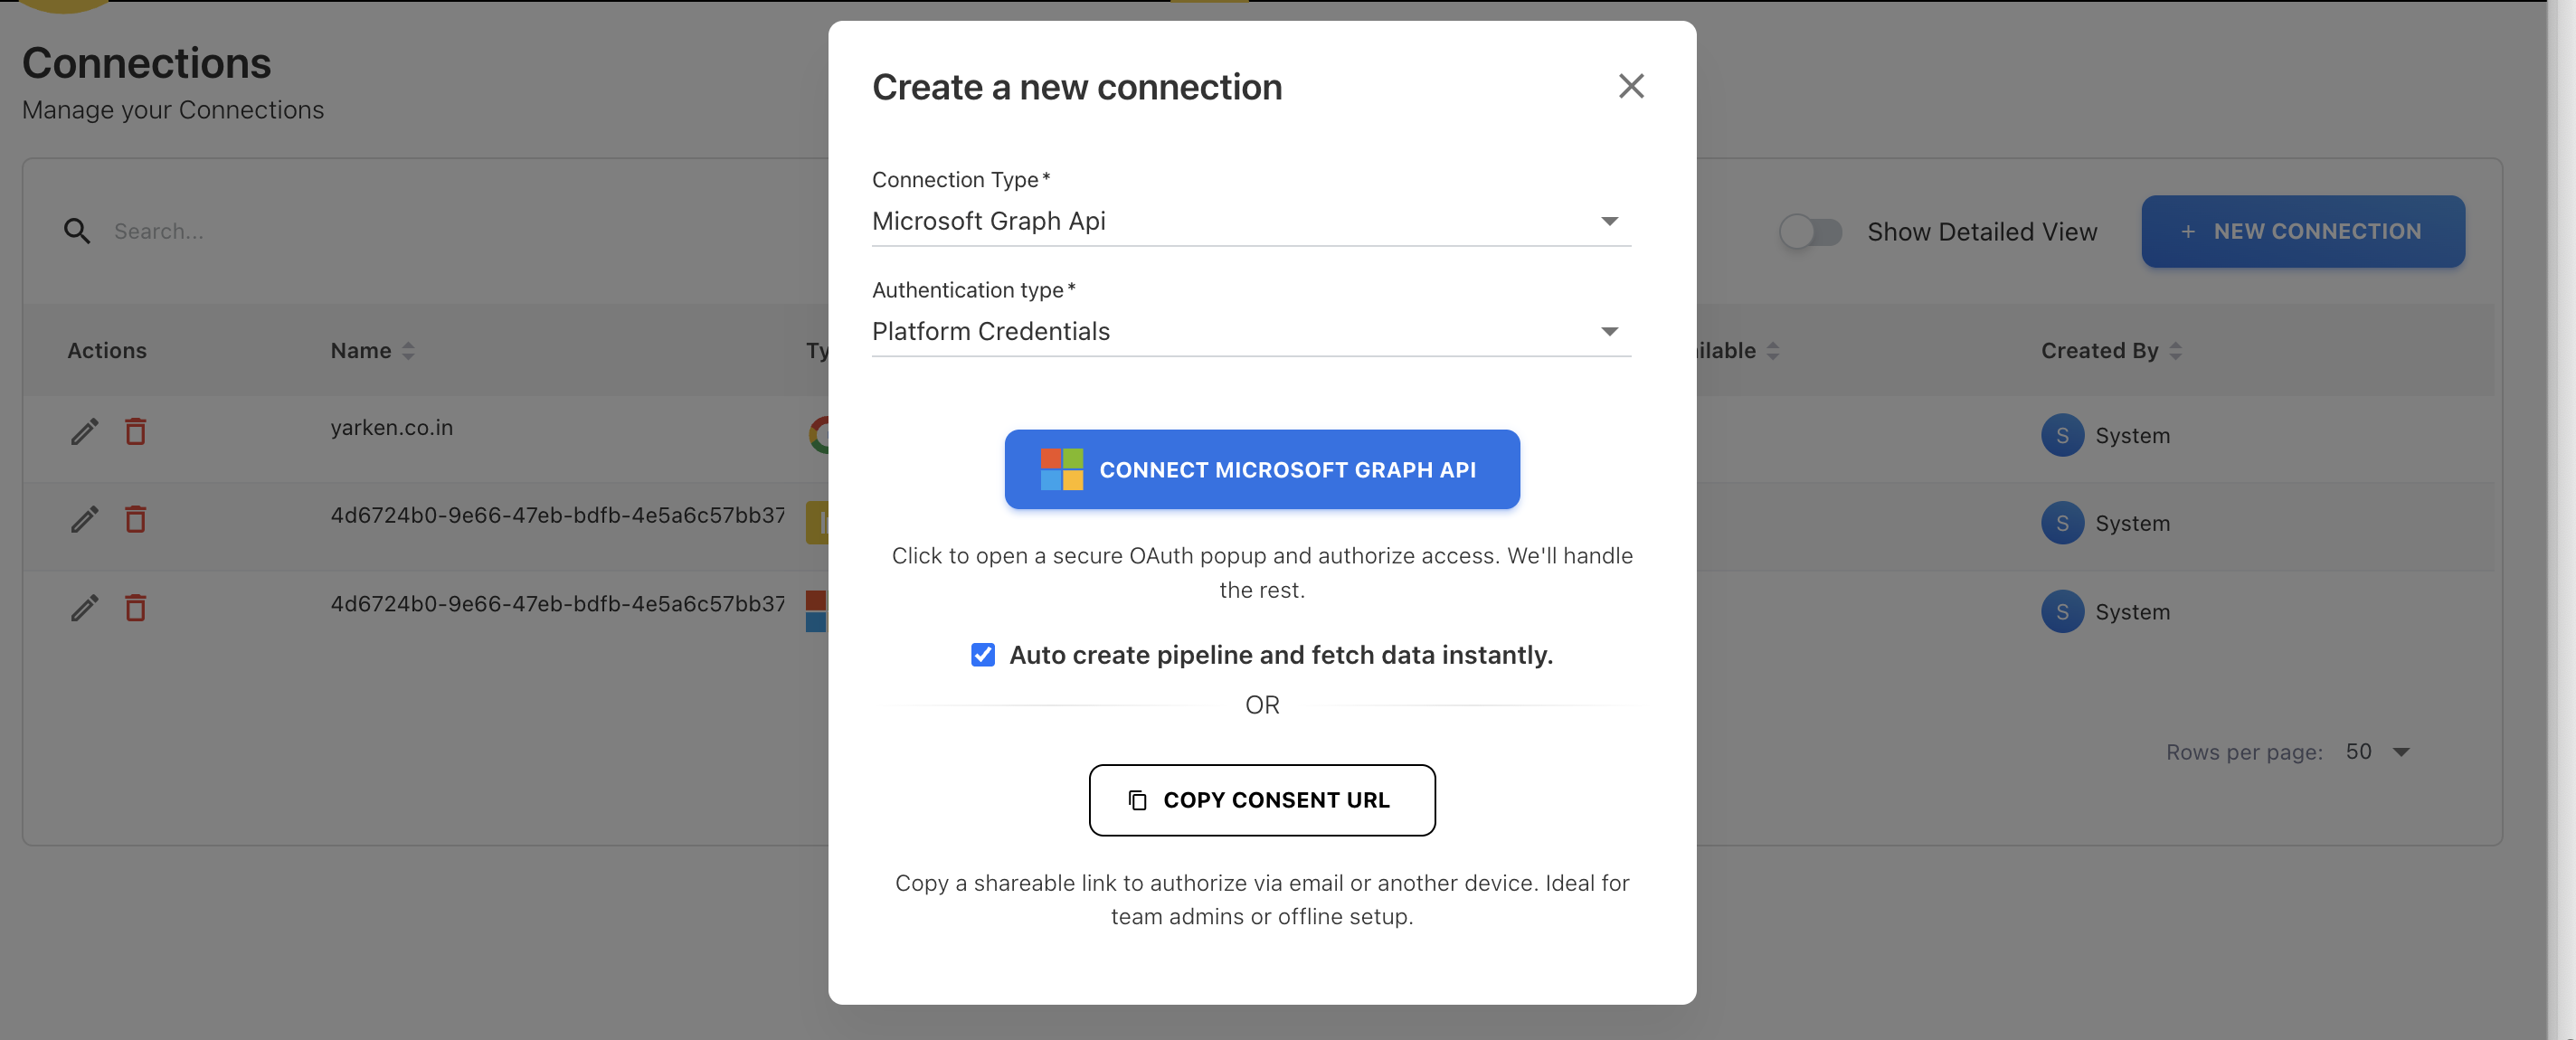
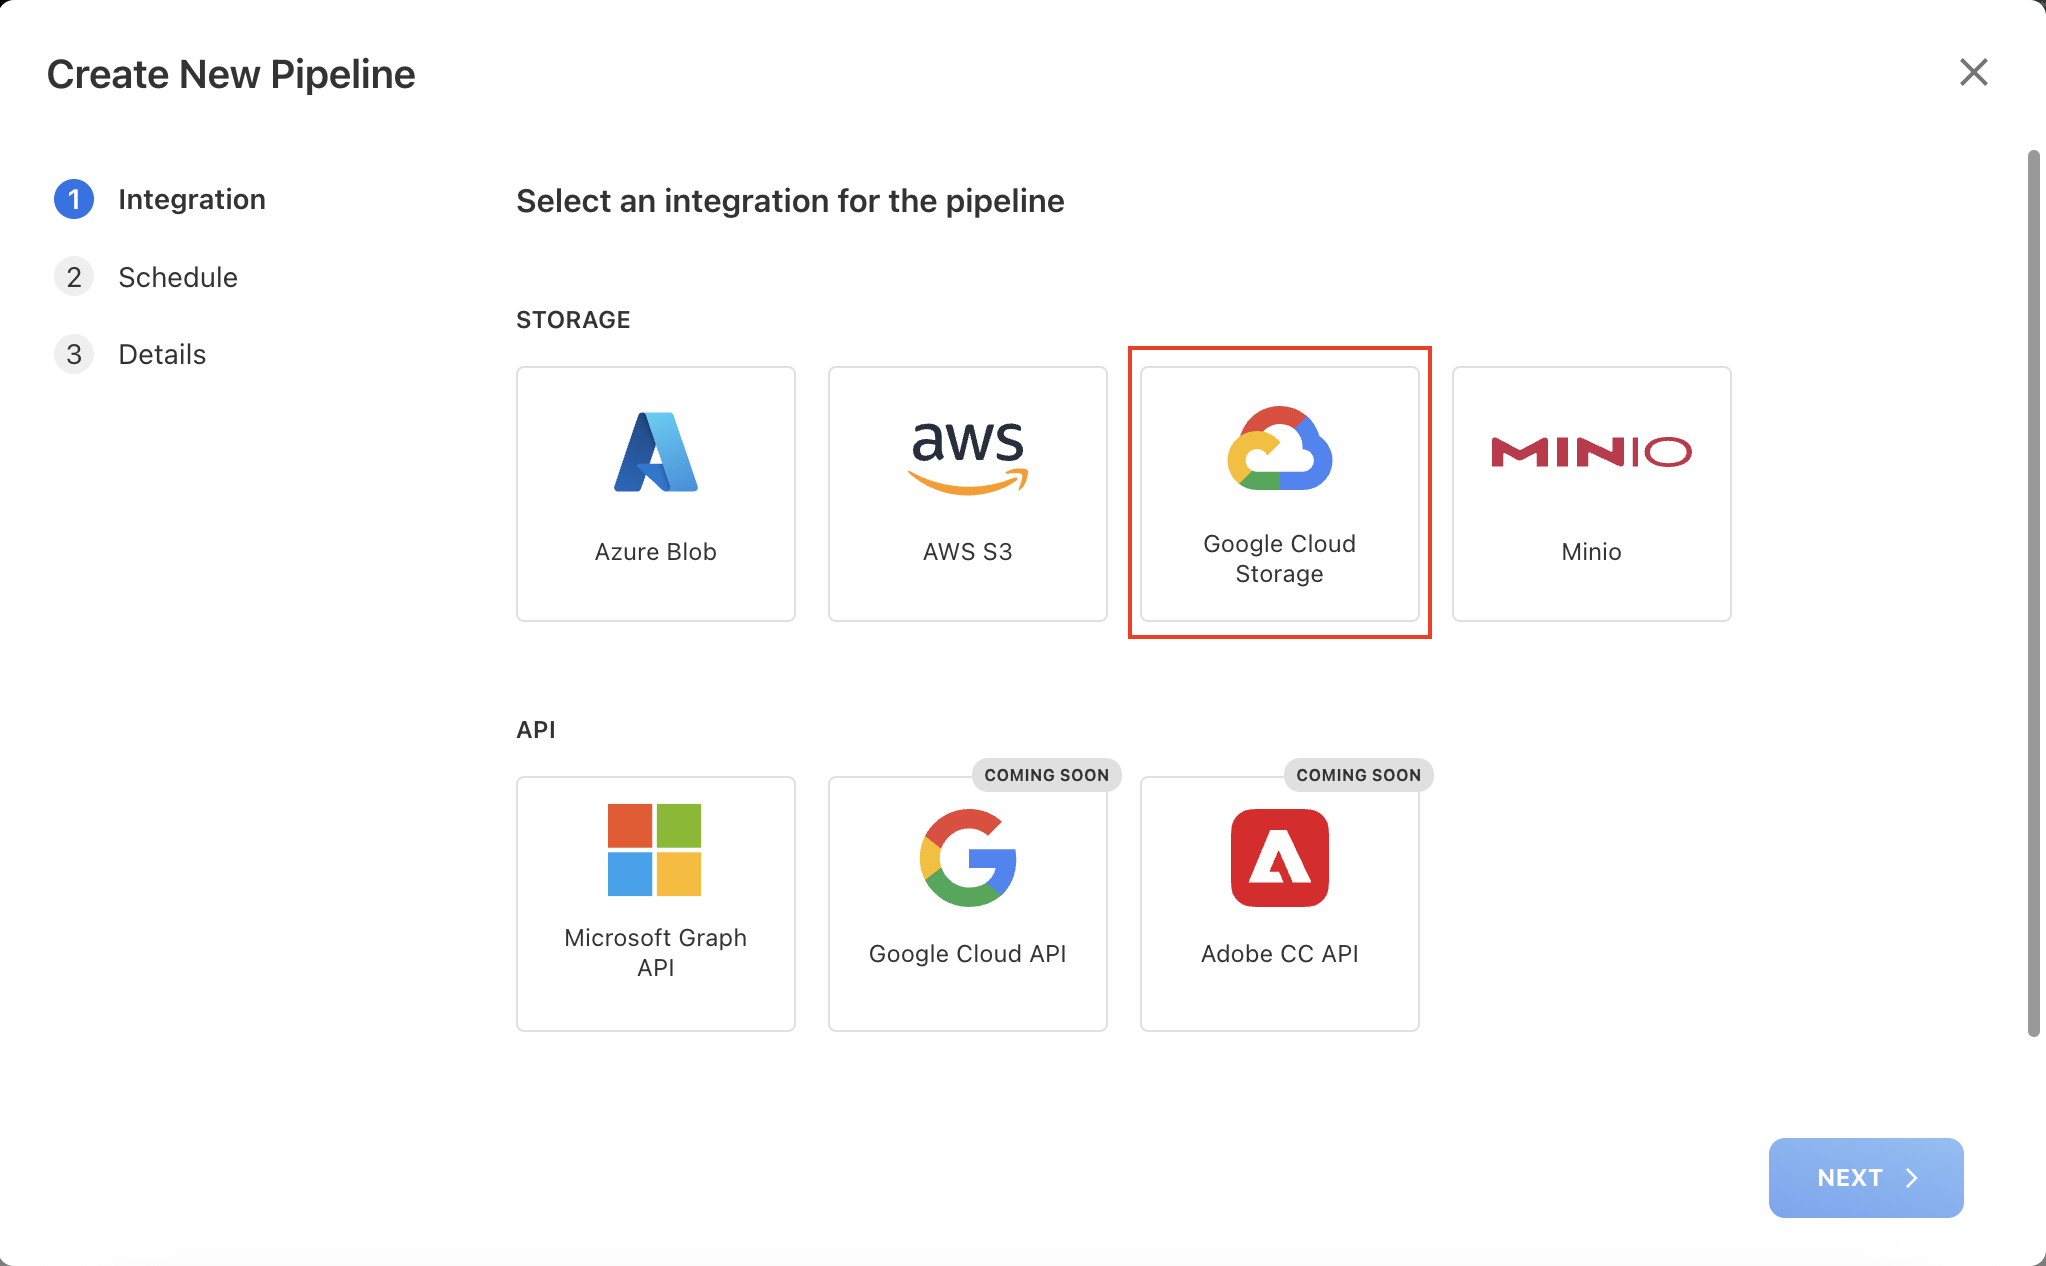
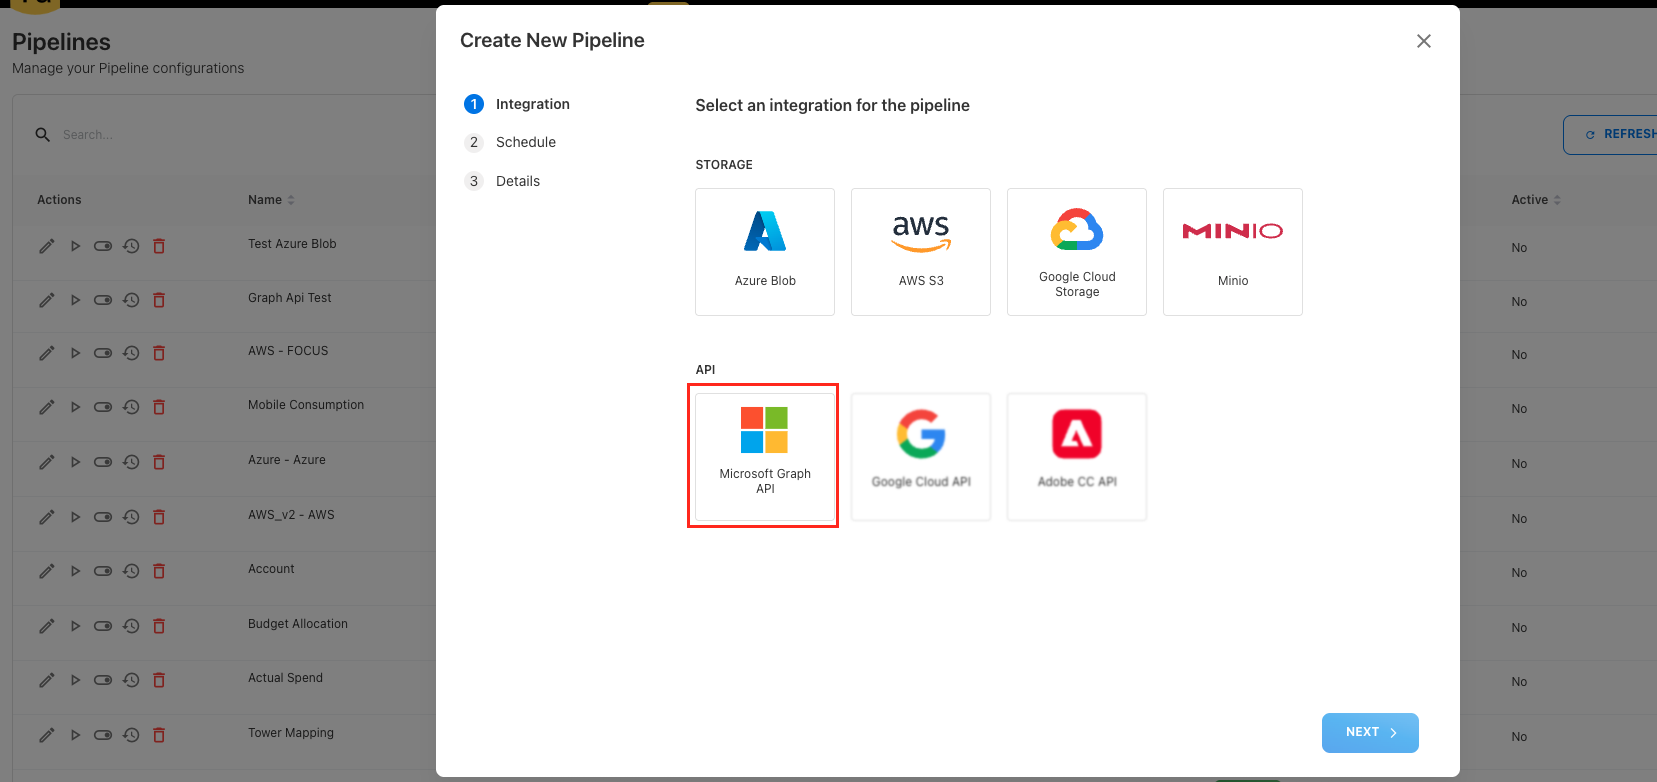
API Connection Creation Flow
The API Connection creation process has been redesigned to provide a more seamless and secure integration experience. As part of this enhancement, the consent URL for integrating APIs (Microsoft Graph API, Power BI API, and Google API) is now embedded directly within the application that allows users to complete the authorization within the app.
When creating a new connection, users can now:
-
Select the connection type and connect to the corresponding API through an in-app OAuth popup, where they can grant the required permissions.
-
Copy and share the consent URL if authorization needs to be completed externally.
-
Optionally auto-create pipelines for the initial data ingestion during the connection setup.
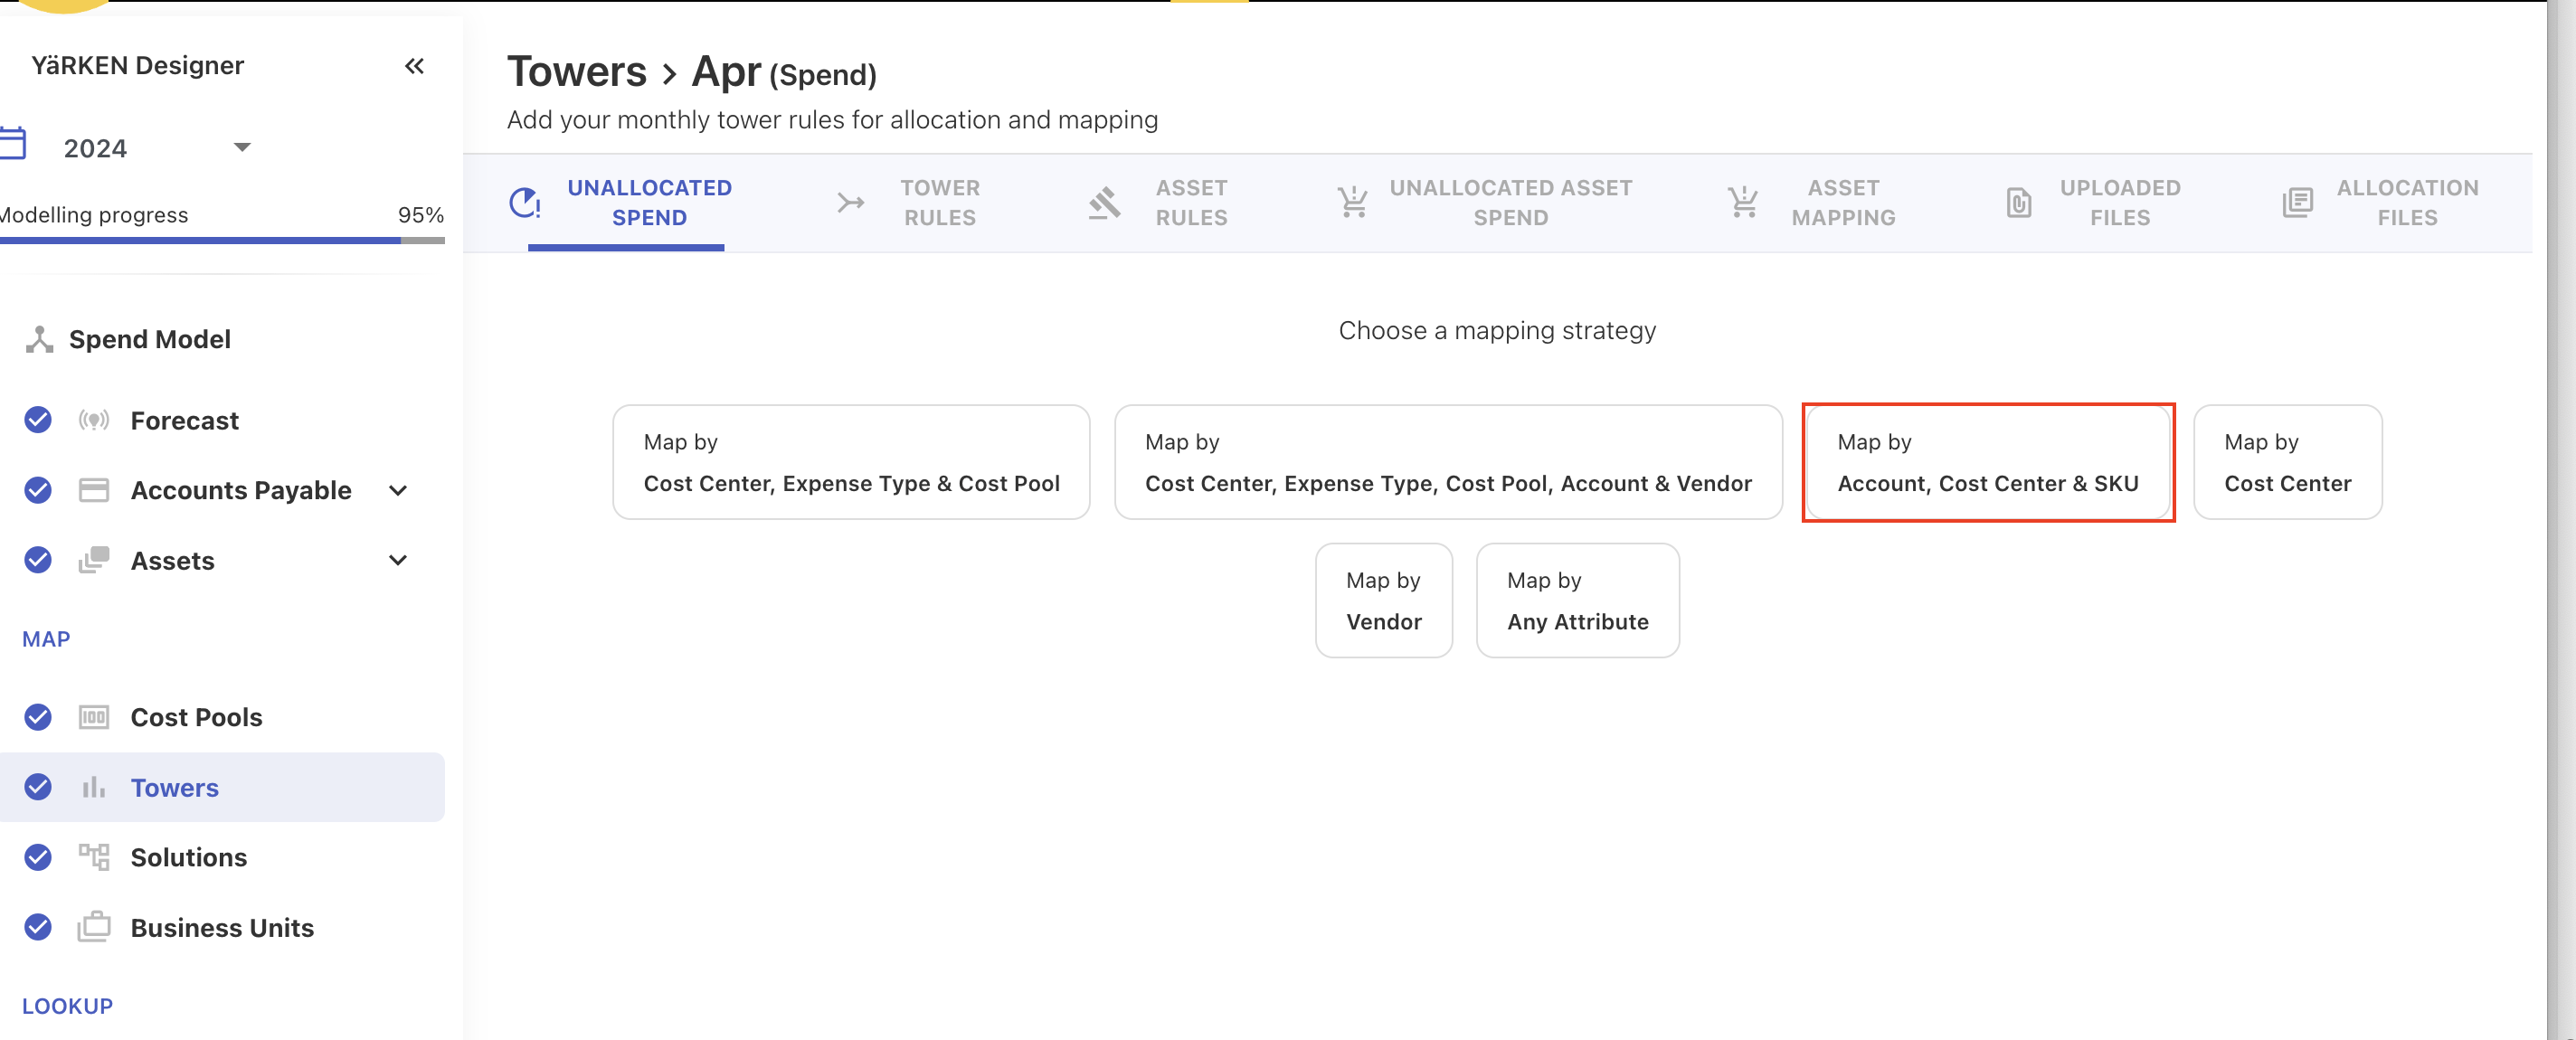
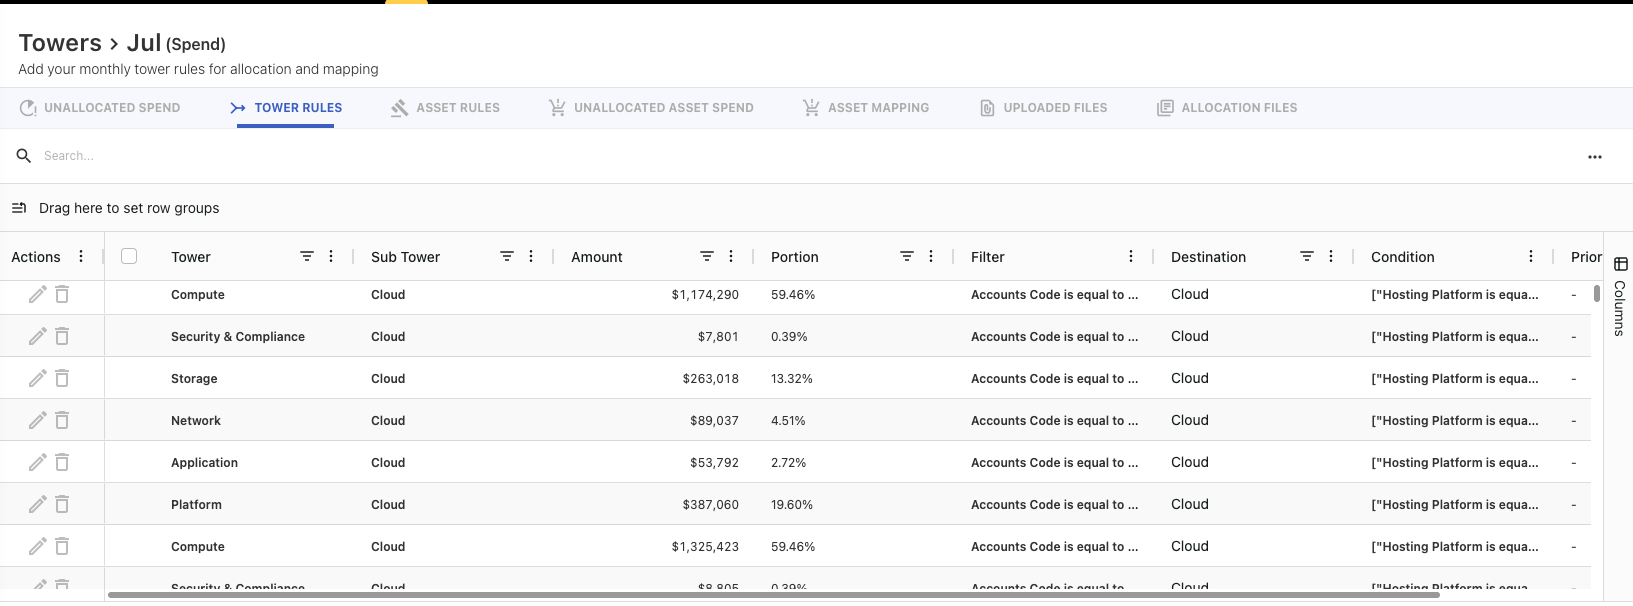
New Allocation Strategy on Tower Rules
A new allocation strategy is enabled in the tower rules that allows users to allocate spend based on a combination of Account, Cost Center, and SKU.
Field Mapping – Persist Default Values Across Uploads and Pipelines
The field mapping process has been enhanced to retain and reuse default values defined during the mapping stage. Previously, when users selected a default value for a field, the application did not persist this value in future uploads or automated processes.
With this update, the chosen default value is now stored within the mapping configuration and automatically applied whenever the same mapping is reused via last loaded mappings.
Additionally, pipelines that use these saved mappings will also utilize the stored default values.
Custom Dashboard - Disable Links in Edit Mode
When editing a custom dashboard, dashboard links are now disabled to prevent accidental navigation. Previously, if a user clicked a linked widget or dashboard while in edit mode, it could cause the user to lose their unsaved changes.
With this update, all links (to other default dashboards or custom dashboards) remain inactive during edit mode.
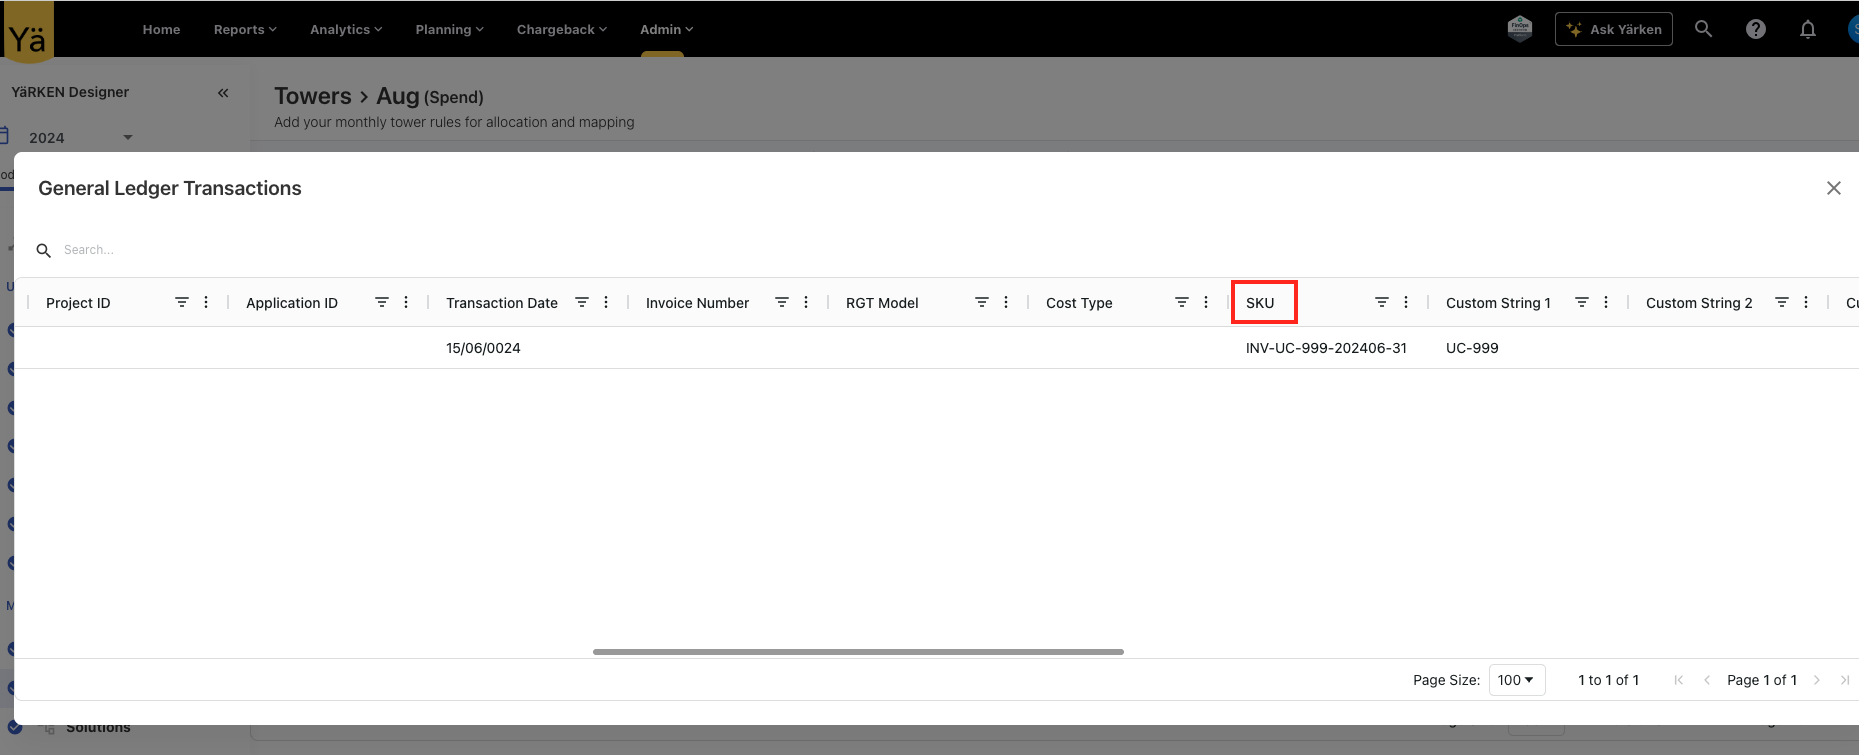
SKU on GL Transaction Popup
An SKU field is added to the GL Transaction popups within the Tower and Cost Pool module.
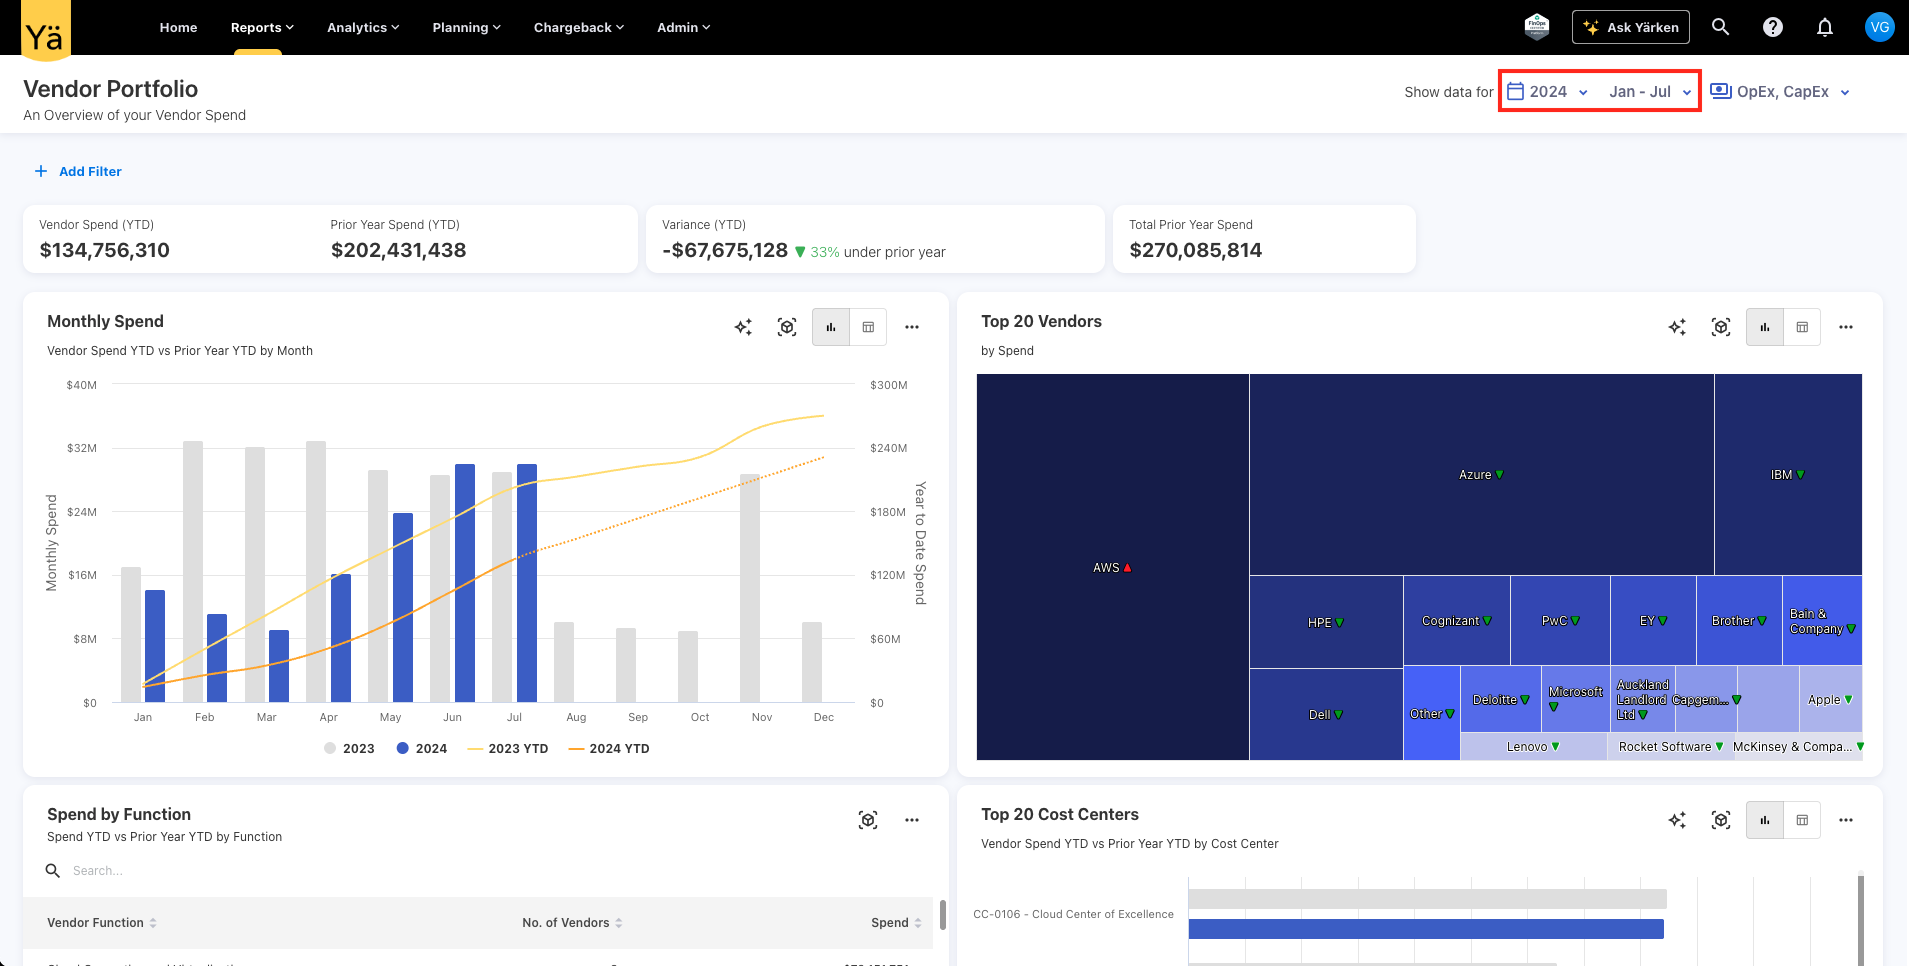
Prior Year Data Fixes on Charts and Reports
An issue was identified when showing the previous year’s data on the charts, where prior year values on charts did not show the full previous year’s data. This discrepancy happened because the month filter applied on the dashboards was also being applied to the previous year’s data, instead of limiting it to the current year only.
This behavior has been corrected so that month filters only apply to the current year’s data. The filter ensures that prior year values are excluded from the filtering conditions, and the charts show the full previous year’s data.
Solution Mapping Field Mismatch
An issue was identified in the solution mapping process where downloading and reuploading the same file resulted in errors due to field name mismatches. Specifically, during the download, the fields Asset ID and Offering ID were automatically converted to Asset Code and Offering Code, causing discrepancies when reuploading the file.
This issue has now been resolved, and the downloaded files retain the correct field names.
Enhancements and bug fixes
Tower Rules
A new grid component has been integrated into the tower rules to enhance rule handling and user experience. The new grid improves performance, responsiveness, and usability when managing large tower rules. It supports smoother scrolling, faster data loading, and more efficient rendering of rule entries.
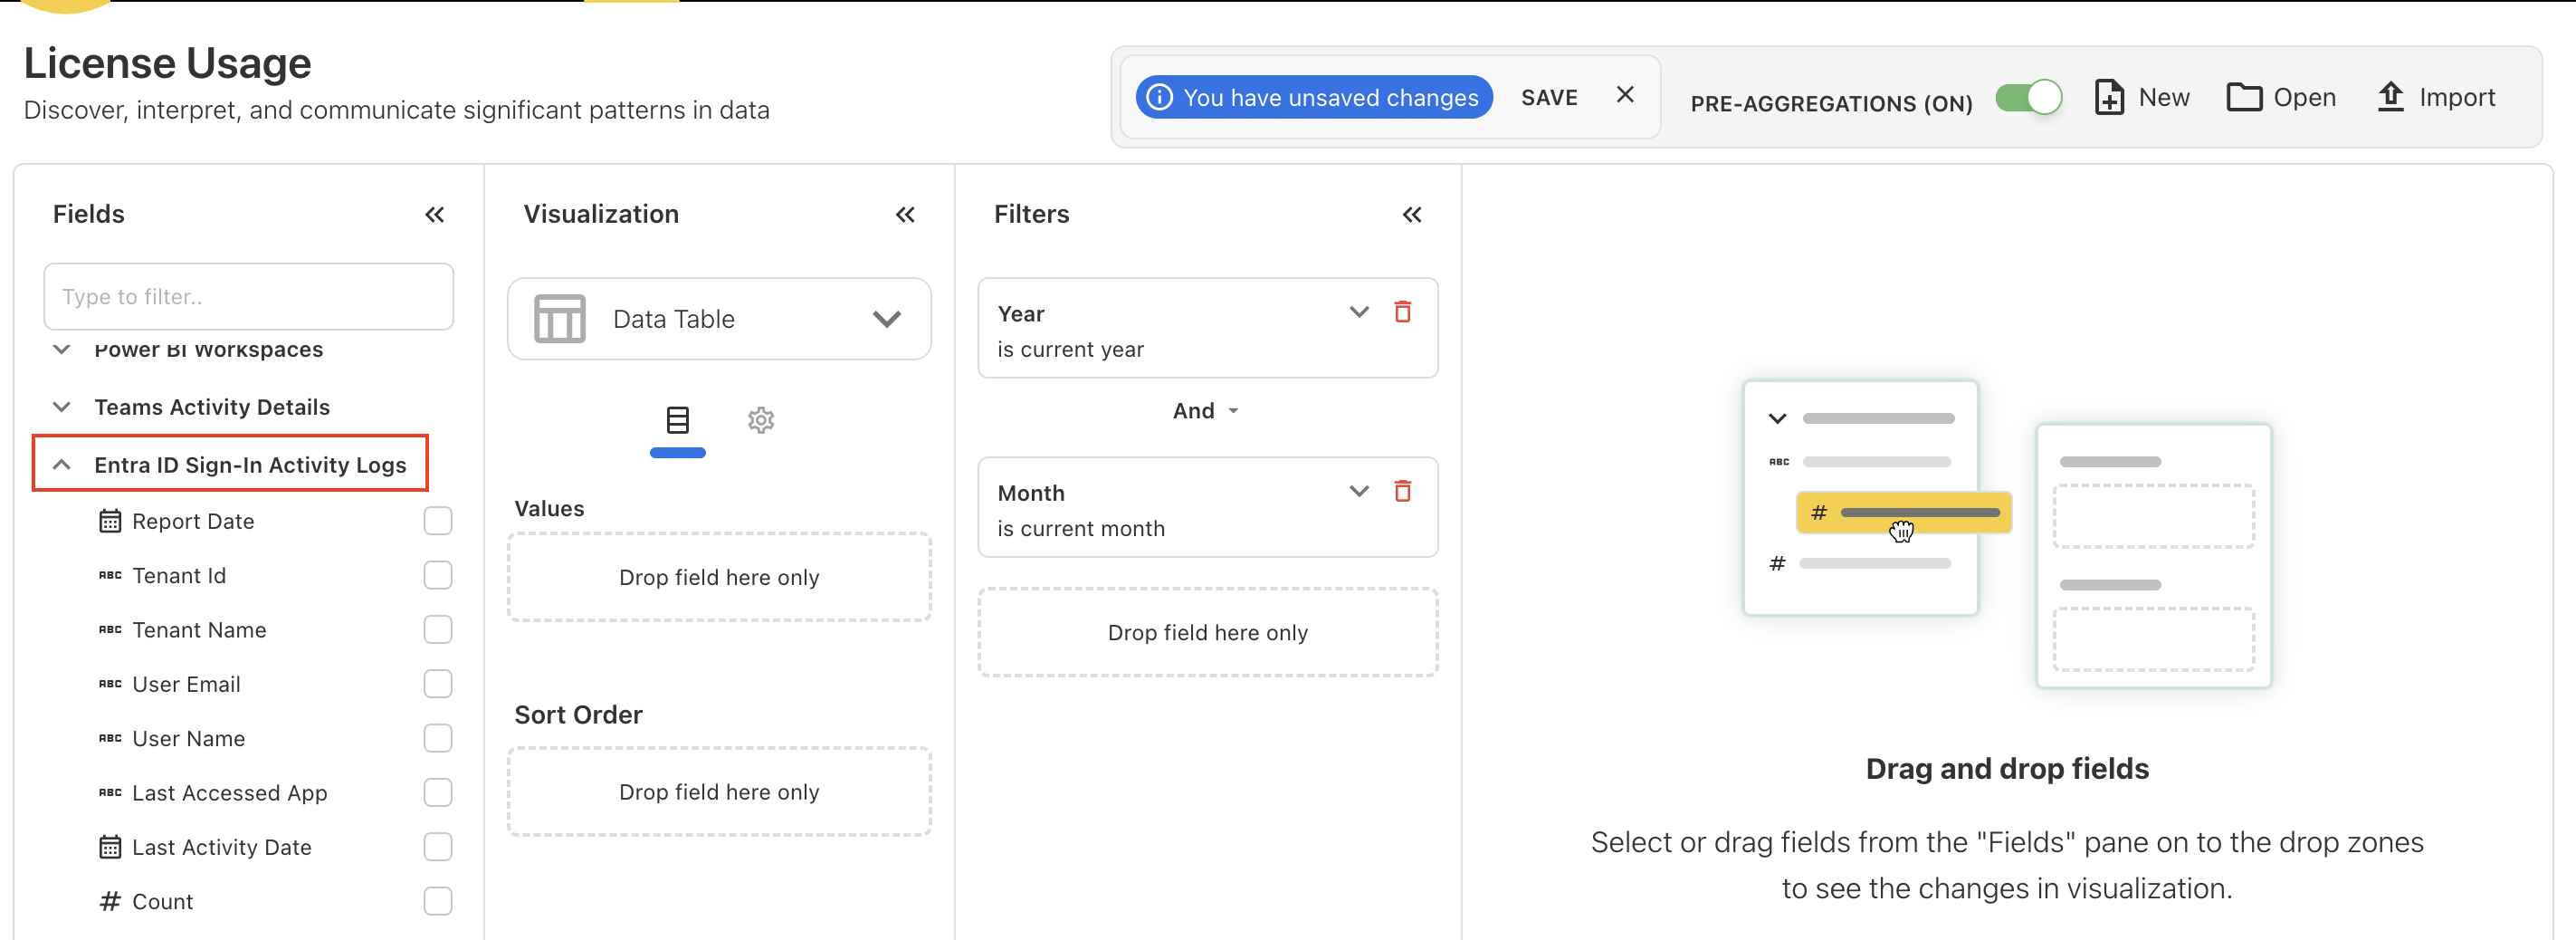
User Name in License Usage
A new permission option has been introduced under Default Settings to control whether user names can be retrieved and displayed in the License Usage reports. Admins can now choose to grant or deny permission for retrieving user names by selecting Yes or No.
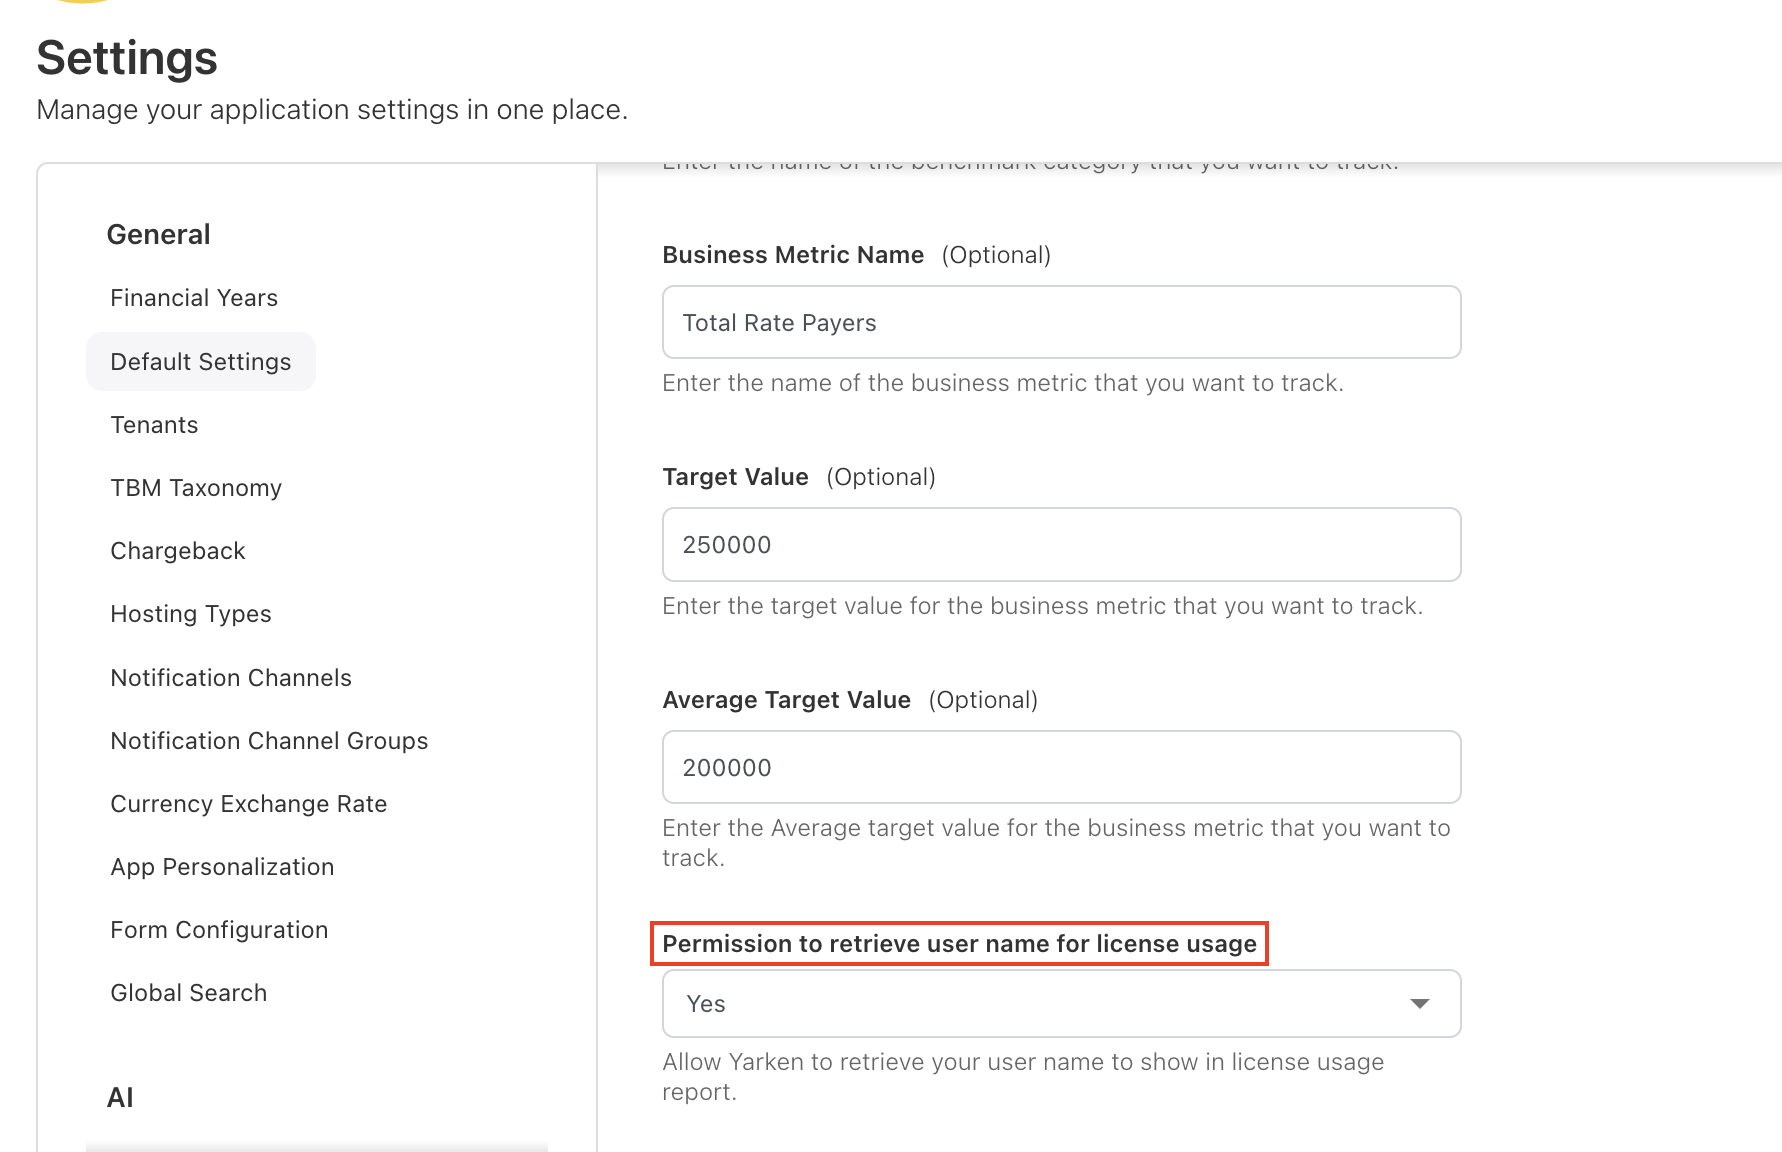
When permission is granted, the application retrieves and displays user names in the License Usage cube for better visibility and tracking. If the permission is not granted, the app will exclude user names and shows empty values.
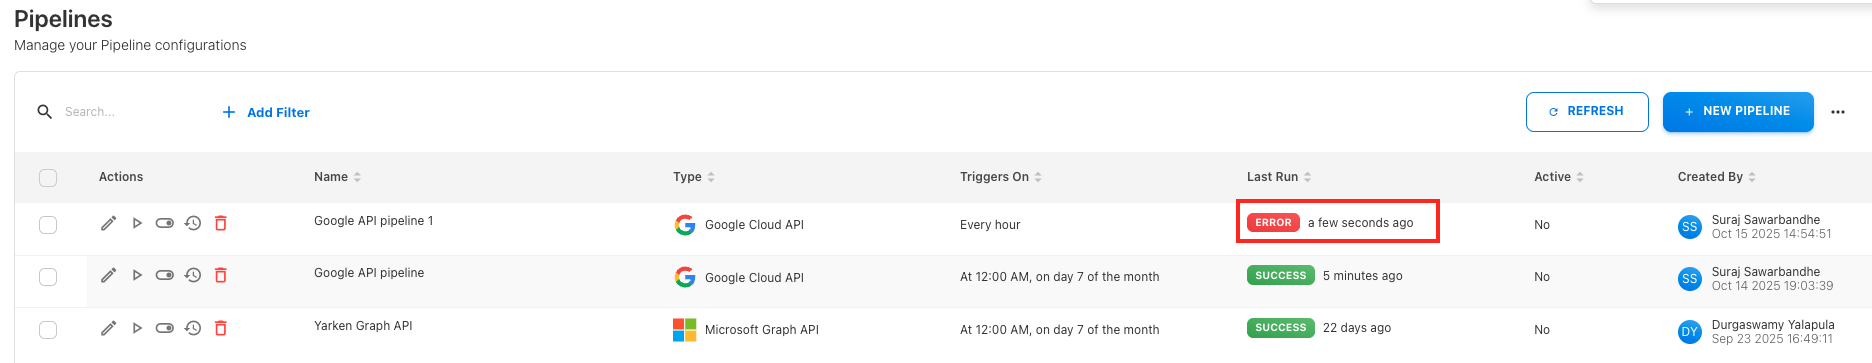
Error Status in Connections
When a pipeline run fails, the running status is modified to show Error. Previously, the pipeline simply displayed the Success status, with the error status visible only when the user checked the pipeline's running history.
Others Category
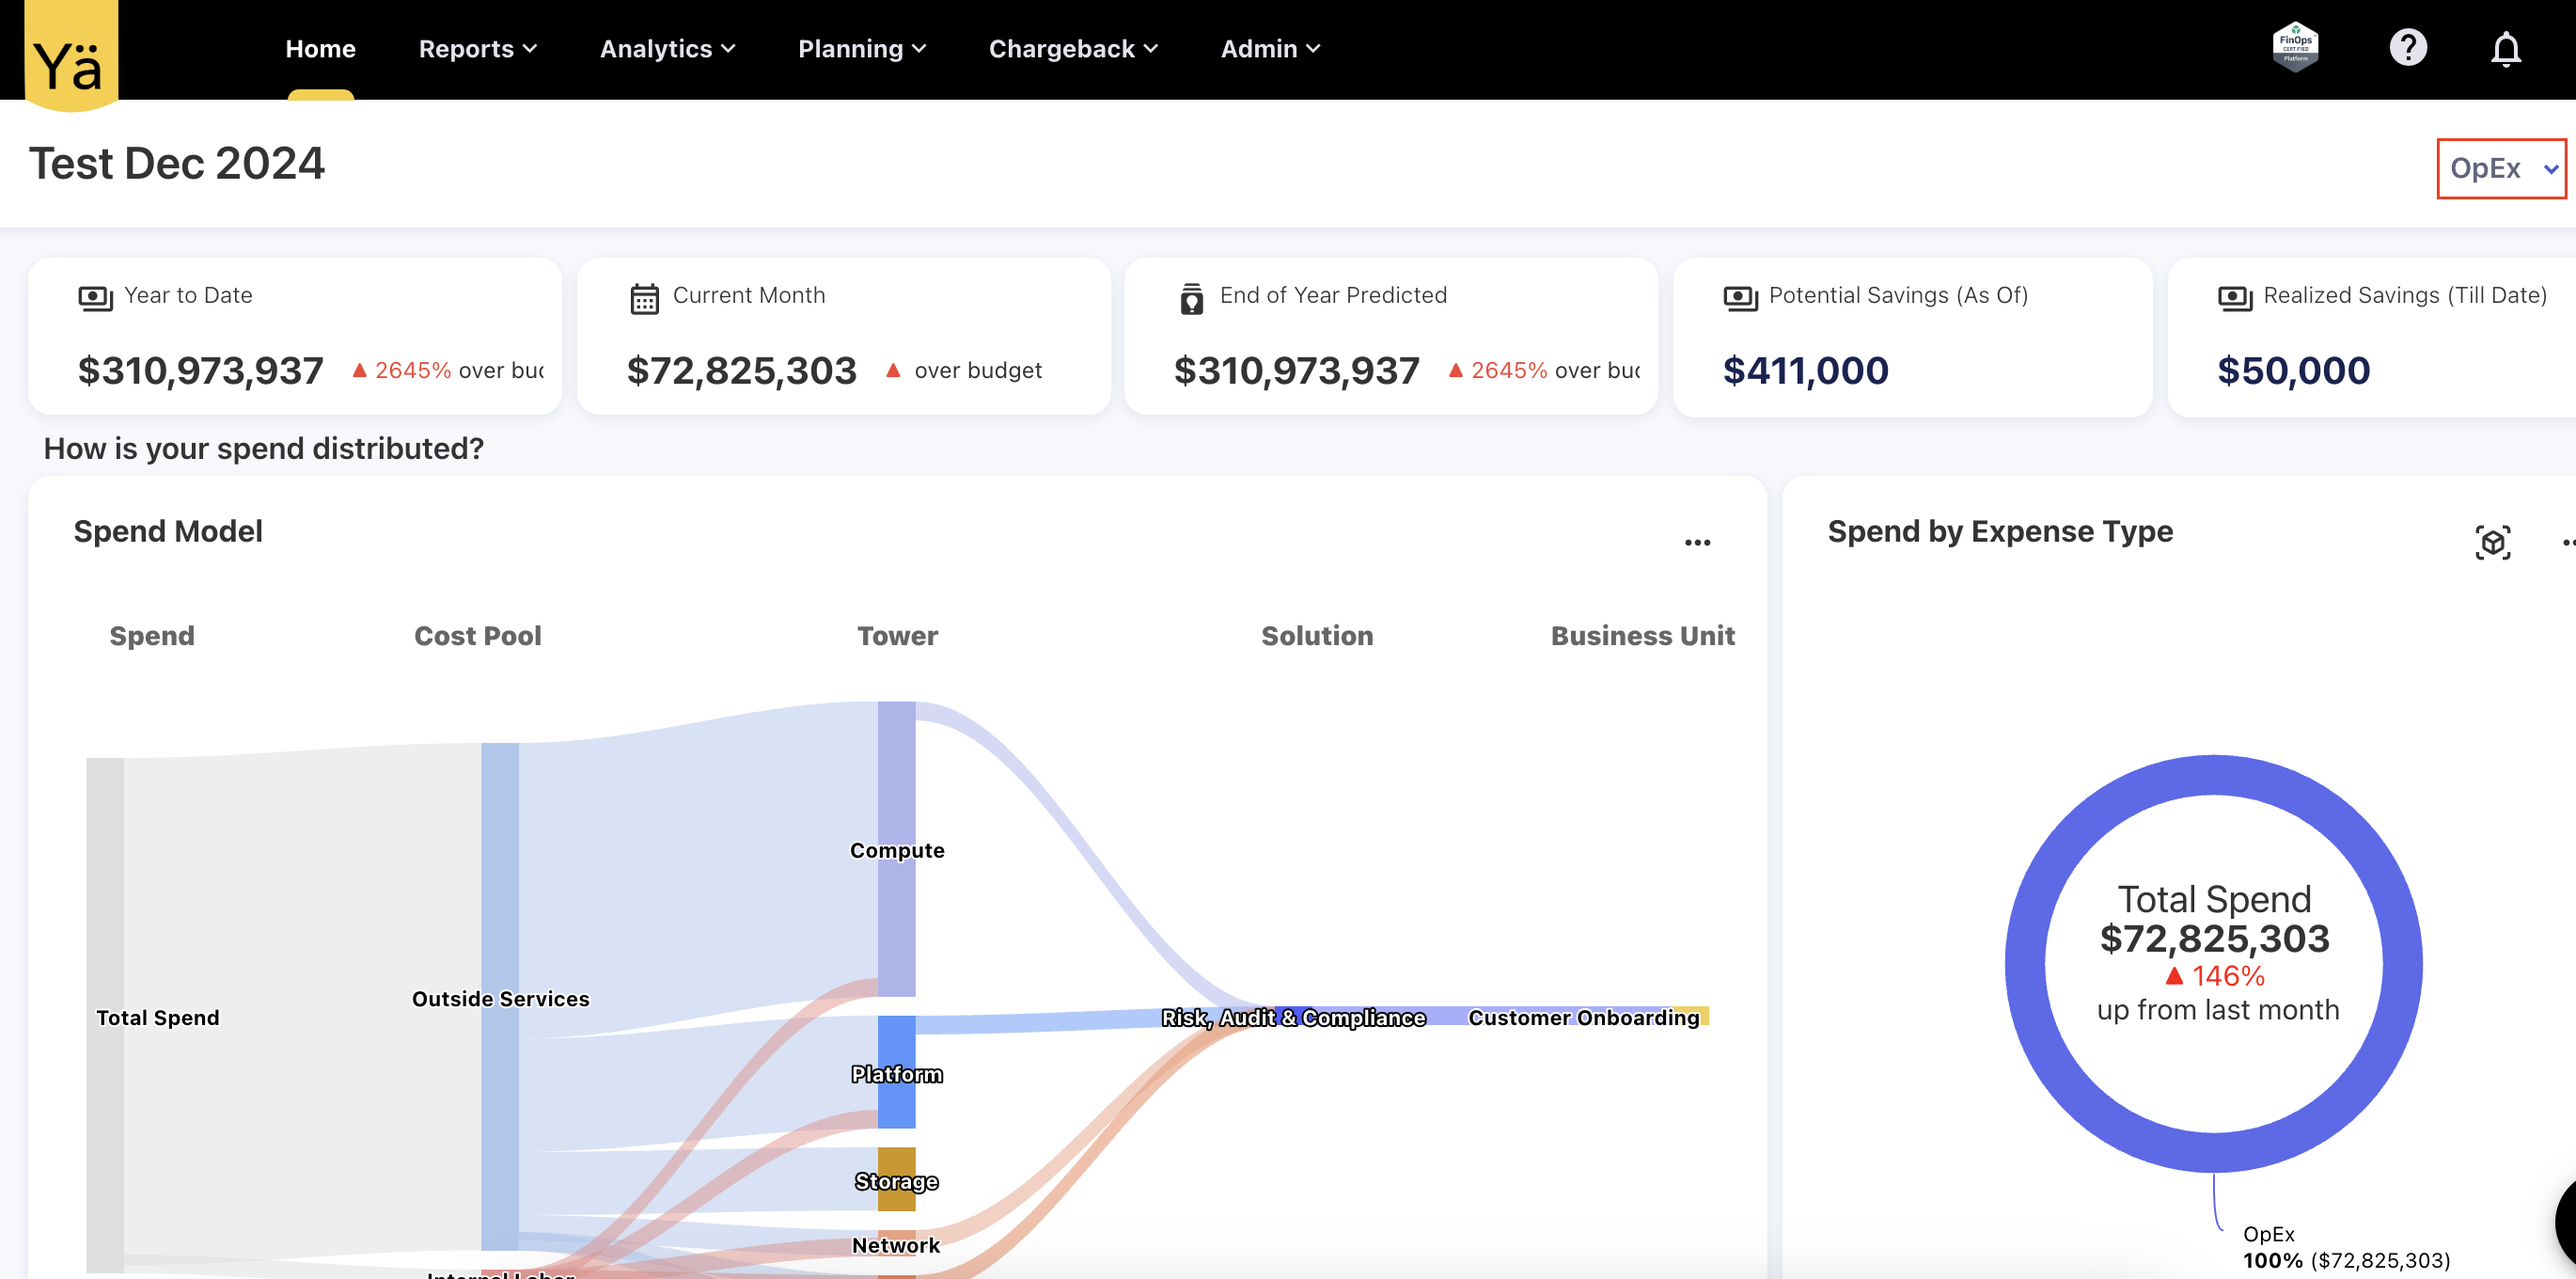
The Business Unit and Solution Offering on CT charts and tables are updated to show Others category when the items exceed the top 20.
-20251029-075322.png?cb=e122d6aee84a1a0335a6792b54b4a544)
The Home page’s Sankey chart is also restricted to 10+ items in Others category. However, non-home page Sankey is still limited to 20 items.
-20251030-113601.jpeg?cb=1f11b2d571973d4d9624dac2db494447)
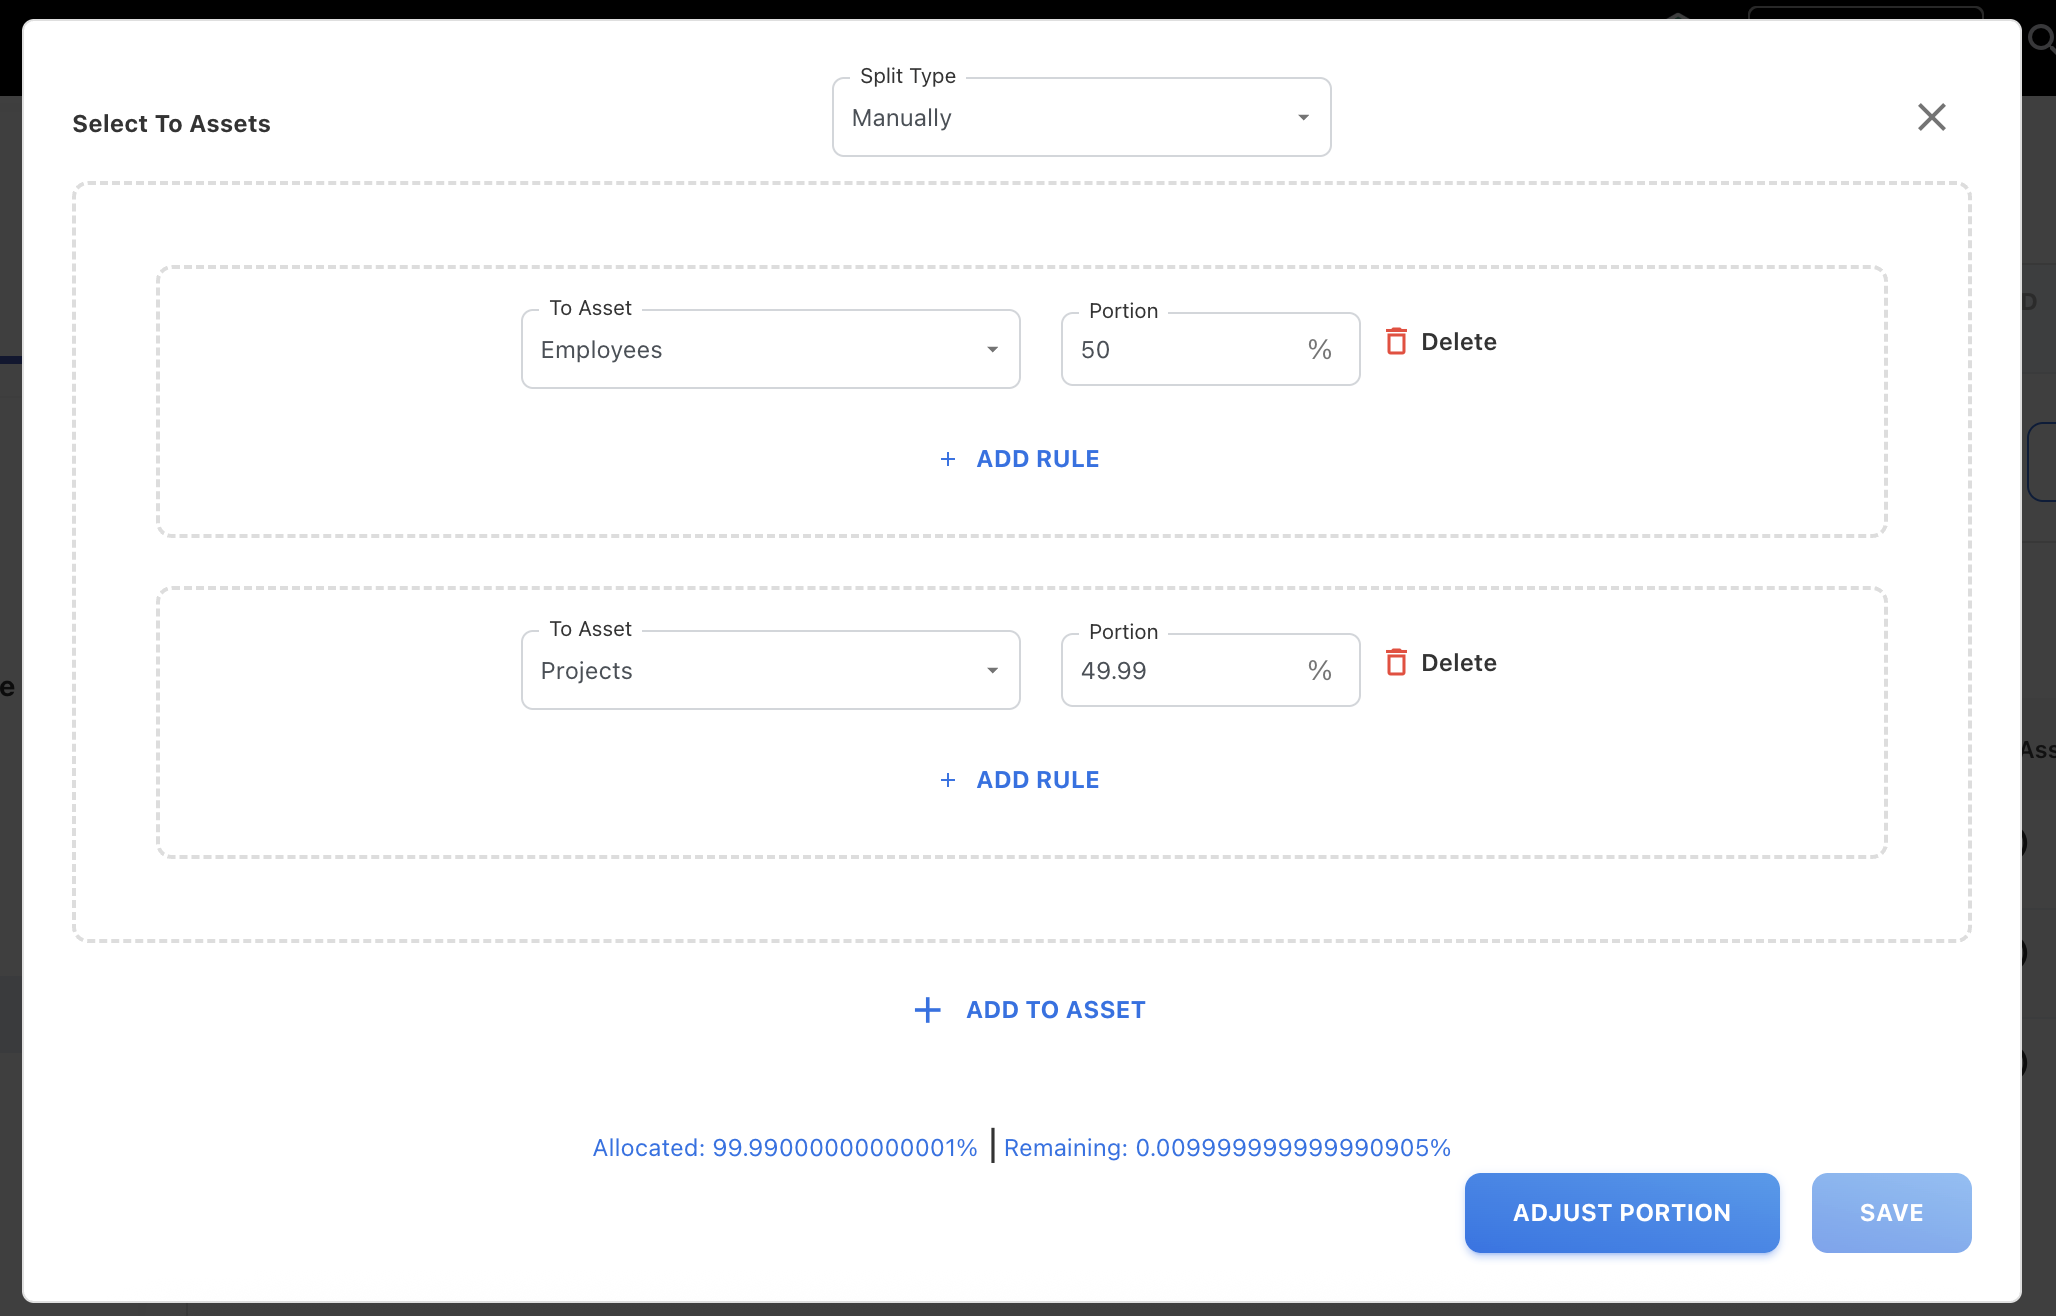
Asset Rules – Adjust Portion Button for Rounding Precision
When adding the portion to multiple assets in the asset rules, the remaining portion values were not rounding off correctly due to small differences. To address the rounding issue, a new Adjust Portion button is added to correct the remaining portion.
With this update, the Adjust Portion button automatically adjusts the remaining portion. The button becomes active when the remaining portion is between -0.01 and 0.01. This fix ensures remaining portions always sum up accurately and eliminates manual correction.
Enhancements
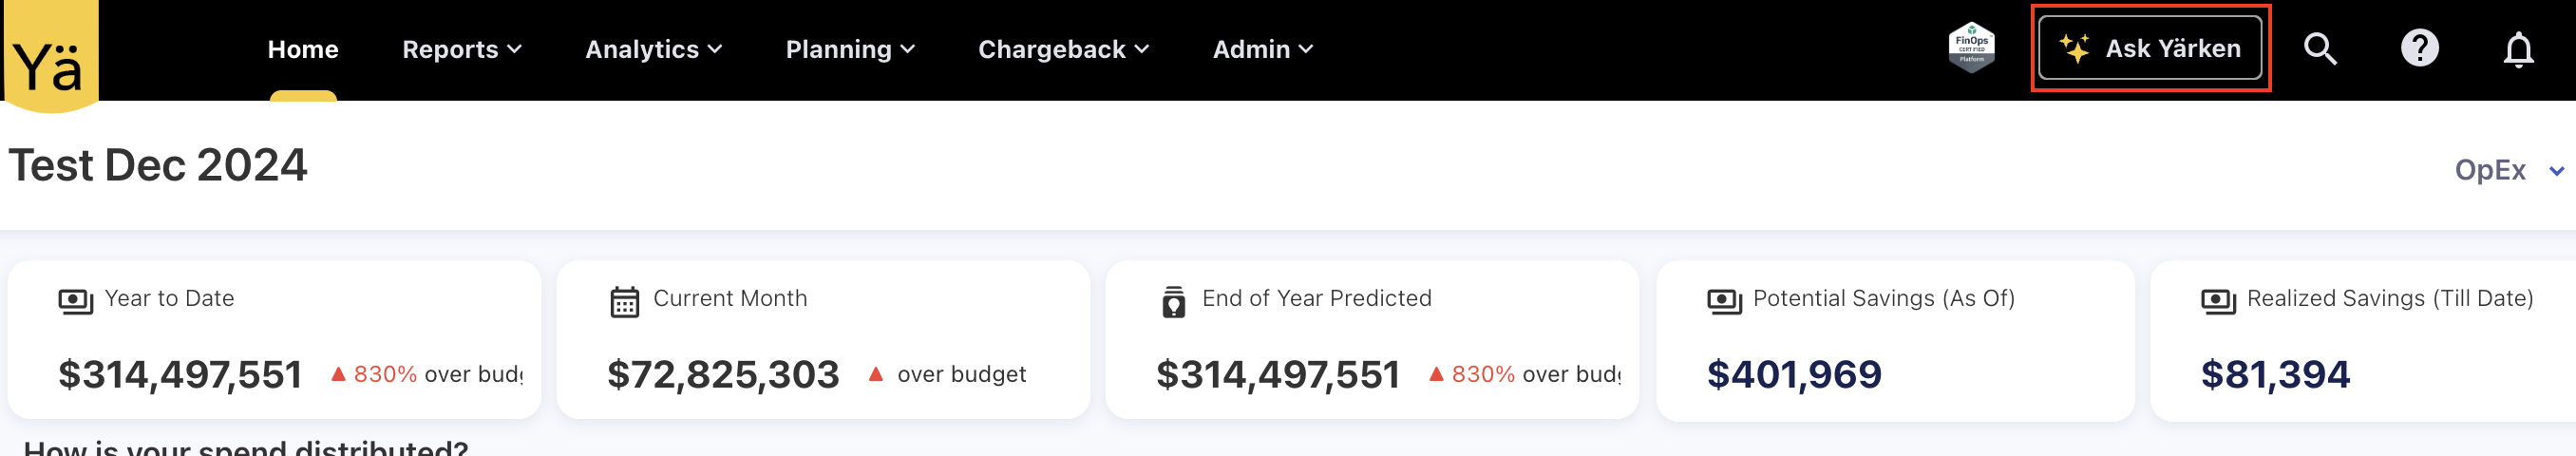
Ask YäRKEN on Toolbar
The Ask YäRKEN button is now relocated to the top toolbar for easier access.
Pipeline UI Enhancements
The Pipelines page has been updated with several usability improvements to make managing integrations easier. You can now select multiple pipelines and perform bulk actions — run, schedule, activate, deactivate, refresh, or delete in a single operation.
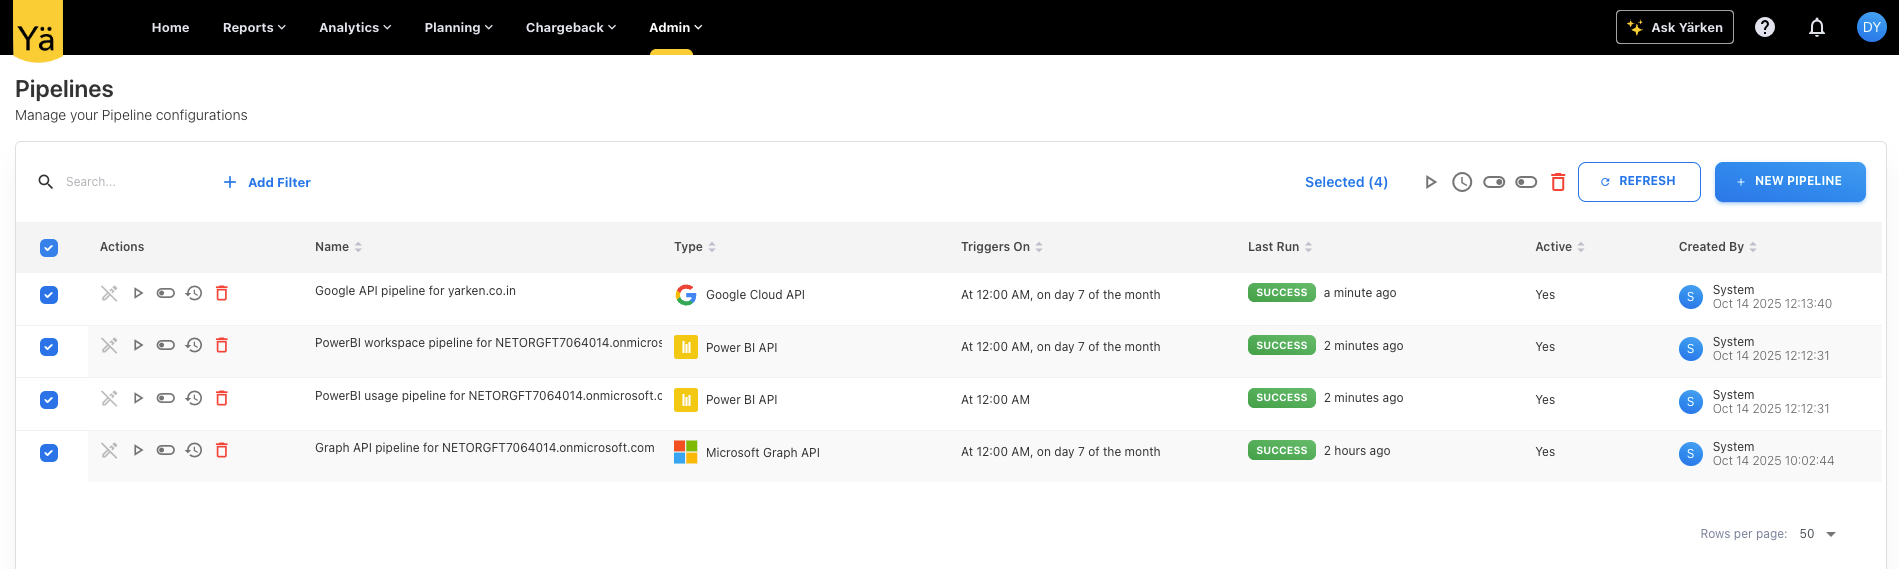
A new filter button is added that helps you quickly identify pipelines by type, status (active / inactive), and last run status (failed or success). Additionally, an export option is available to download pipeline details (including name, status, and last run).
Auto-creation of Pipelines Using Consent Link
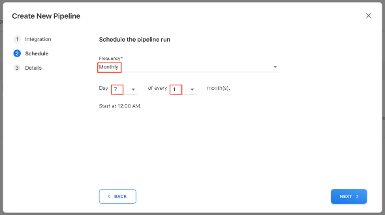
The Pipelines creation process is now easier and faster. When a user accepts the application via the consent link, the system now automatically creates the required pipelines for Microsoft Graph API, Power BI API, and Google API (depending on links). As soon as those pipelines are created, they are triggered to run immediately for initial ingestion without manually triggering the run.
By default the newly created pipelines are scheduled to run monthly on the 7th. Existing daily and hourly schedules are left unchanged.
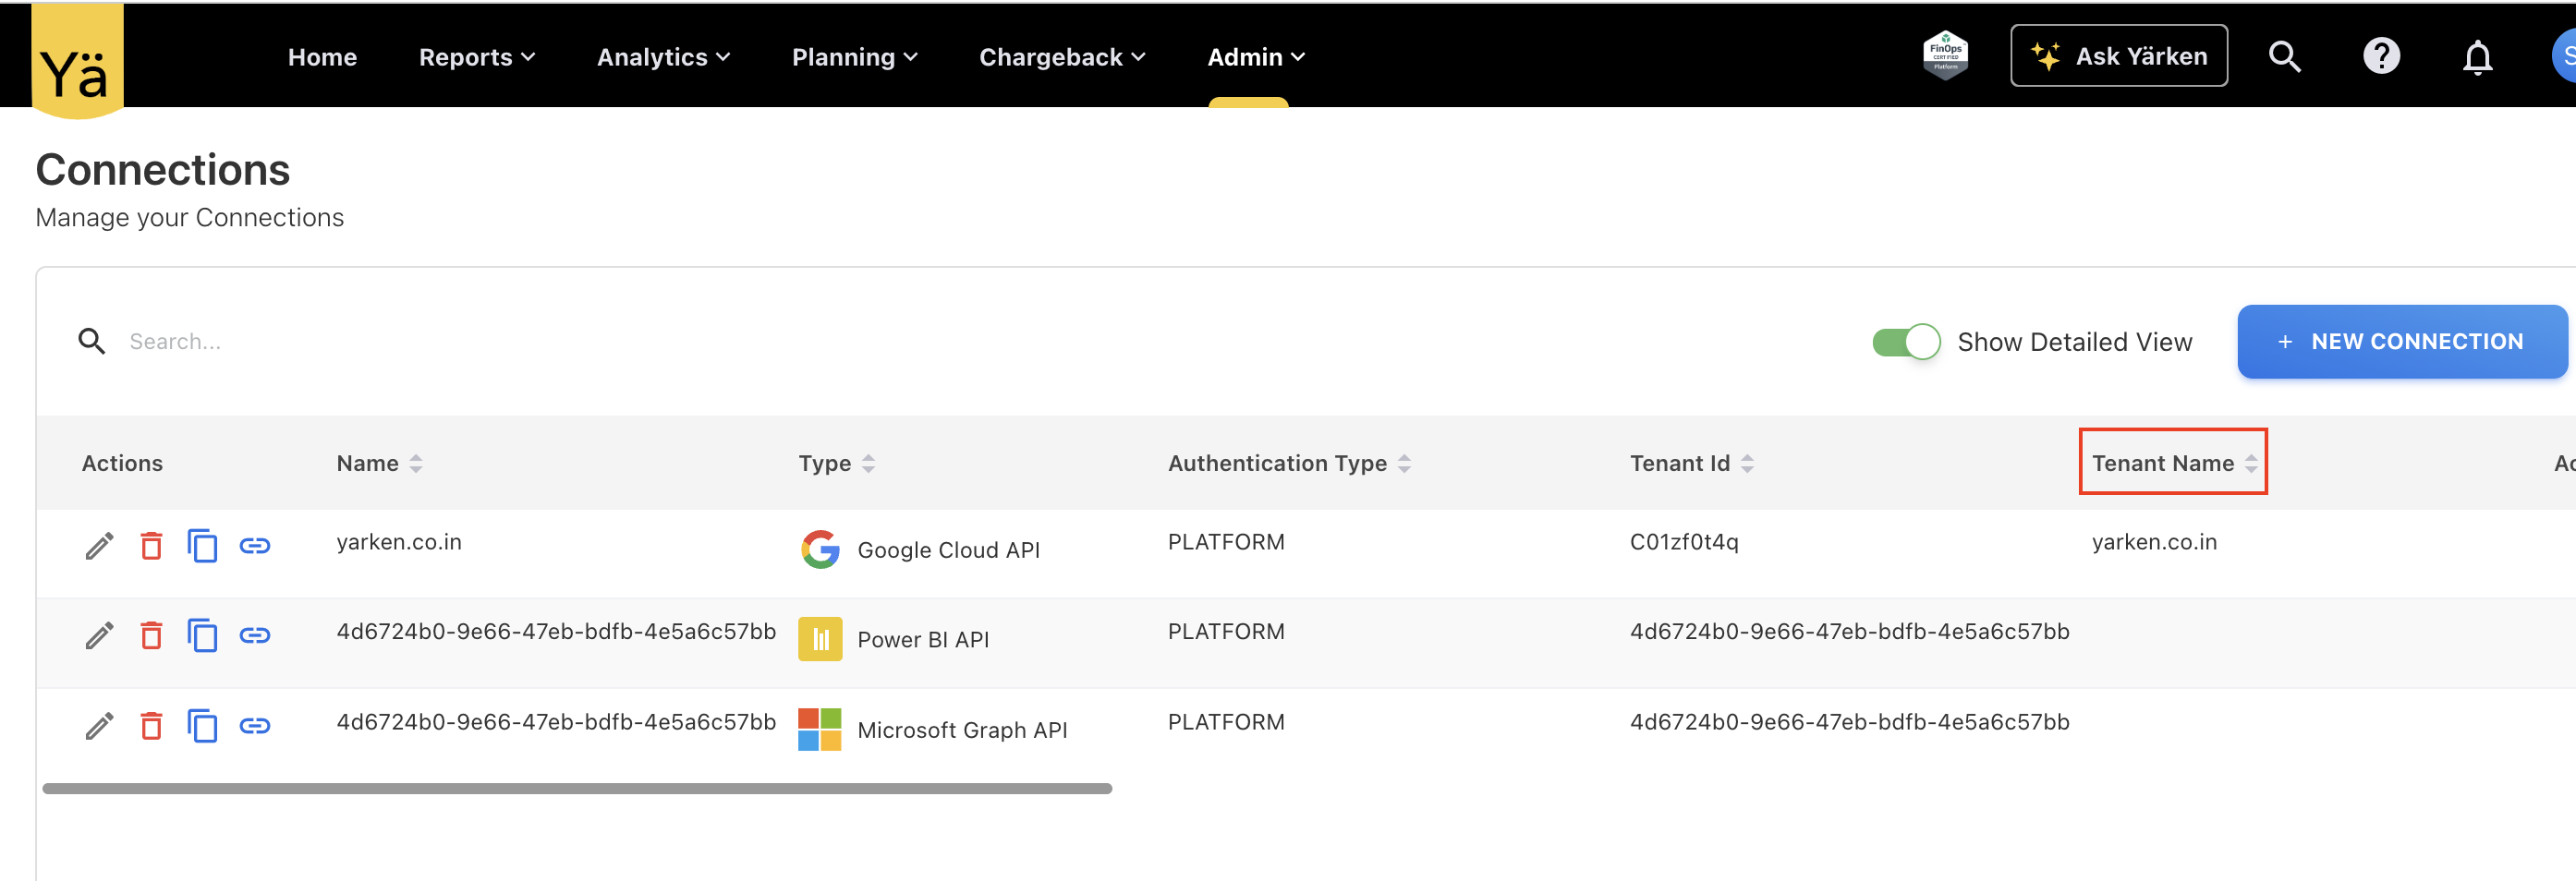
Auto-Capture of Tenant Name in Connections
In the Connections page, a new Tenant Name column is added to auto capture and populate the tenant names for supported integrations such as Microsoft and Google APIs. If this column is not auto populated then user can opt to add the tenant name manually.
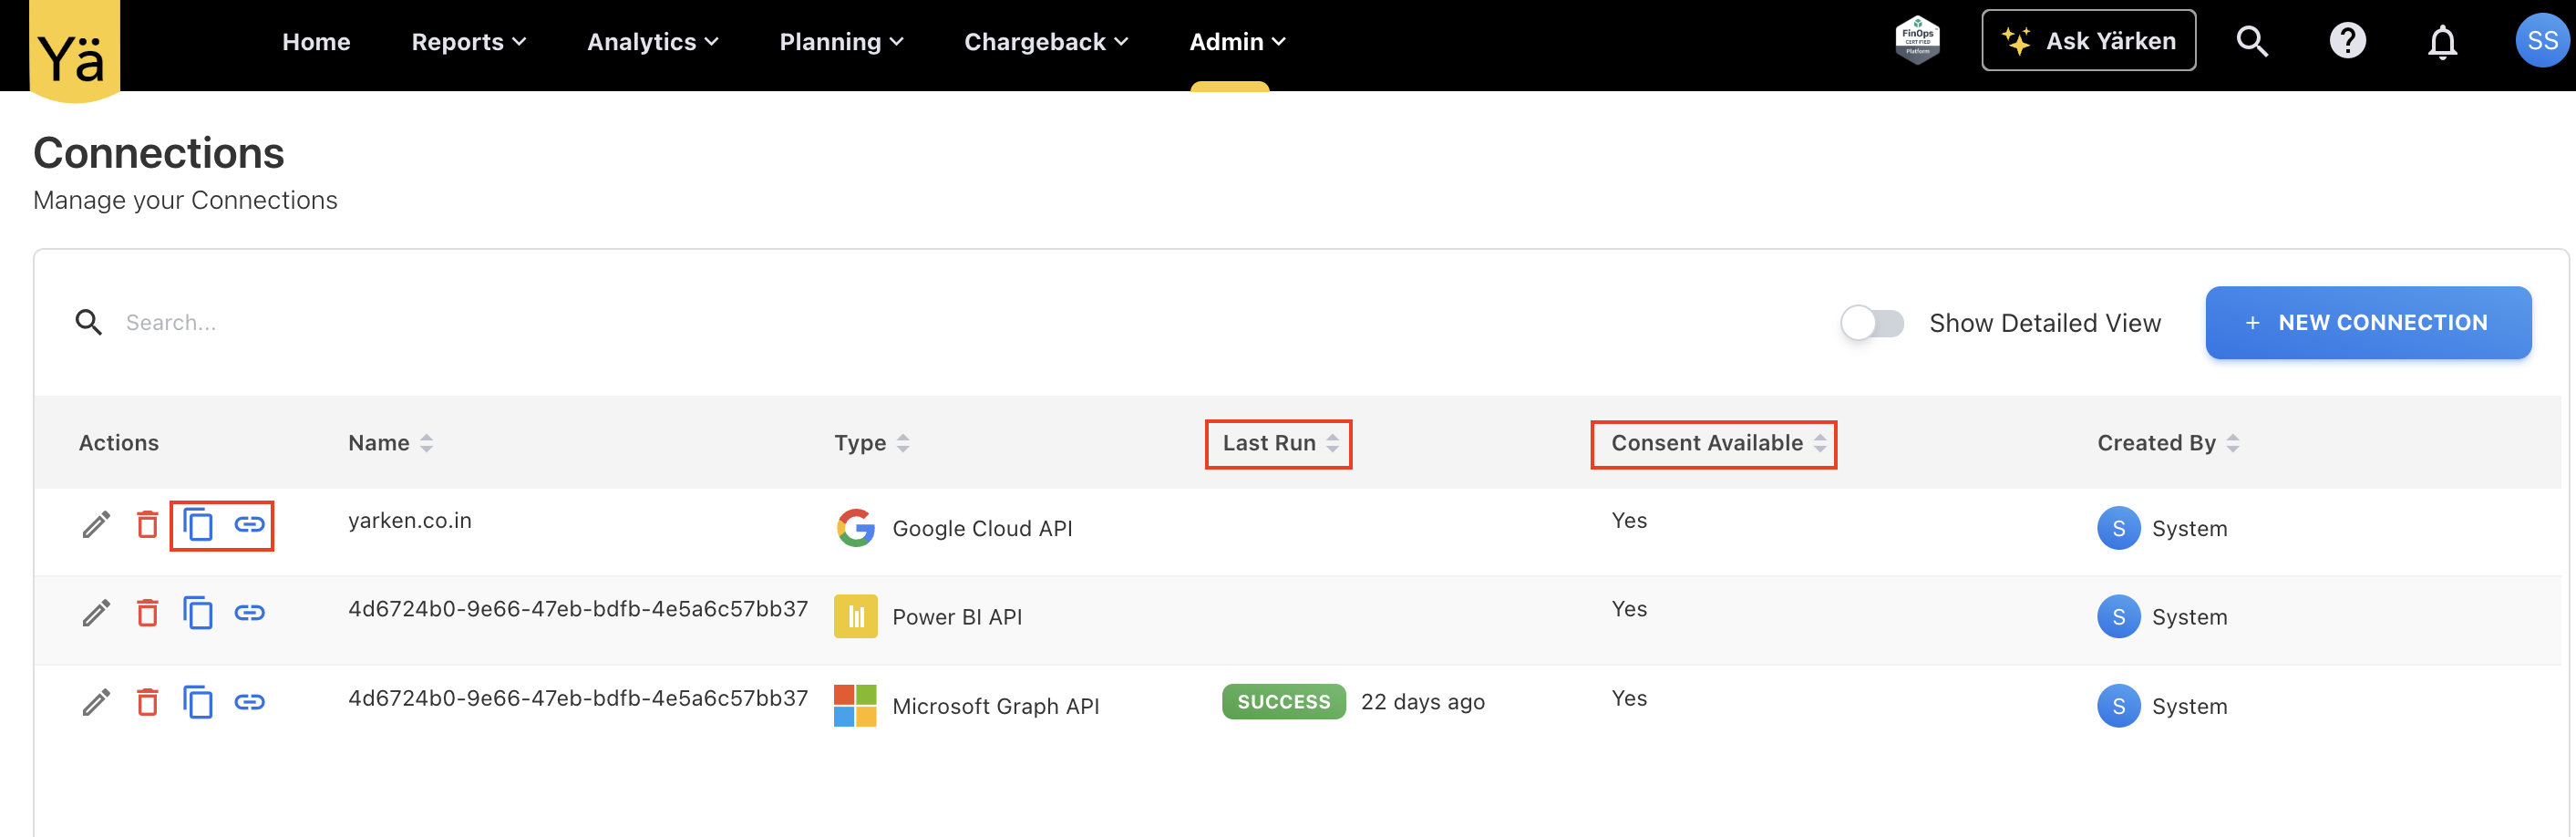
New Columns in Connections
The Connections page is enhanced with two new buttons for the consent:
-
Copy Consent URL – copying the app consent link to clipboard.
-
Redirect to Consent URL – opening the consent page directly.
Two new status columns have also been added:
-
Last Run - showing the most recent pipeline connection execution time.
-
Consent Available - indicating whether a valid consent/authorization exists for that connection.
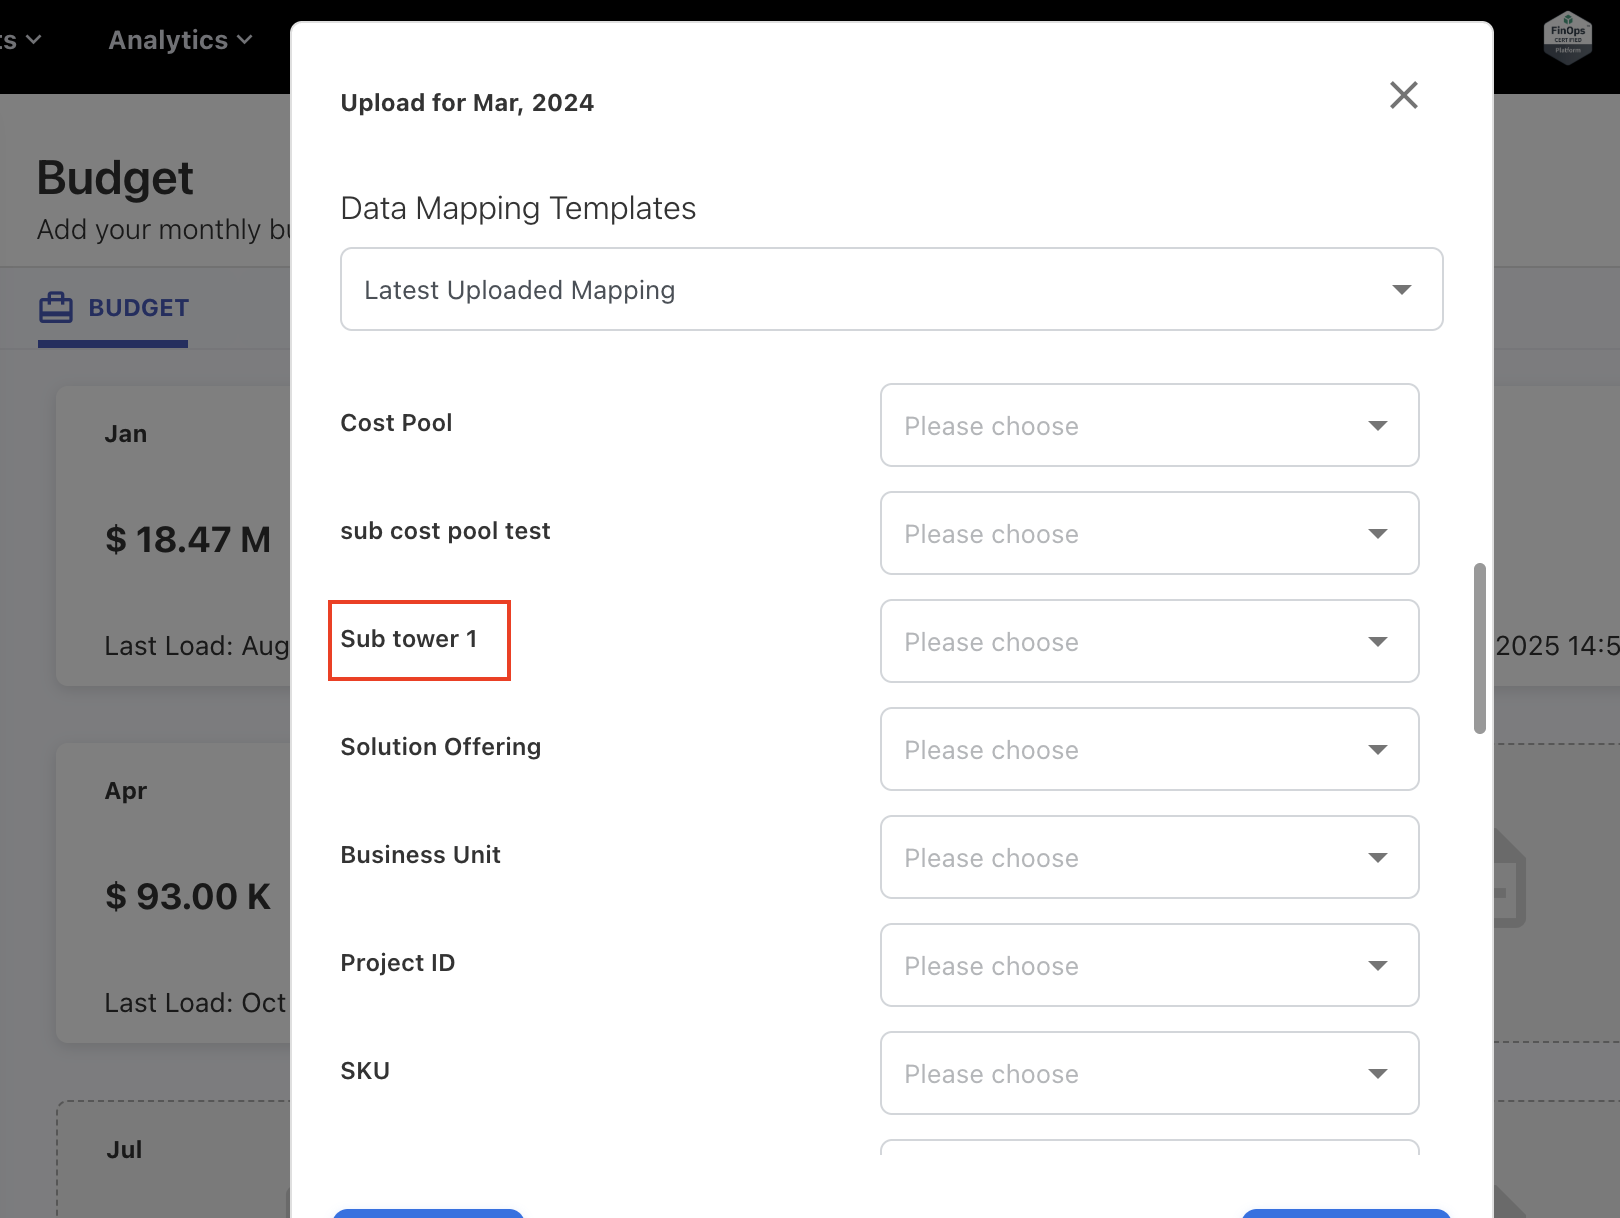
Form Configuration Fields in Budget Upload
The configurable fields defined through Form Configuration will be correctly displayed in the Budget upload menu and are also included in the budget upload template.
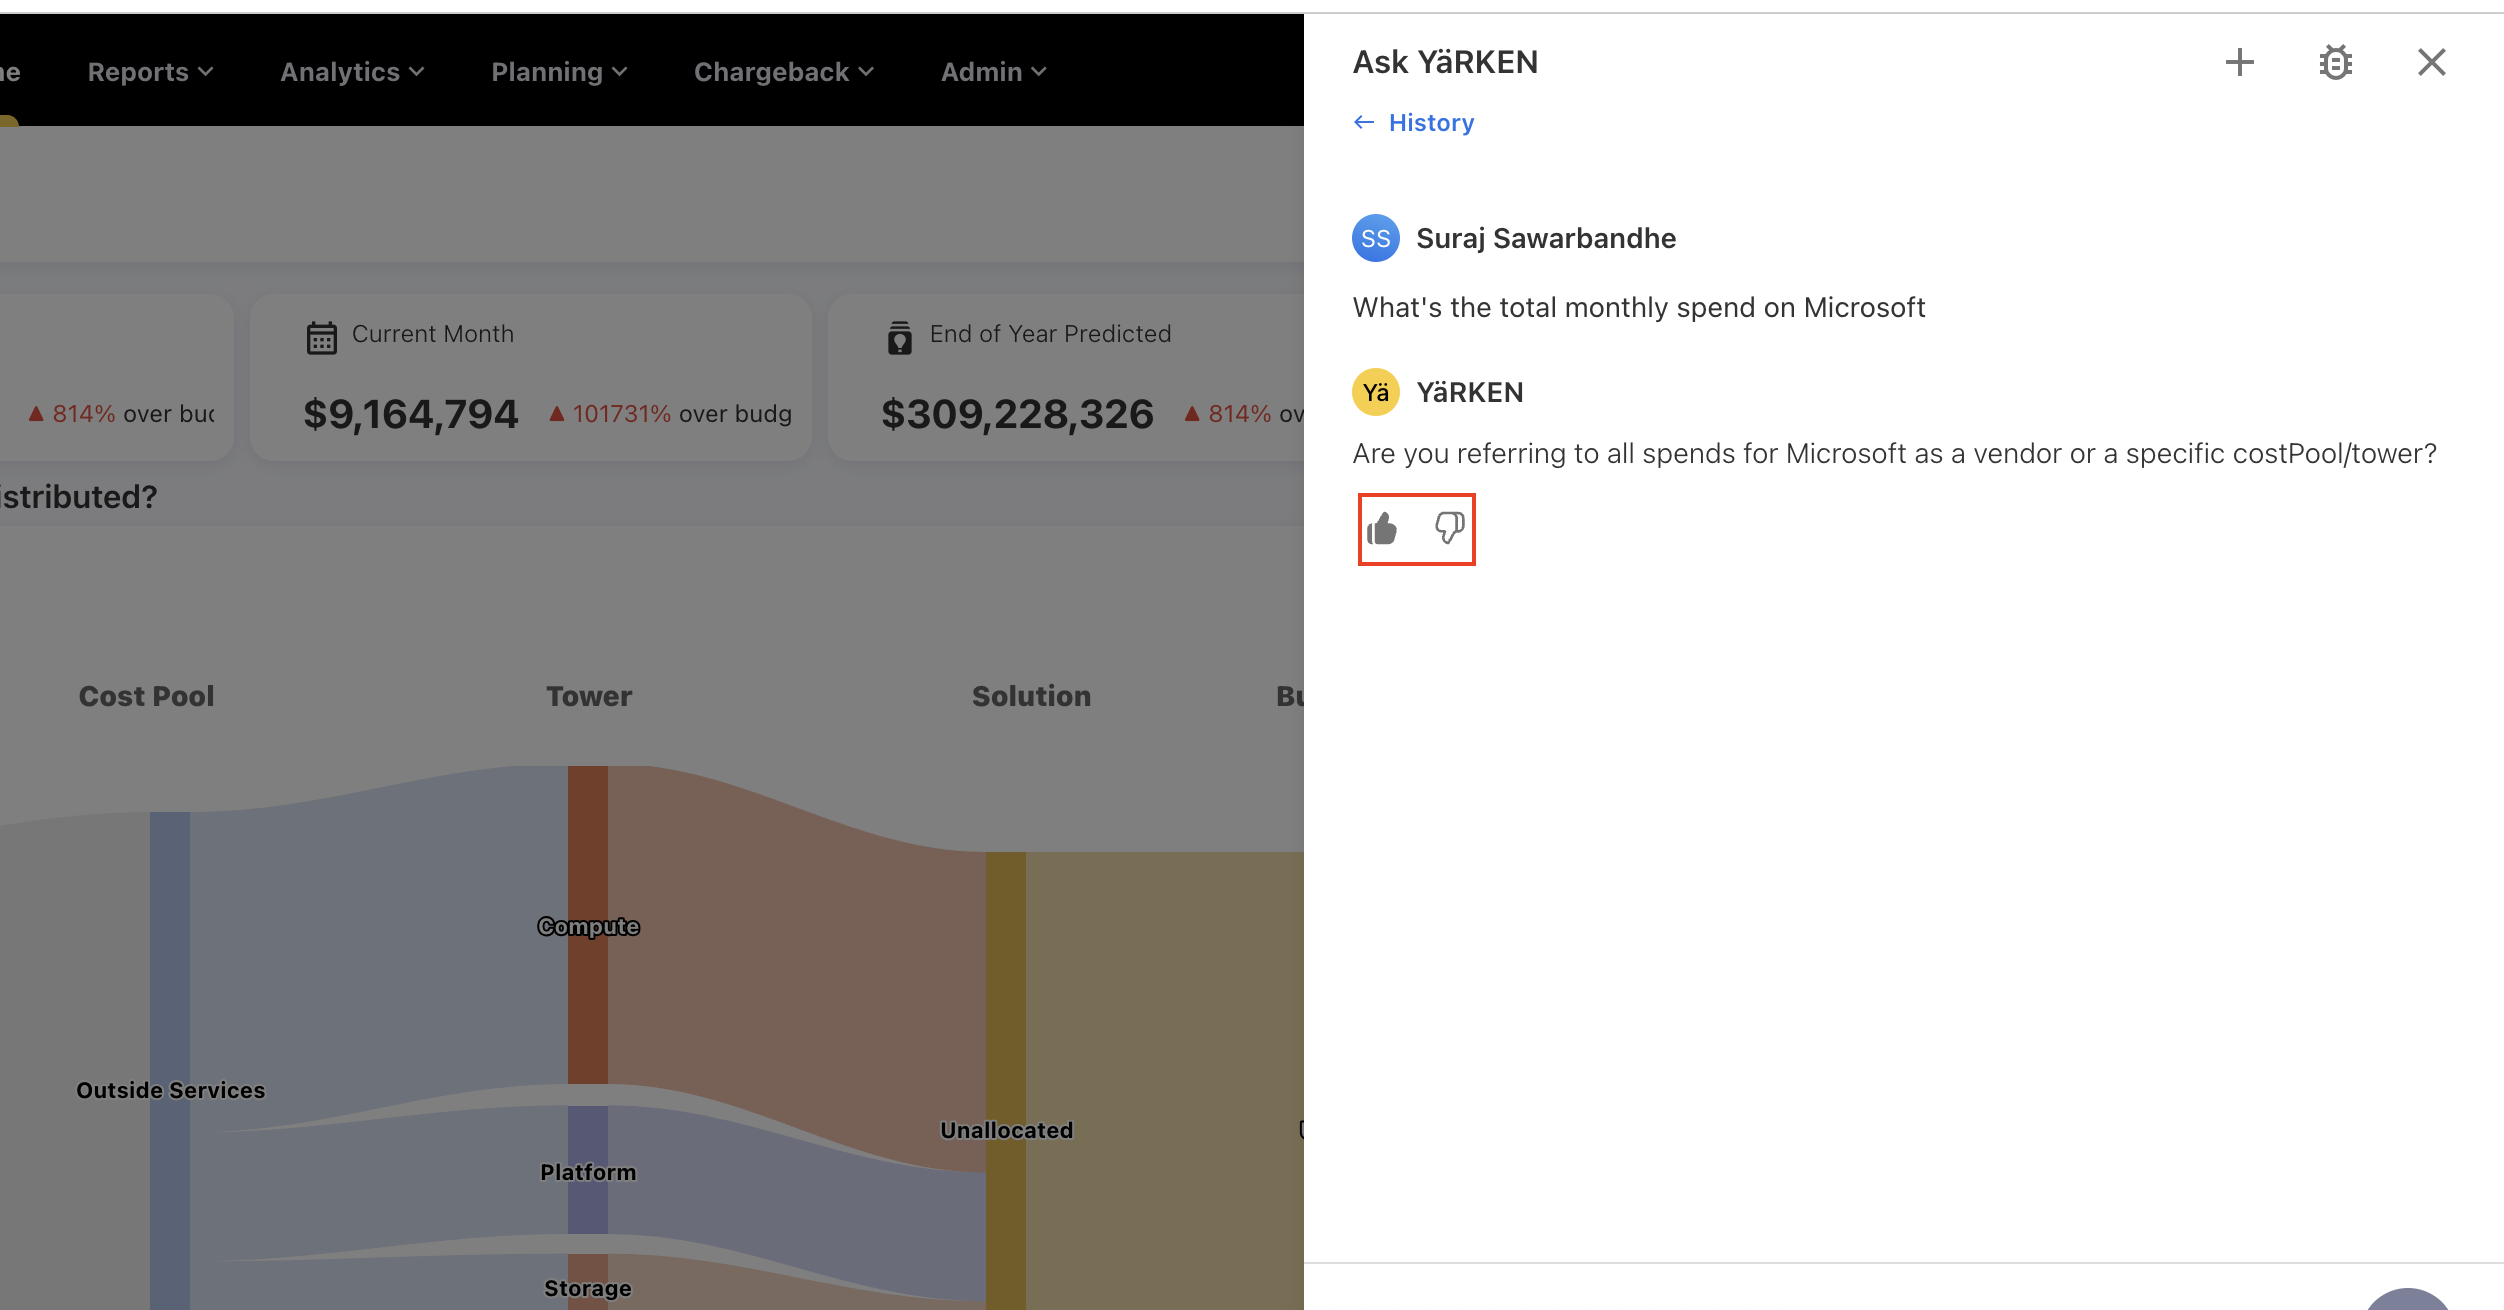
Ask YäRKEN Feedback on Responses
An interactive feedback feature has been introduced for the Ask YäRKEN assistant. Users can now provide quick feedback on AI responses using thumbs up (good response) or thumbs down (bad response) icons.
Enhancements and bug fixes
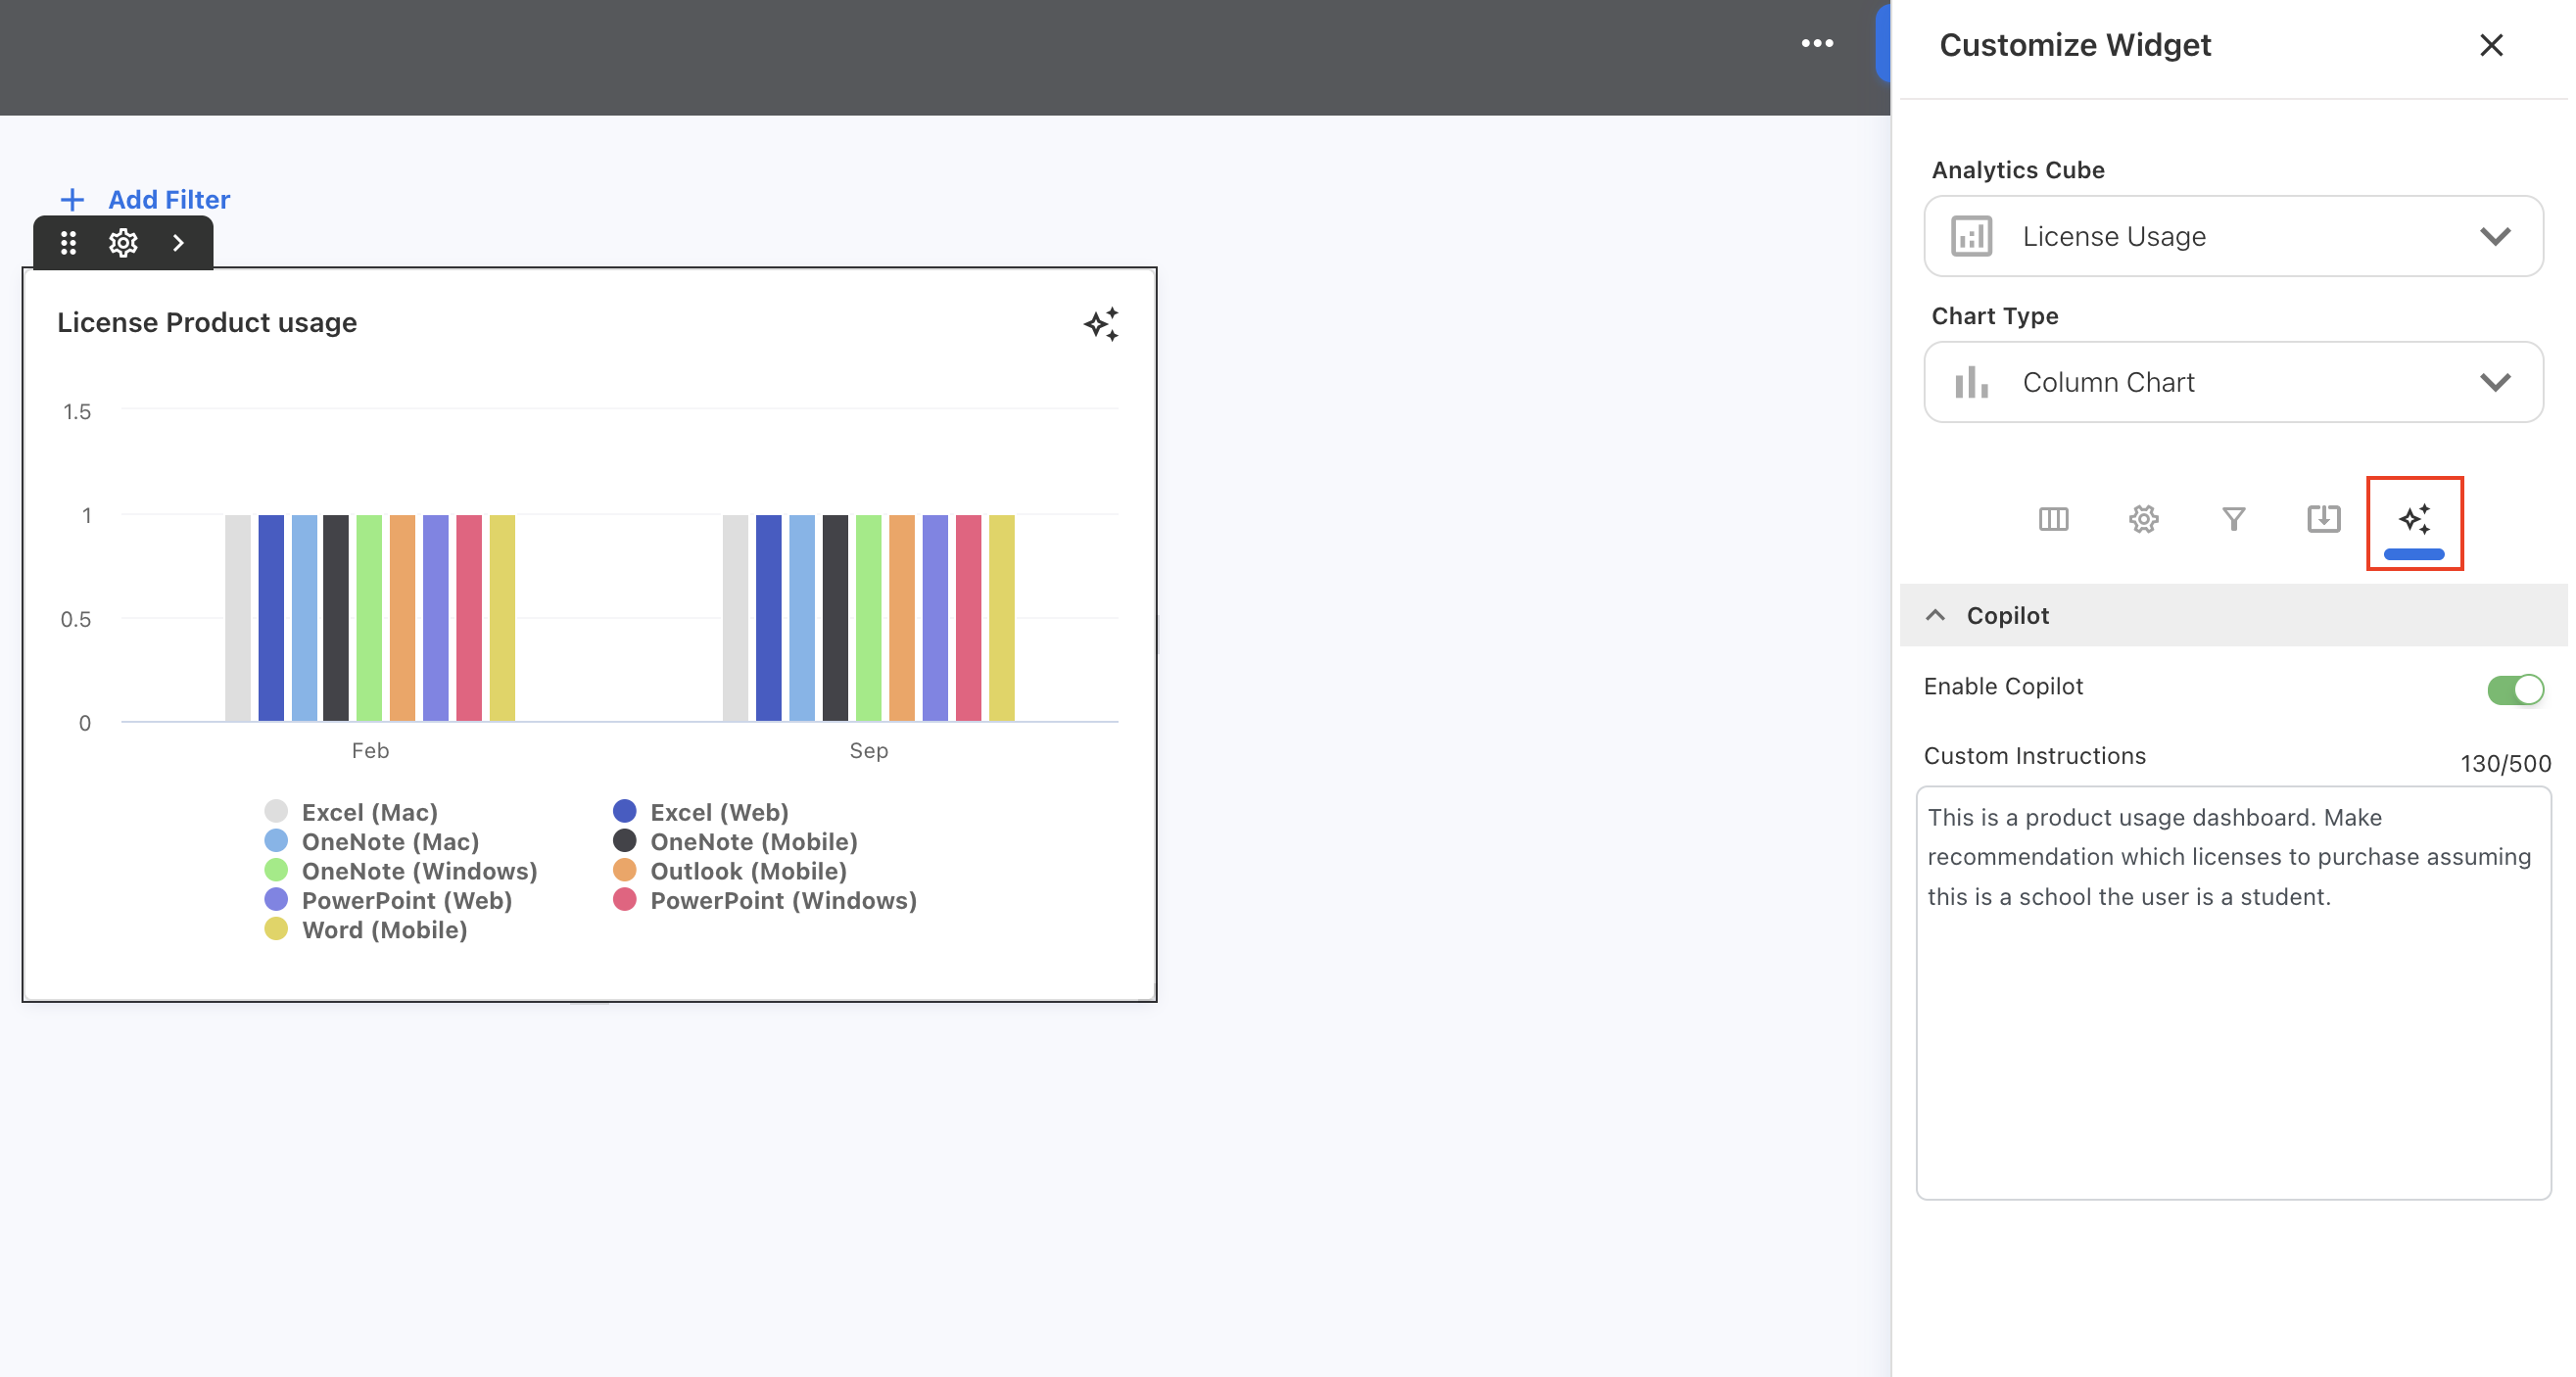
Ask YäRKEN on Custom Dashboard
An Ask YäRKEN Copilot capability is now available directly on the custom dashboards. Users can use the Ask YäRKEN icon on the charts to ask questions or get insights about the underlying data. The Copilot is supported in all chart types except Data Table, Pivot Table, Metric, and Sankey Chart and can be enabled or disabled. The supported chart type includes a copilot option (when customizing the widgets) where users can optionally specify a custom prompt tailored to that widget’s context, for example, guidance for interpreting the chart, suggested questions, or a focused data query.
If no custom prompt is provided at the widget level, the Copilot will consider the global prompt set in the application settings.
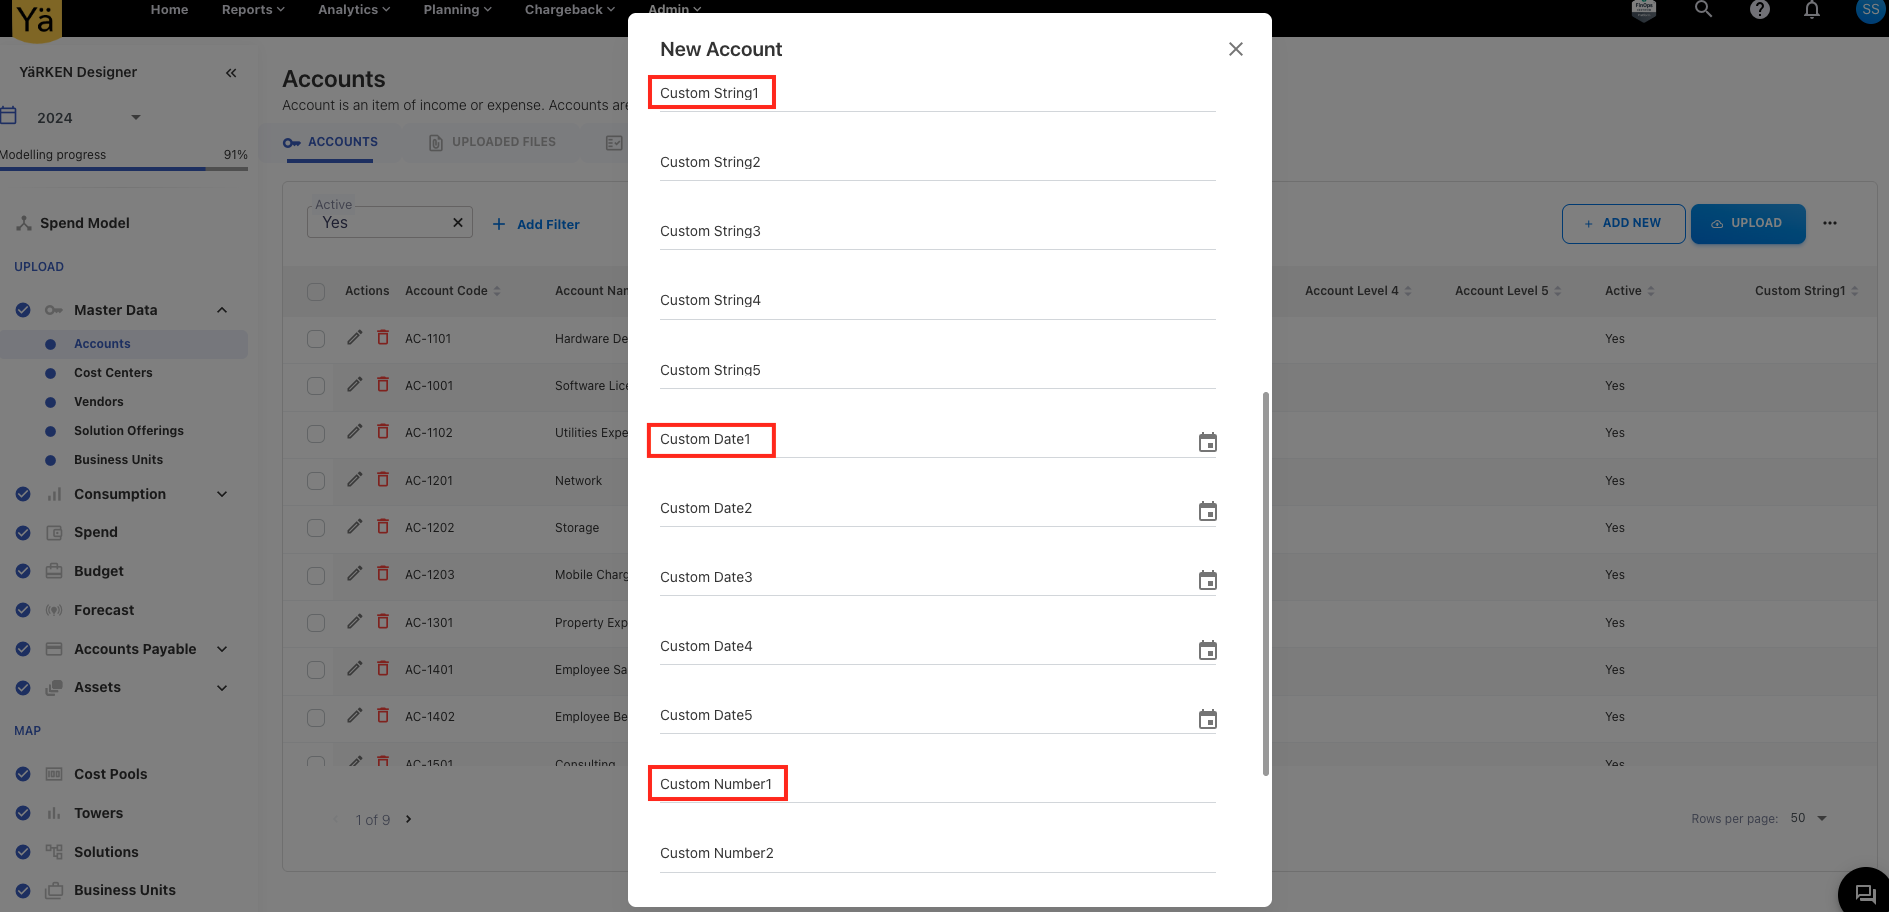
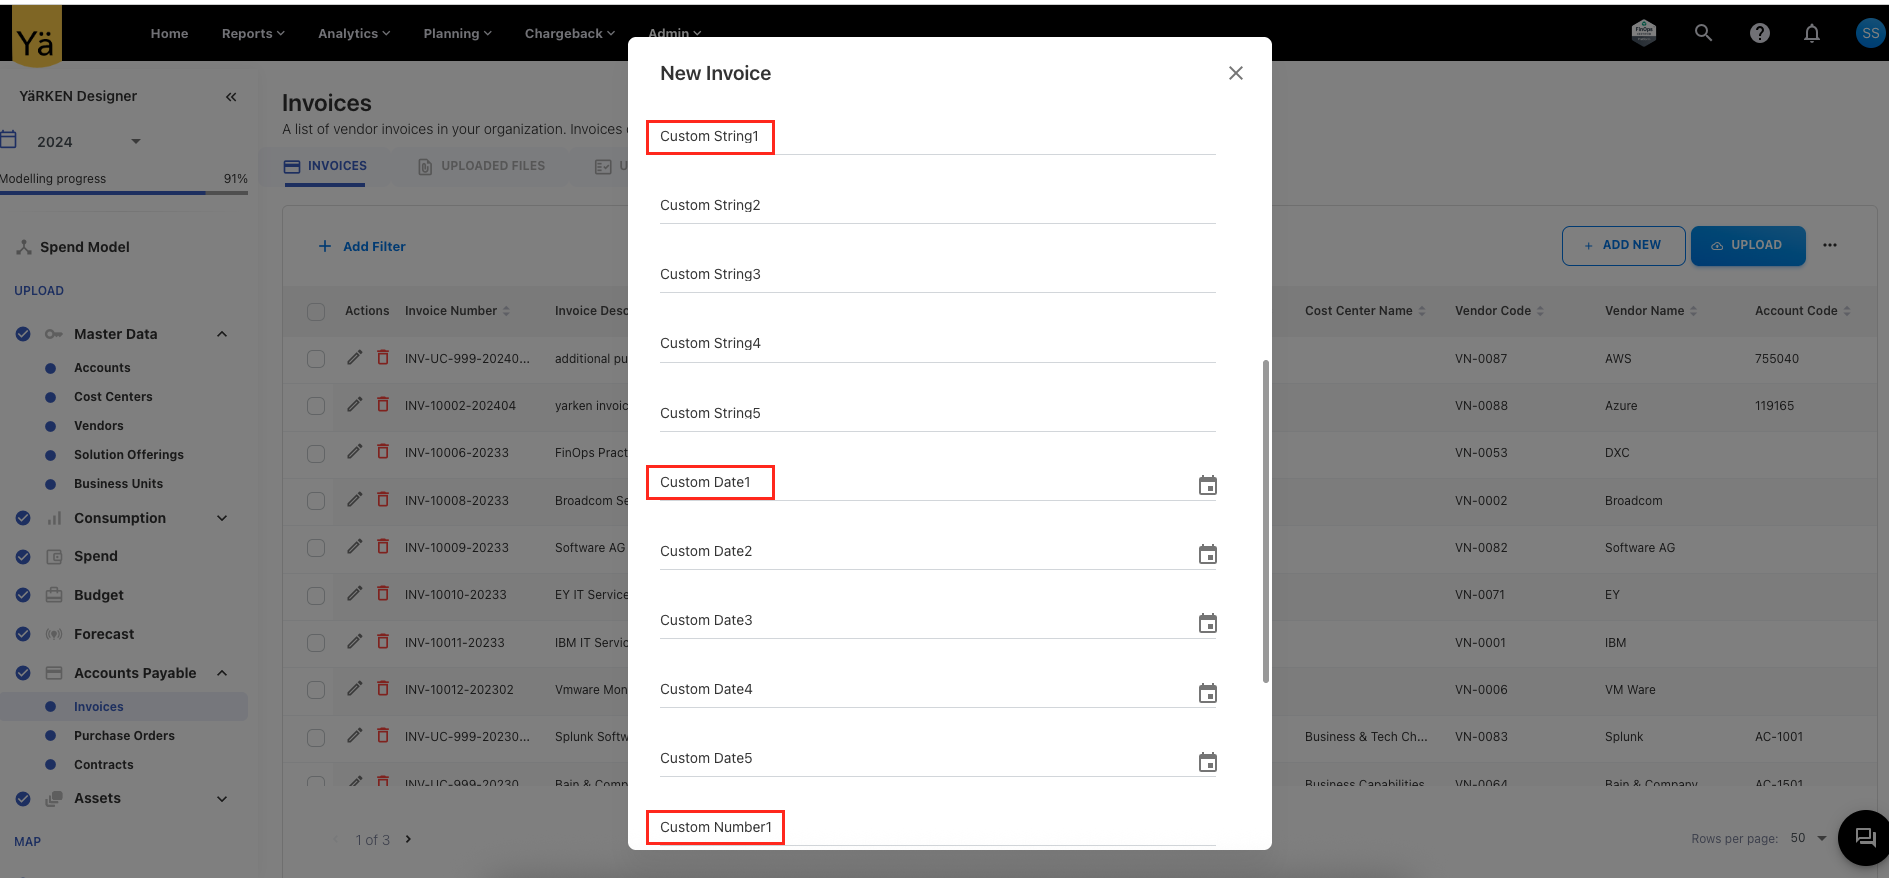
Custom Fields in Master Data and Account Payables
Following custom fields are added in the Master Data and Account Payables:
-
Custom String 1 to 5
-
Custom Number 1 to 5
-
Custom Date 1 to 2
Currently, these fields are only used for upload rules and not intended for reporting in Analytics and Custom Dashboards. However, they can be added after evaluating the performance.
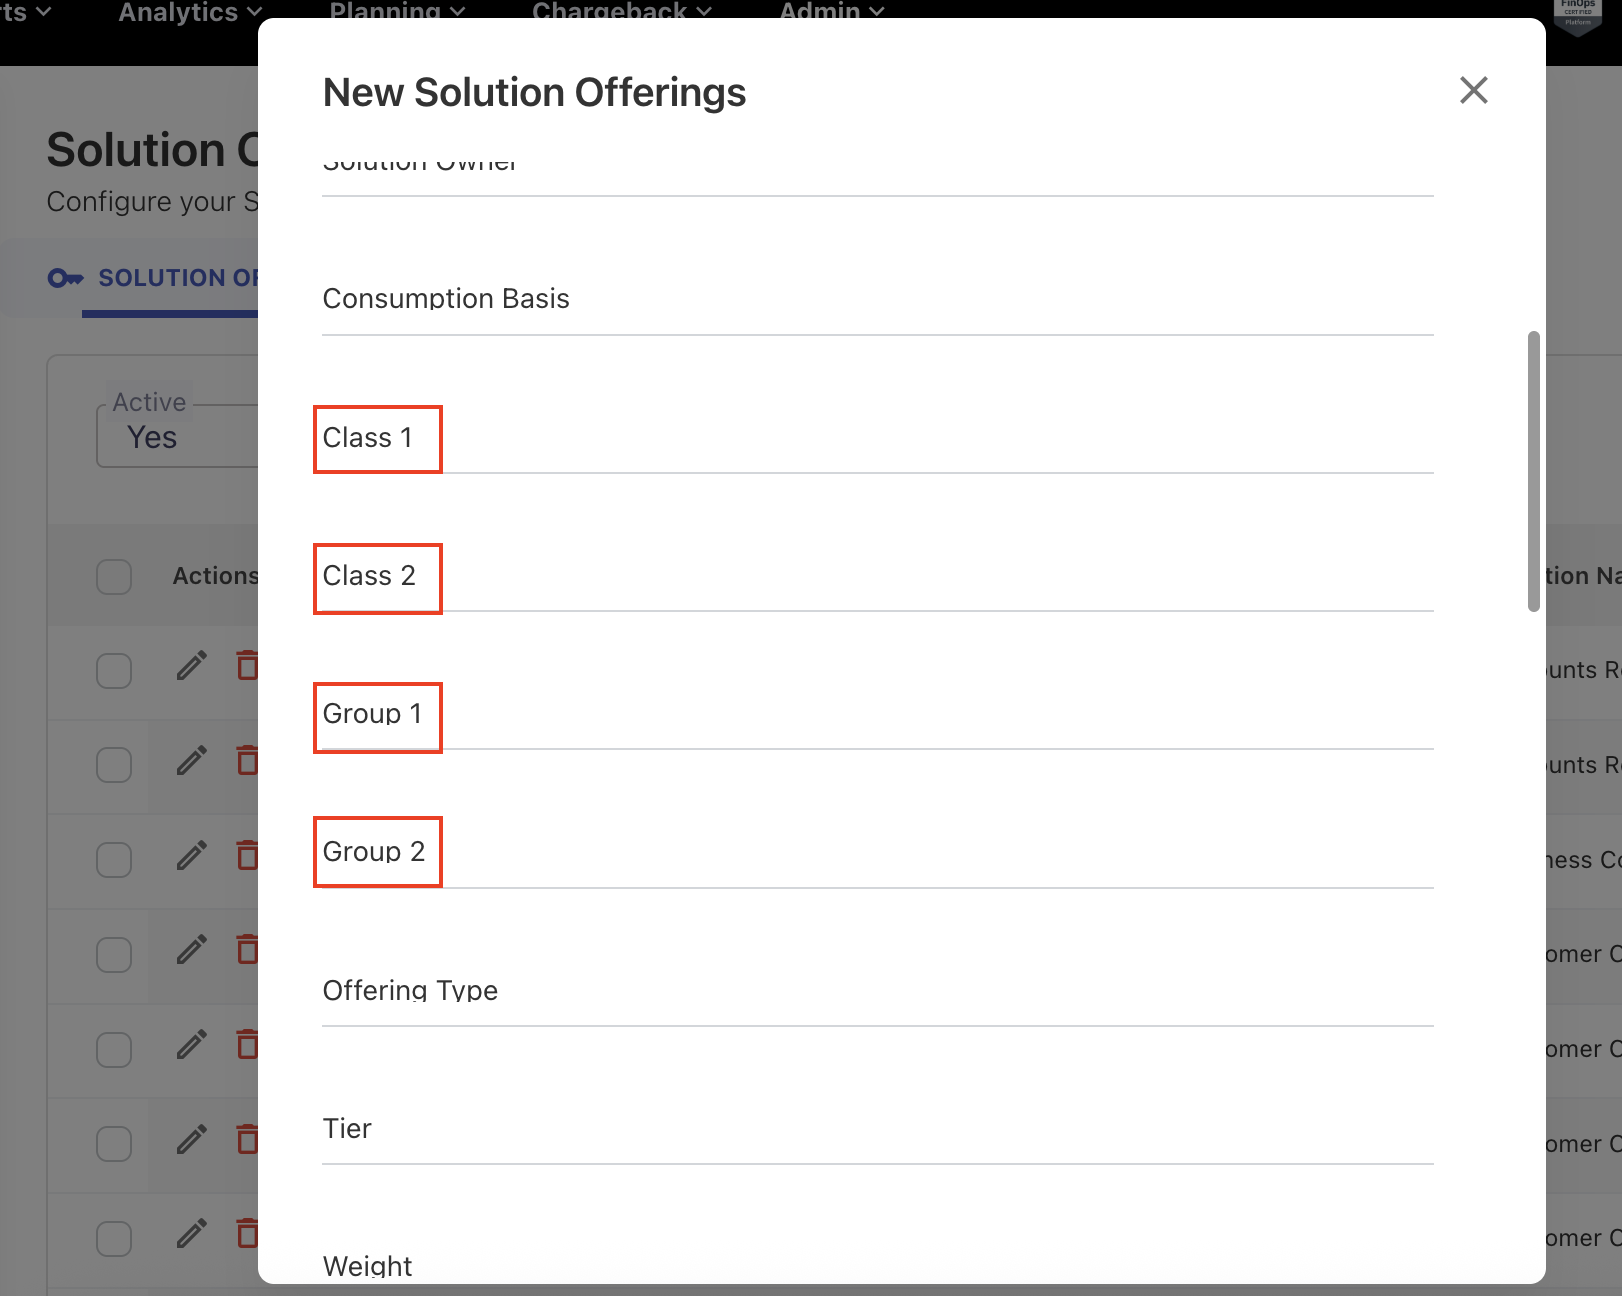
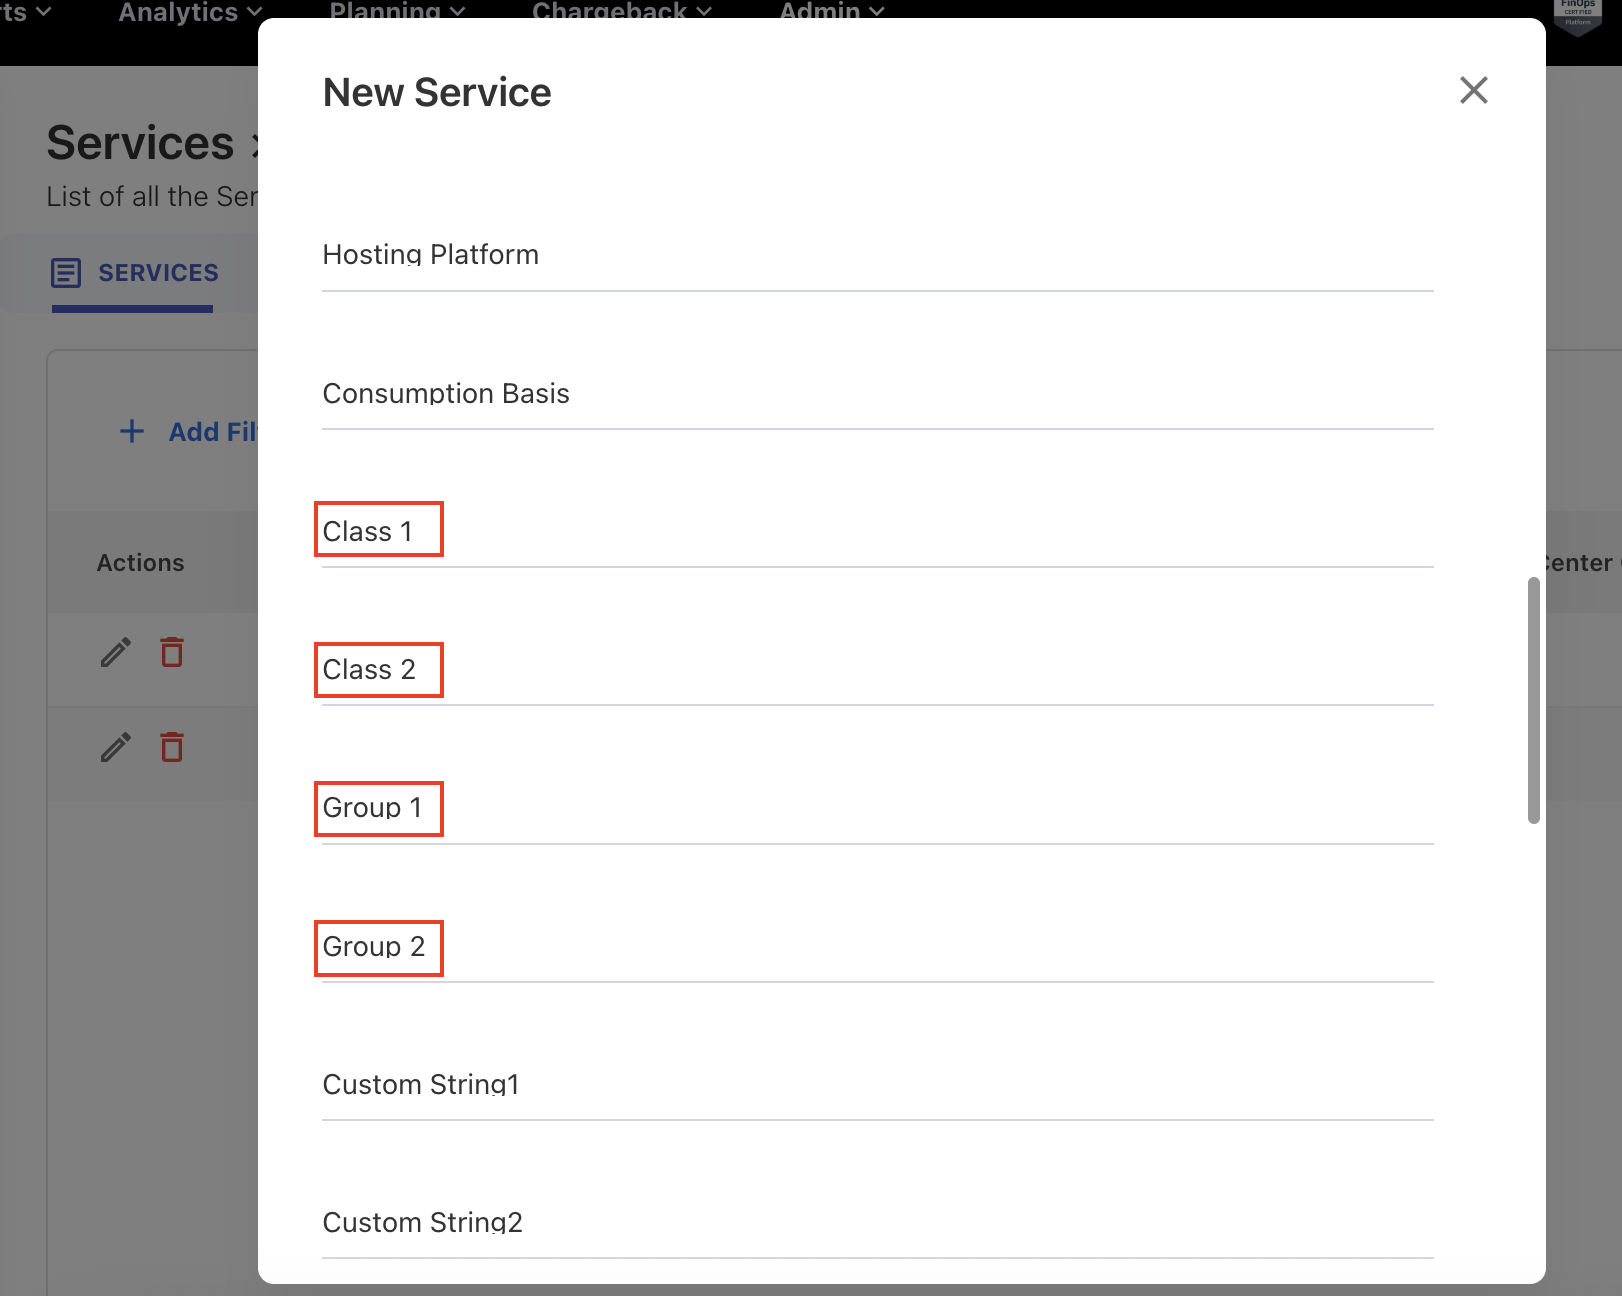
Additional Columns in Solution Offerings and Services Asset
The Solution Offerings and Services asset type now includes new columns to enhance data classification and grouping within the application:
-
Class 1
-
Class 2
-
Group 1
-
Group 2
Fix for Cloud Spend Inconsistency between Analytics and Resource Report
The monthly cloud spend amount on individual resources was inconsistent between Analytics and the resource report. An issue was encountered in the monthly spend because the resource IDs were segregating the cube's data, and the amount was not aggregating within that month.
Budget Reloads and Variance Issue
When reloading the budgets, the budget amount was doubled up because the existing records were not deleted. This issue is handled and the amount does not duplicates for both Reload, Remap and Reload functionality.
September 29, 2025
Enhancements
Support for Multiple Authentication Providers
To enable users to log in using their organization’s preferred identity provider, the application now supports multiple authentication providers. Currently, Okta authentication is enabled in addition to the Microsoft Entra ID (Azure AD).
At the login screen, users can select their desired provider and authenticate with multi-factor authentication (MFA) methods. This provides a smoother onboarding experience for organizations that use different identity platforms across their environments.
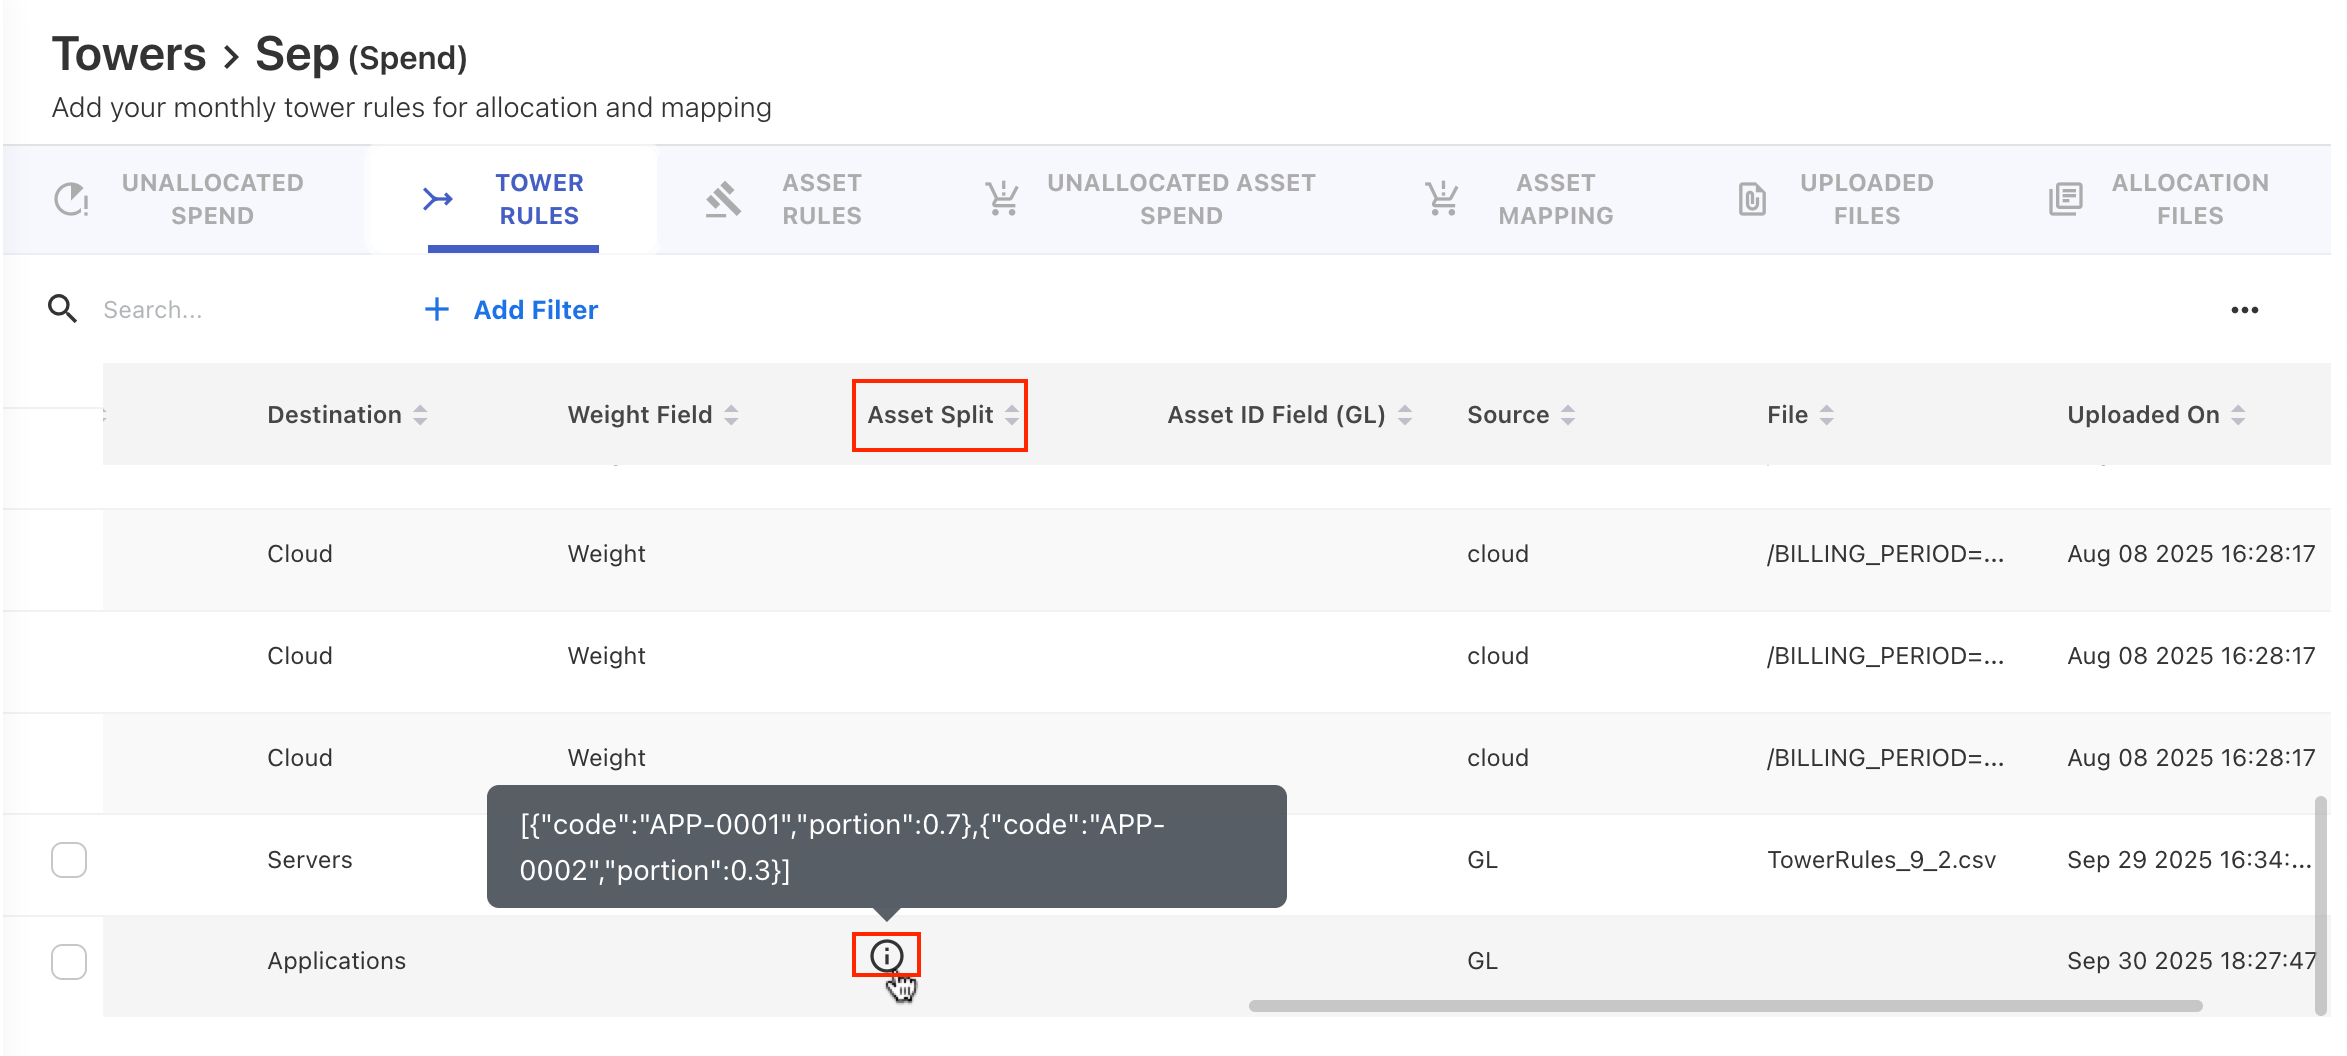
Enhanced Tower Rules – Distribution to Assets by Percentage
We have enhanced the tower rules creation process to support percentage distribution to multiple assets. As part of tower rule creation, user can allocate tower spend directly to assets by specifying the percentage of split at the asset level. This improvement enables users to allocate tower spend more flexibly at the asset level by directly assigning percentage.
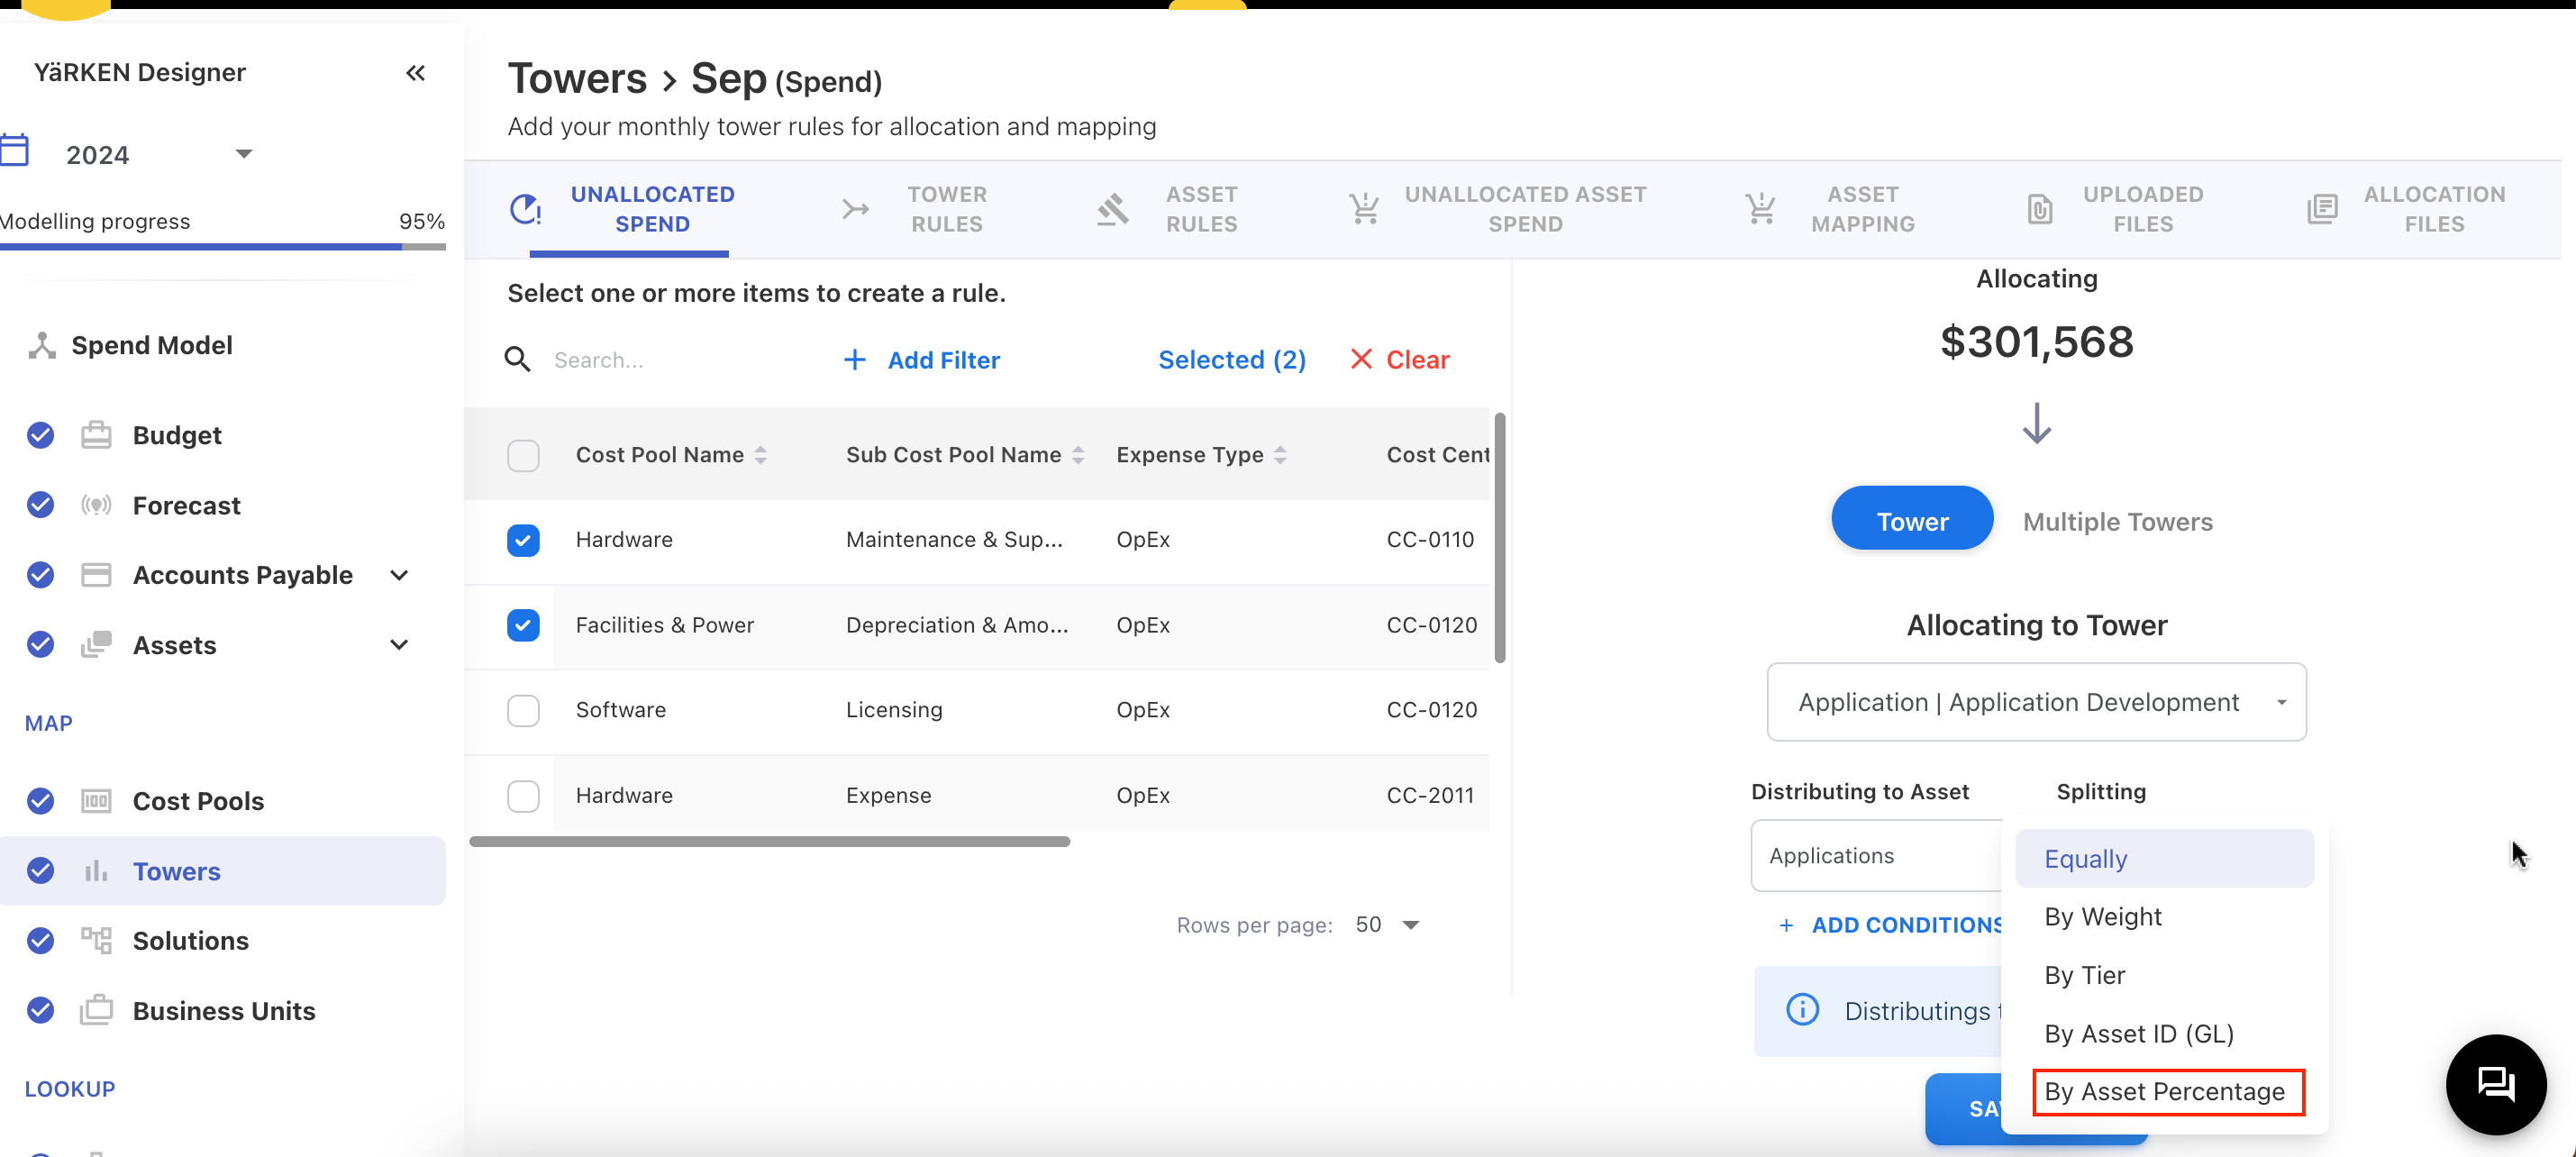
A new option, “By Asset Percentage,” has been added for distributing tower spend to multiple assets within a single asset type. After choosing this option, users can select one or more assets (within the same asset type) and define the percentage against each of the assets. For example, when distributing tower spend to Application asset type, the user can select multiple assets from the same asset types, such as APP 01, APP 02, and so on, and specify the percentage of each.
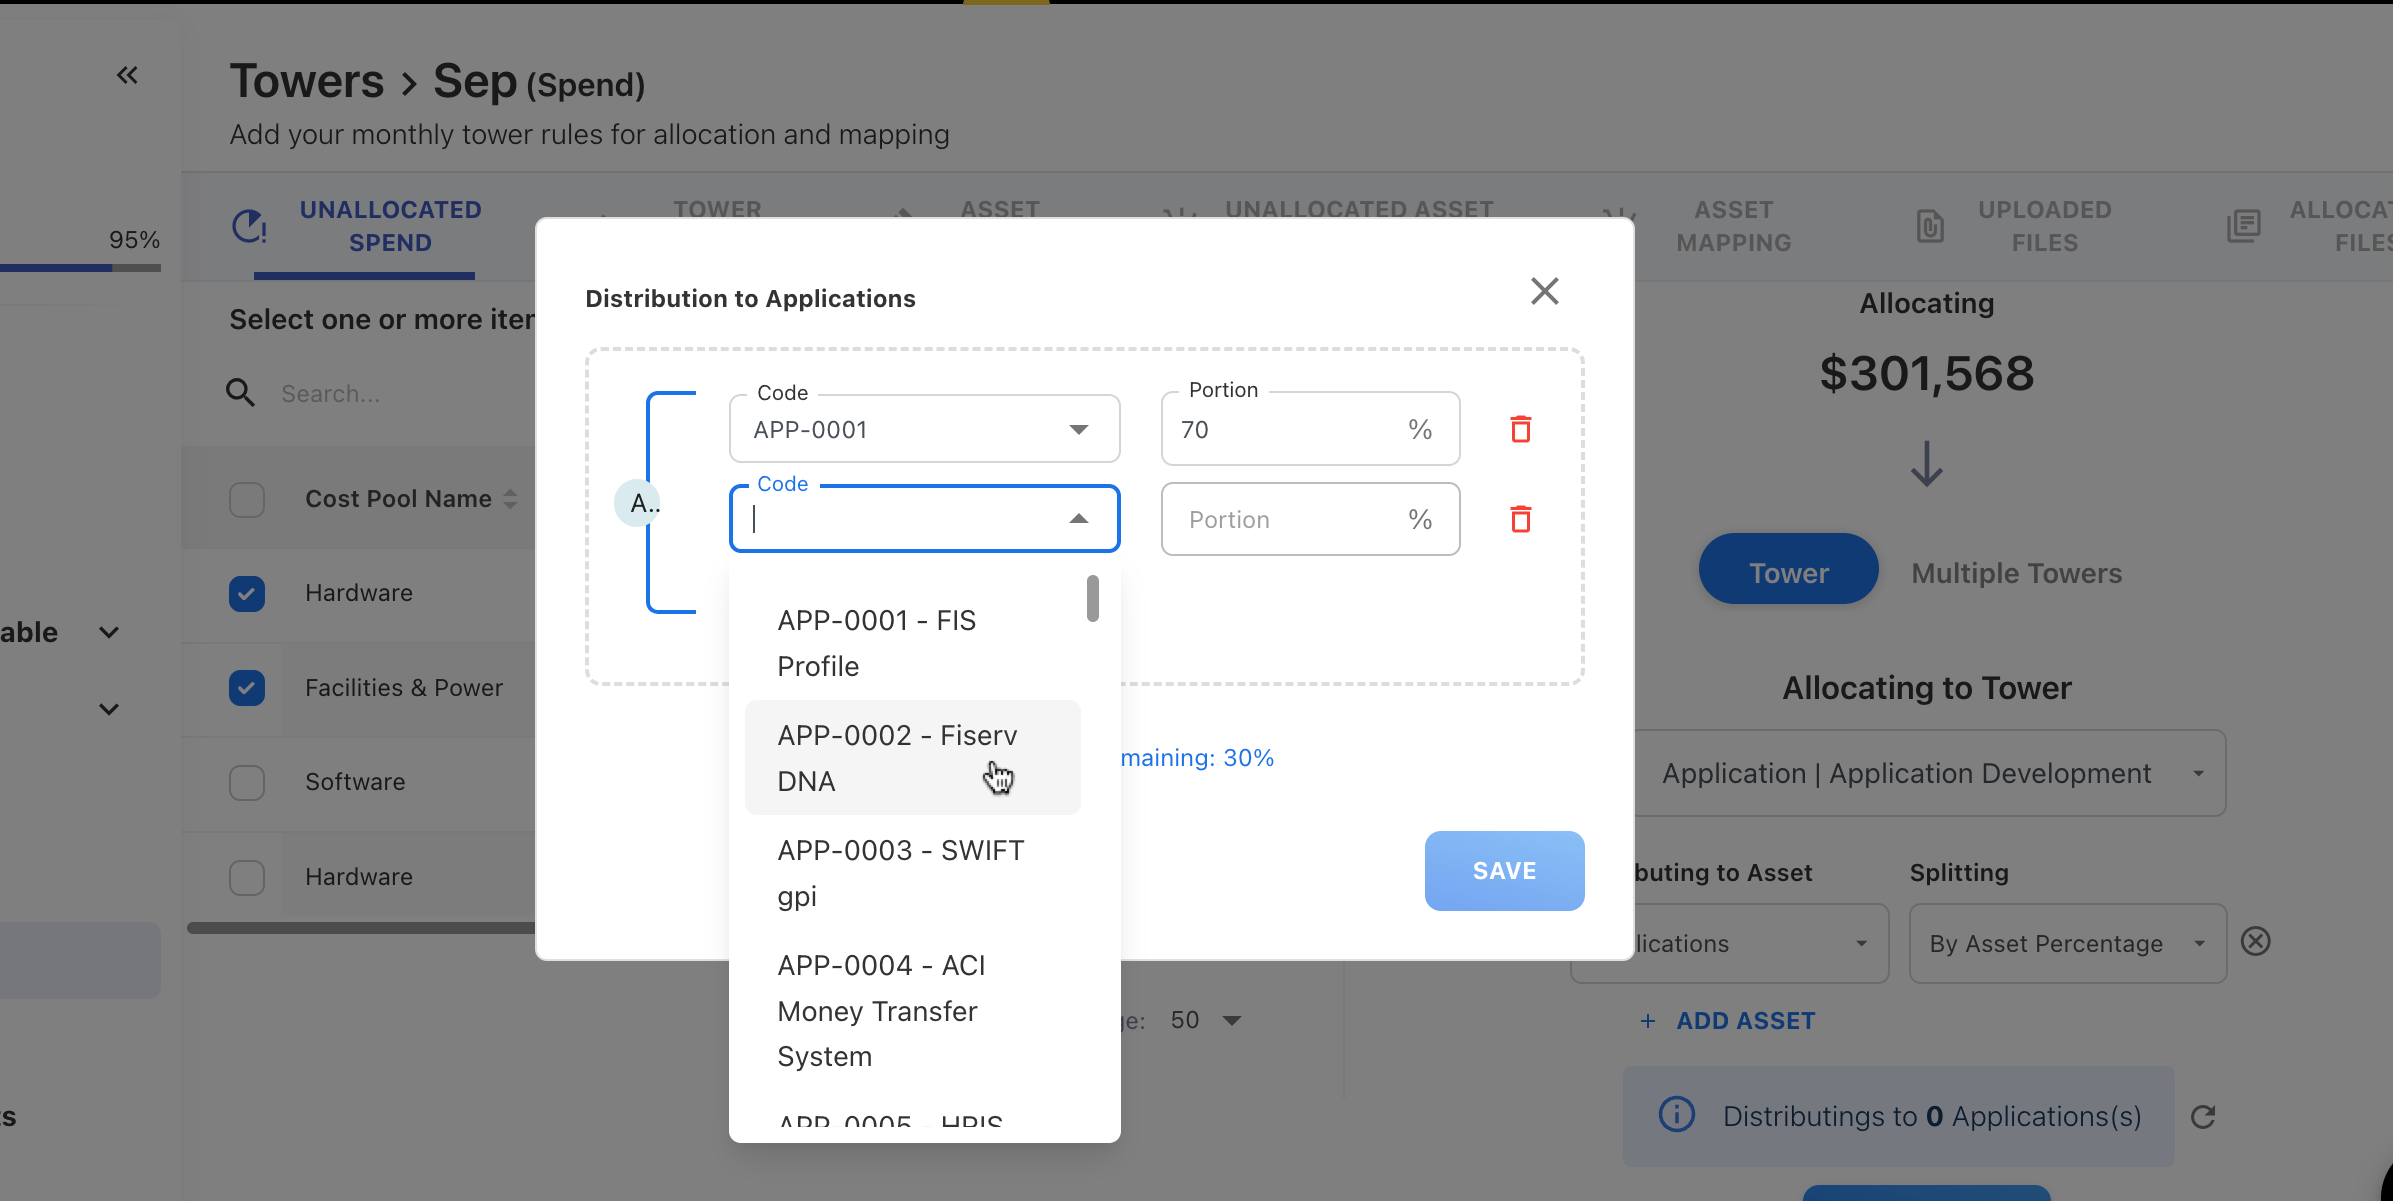
This new option also ensures that the allocation rule saves after the spend has been fully allocated (100%). To check the asset percentage distribution, the Asset Split column is added under the TOWER RULES tab.
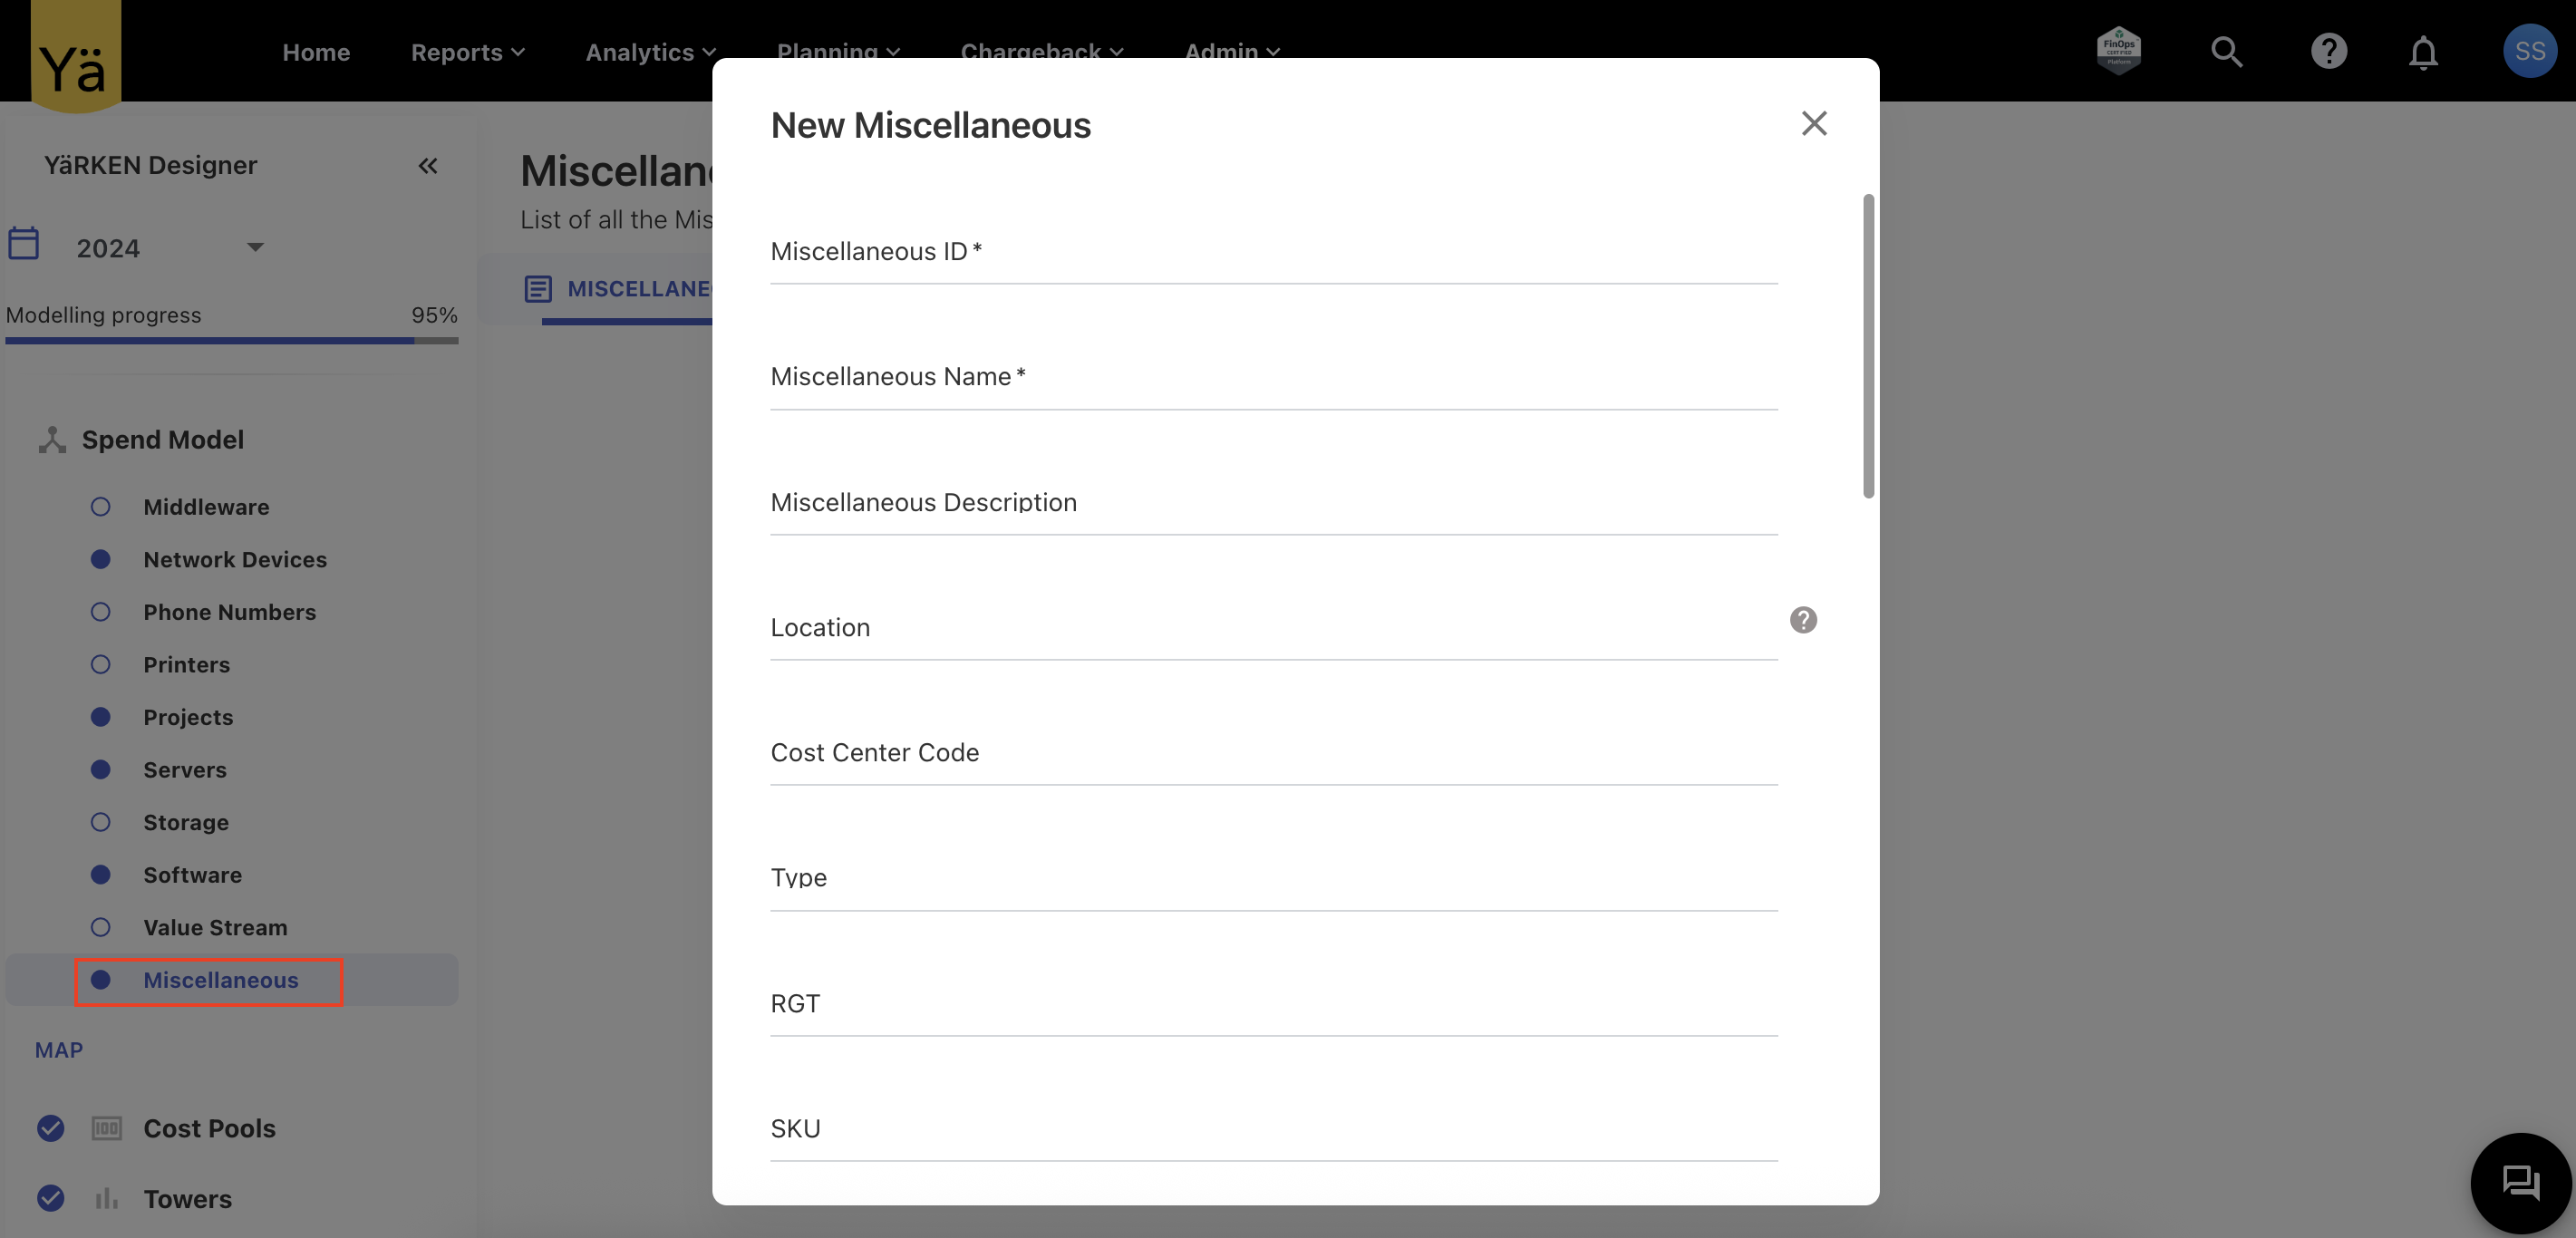
New Generic Asset Type – Miscellaneous
A new asset type called Miscellaneous has been introduced to support more generic asset loading scenarios. This asset type can be used to load any asset data that does not fit into existing asset categories. With this new asset type, the app now provides greater flexibility in managing and mapping diverse assets without needing to create another asset type.
September 22, 2025
Enhancements and bug fixes
Integration of AG Grid in Budget and Forecasting
We’ve added AG grid into the planning and forecasting module to provide a faster, flexible, and adaptive table experience. This upgrade delivers more interactive experience when working with large datasets in budget and forecast. The new AG grid adds the customizations along with advanced table features such as column resizing, sorting, filtering, grouping, and data export.
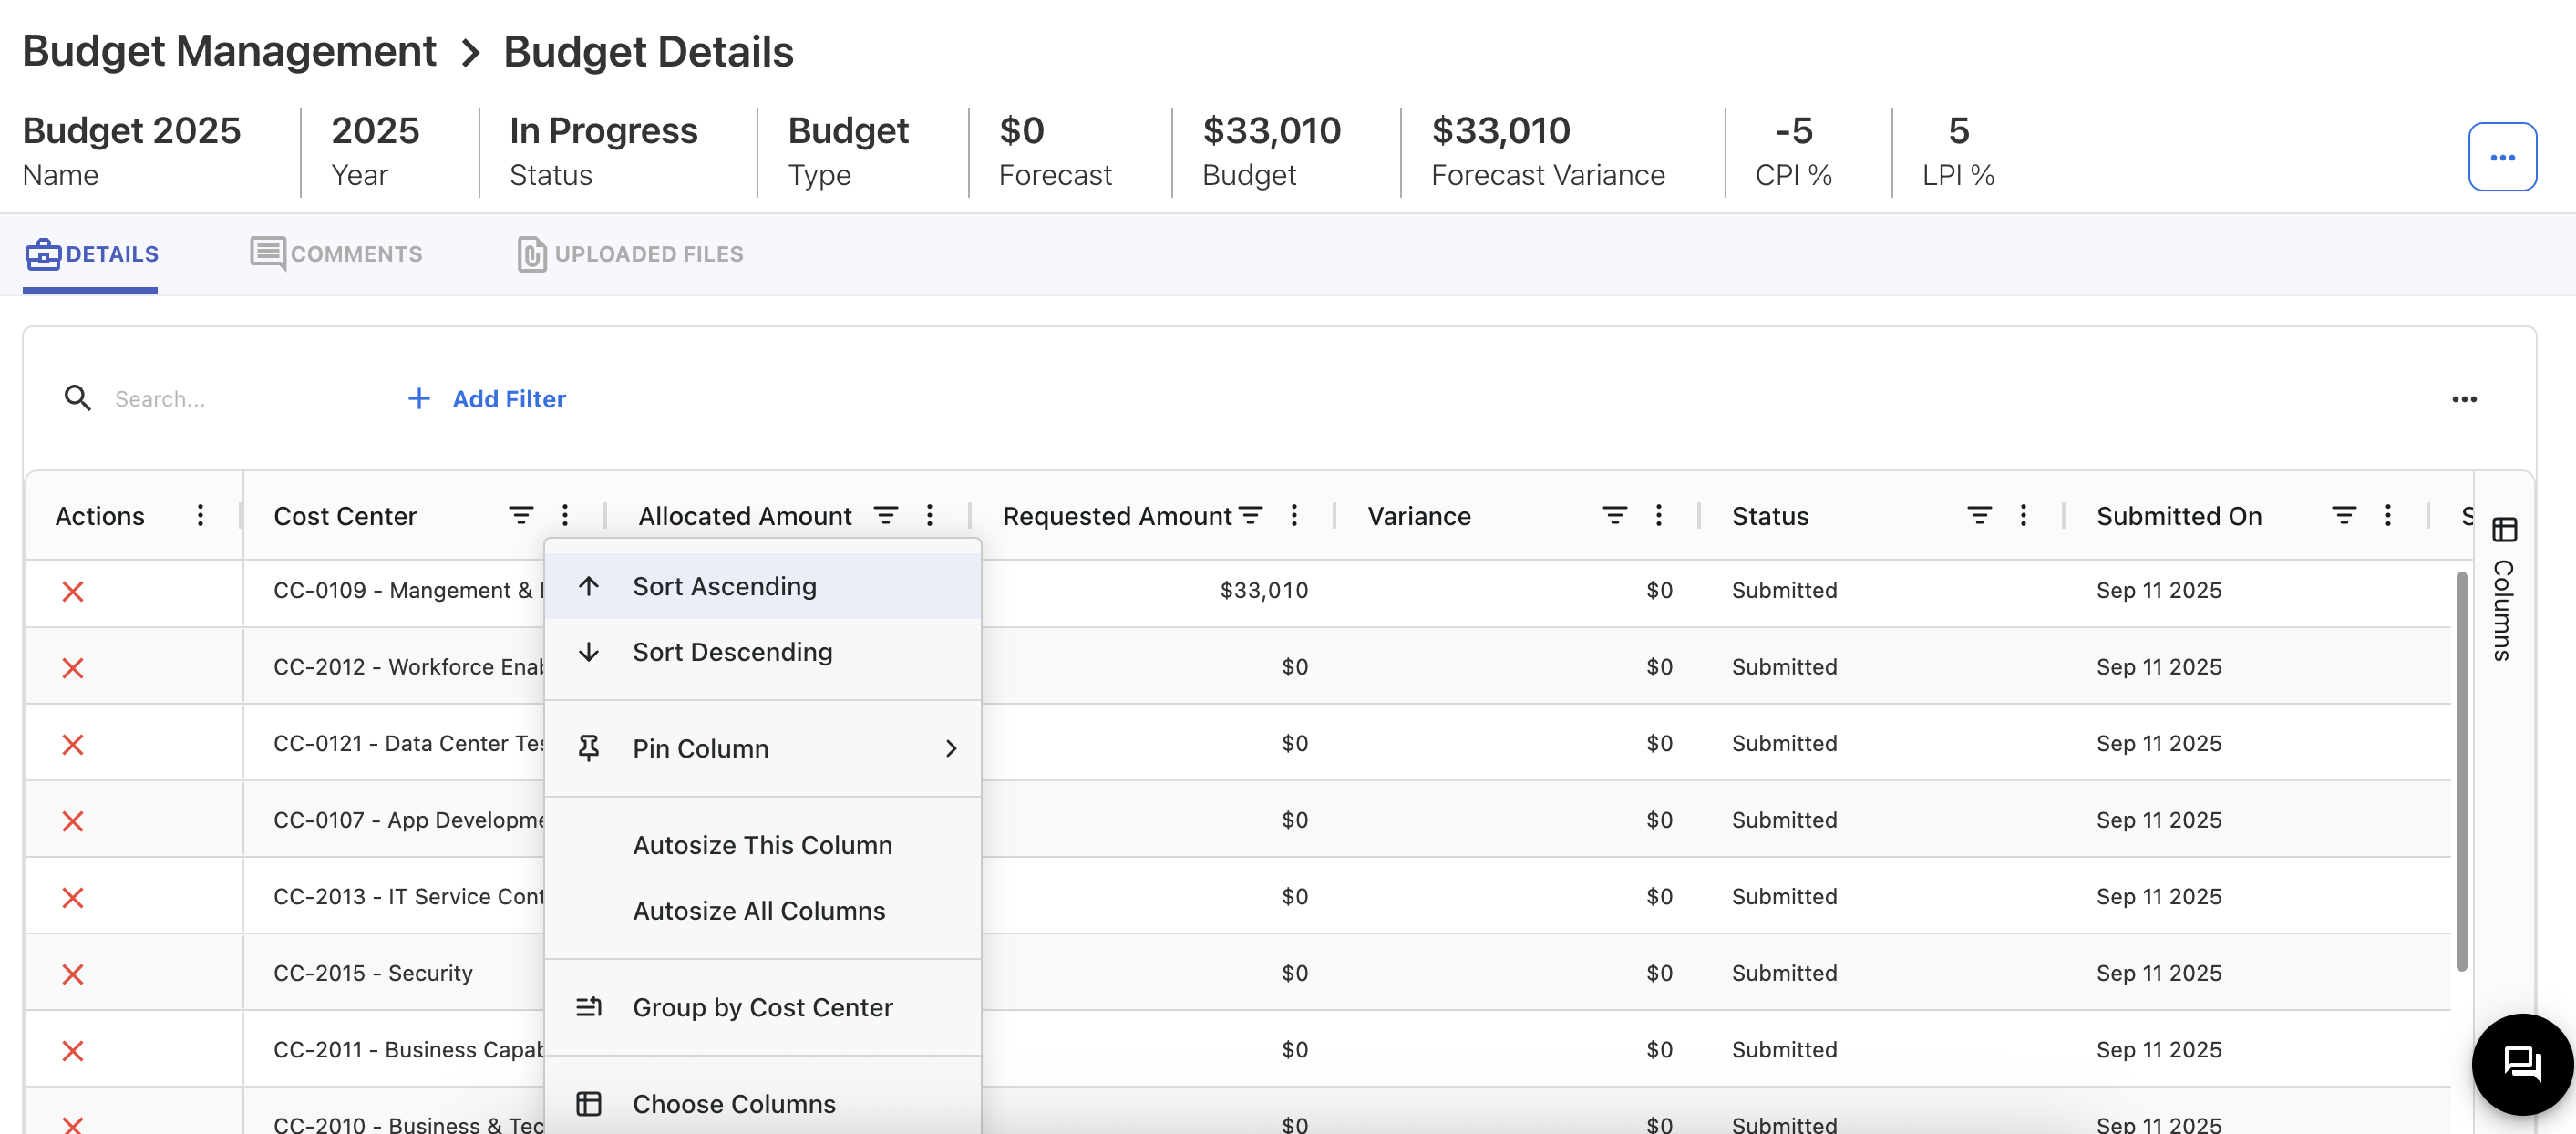
In addition, users can now customize their tables by adding or removing columns, as well as save and export their current configuration for reuse. This ensures that each user can tailor table views to their specific reporting and analysis needs.
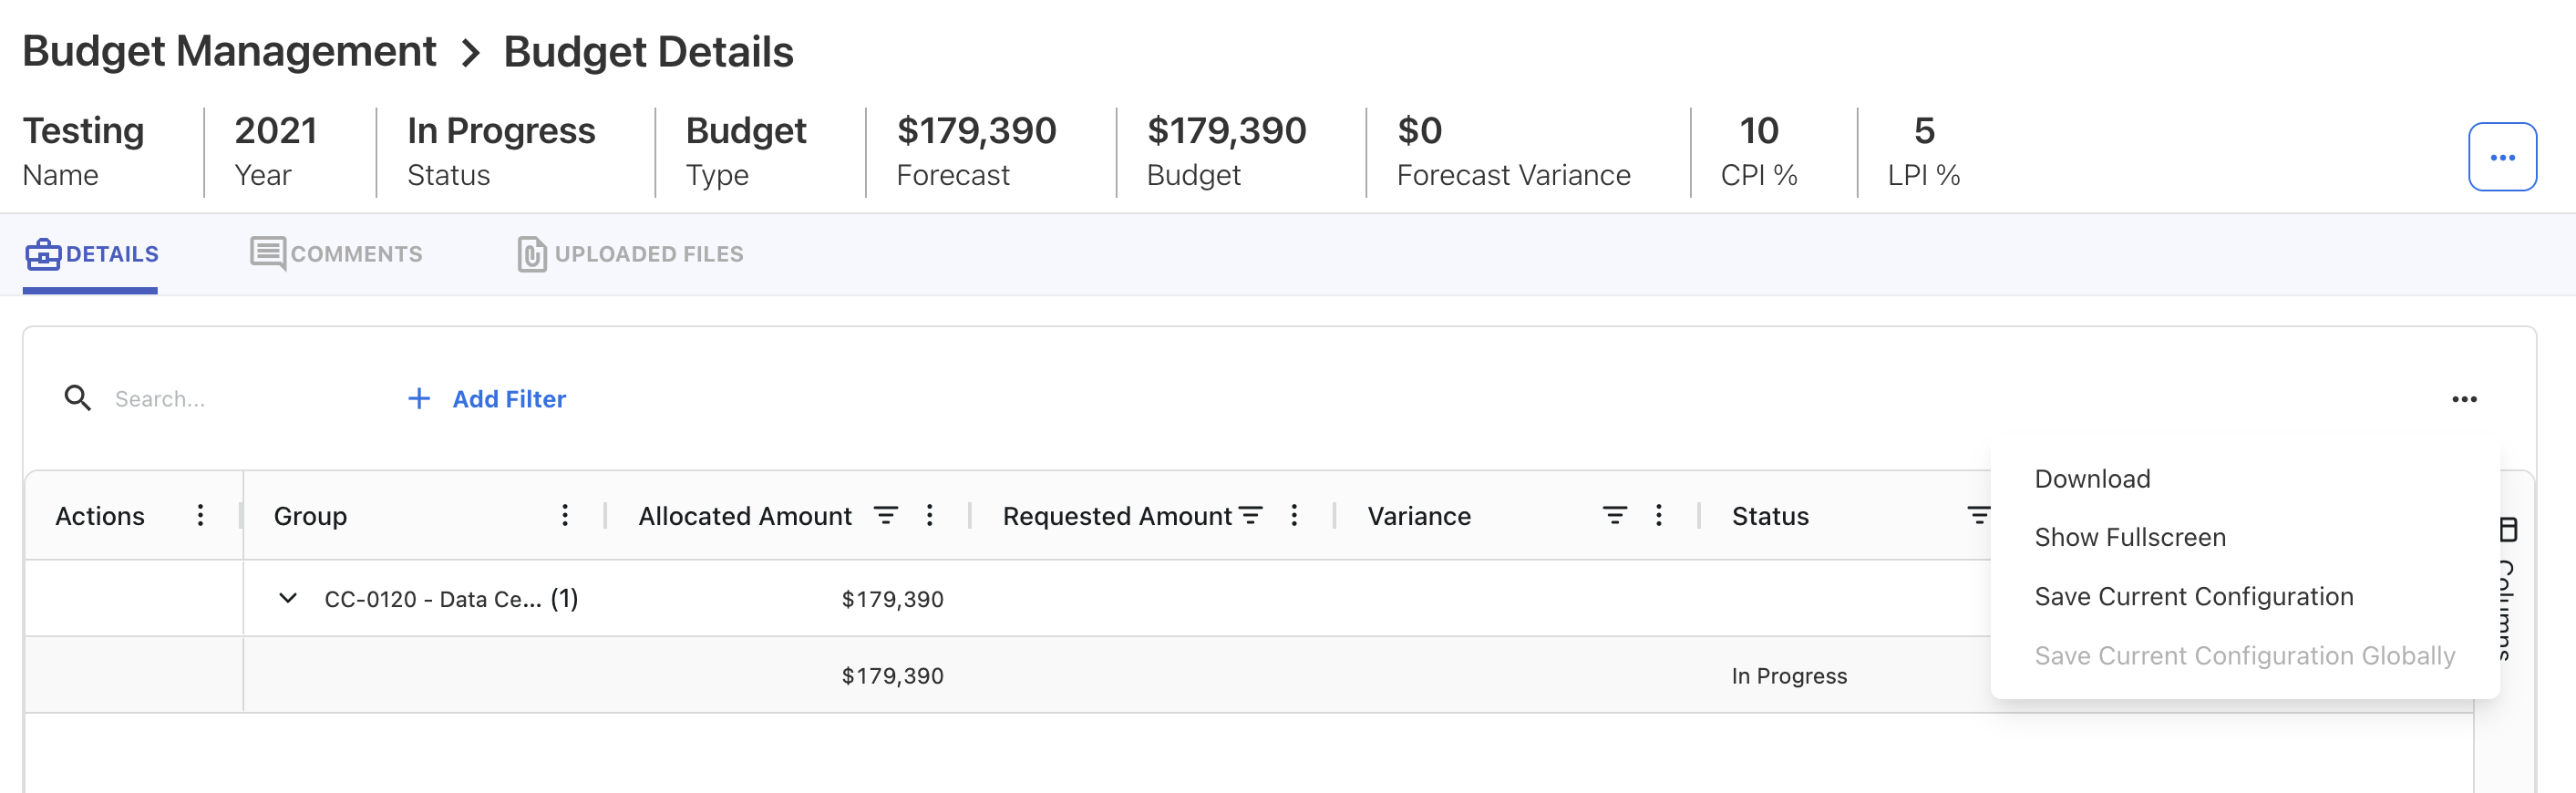
This integration delivers a more interactive and customizable experience in data-heavy screens, making it easier to analyze and manage information.
Seeding Journal ID and Transaction Date
The Upload Rule functionality has been enhanced with two powerful new capabilities:
-
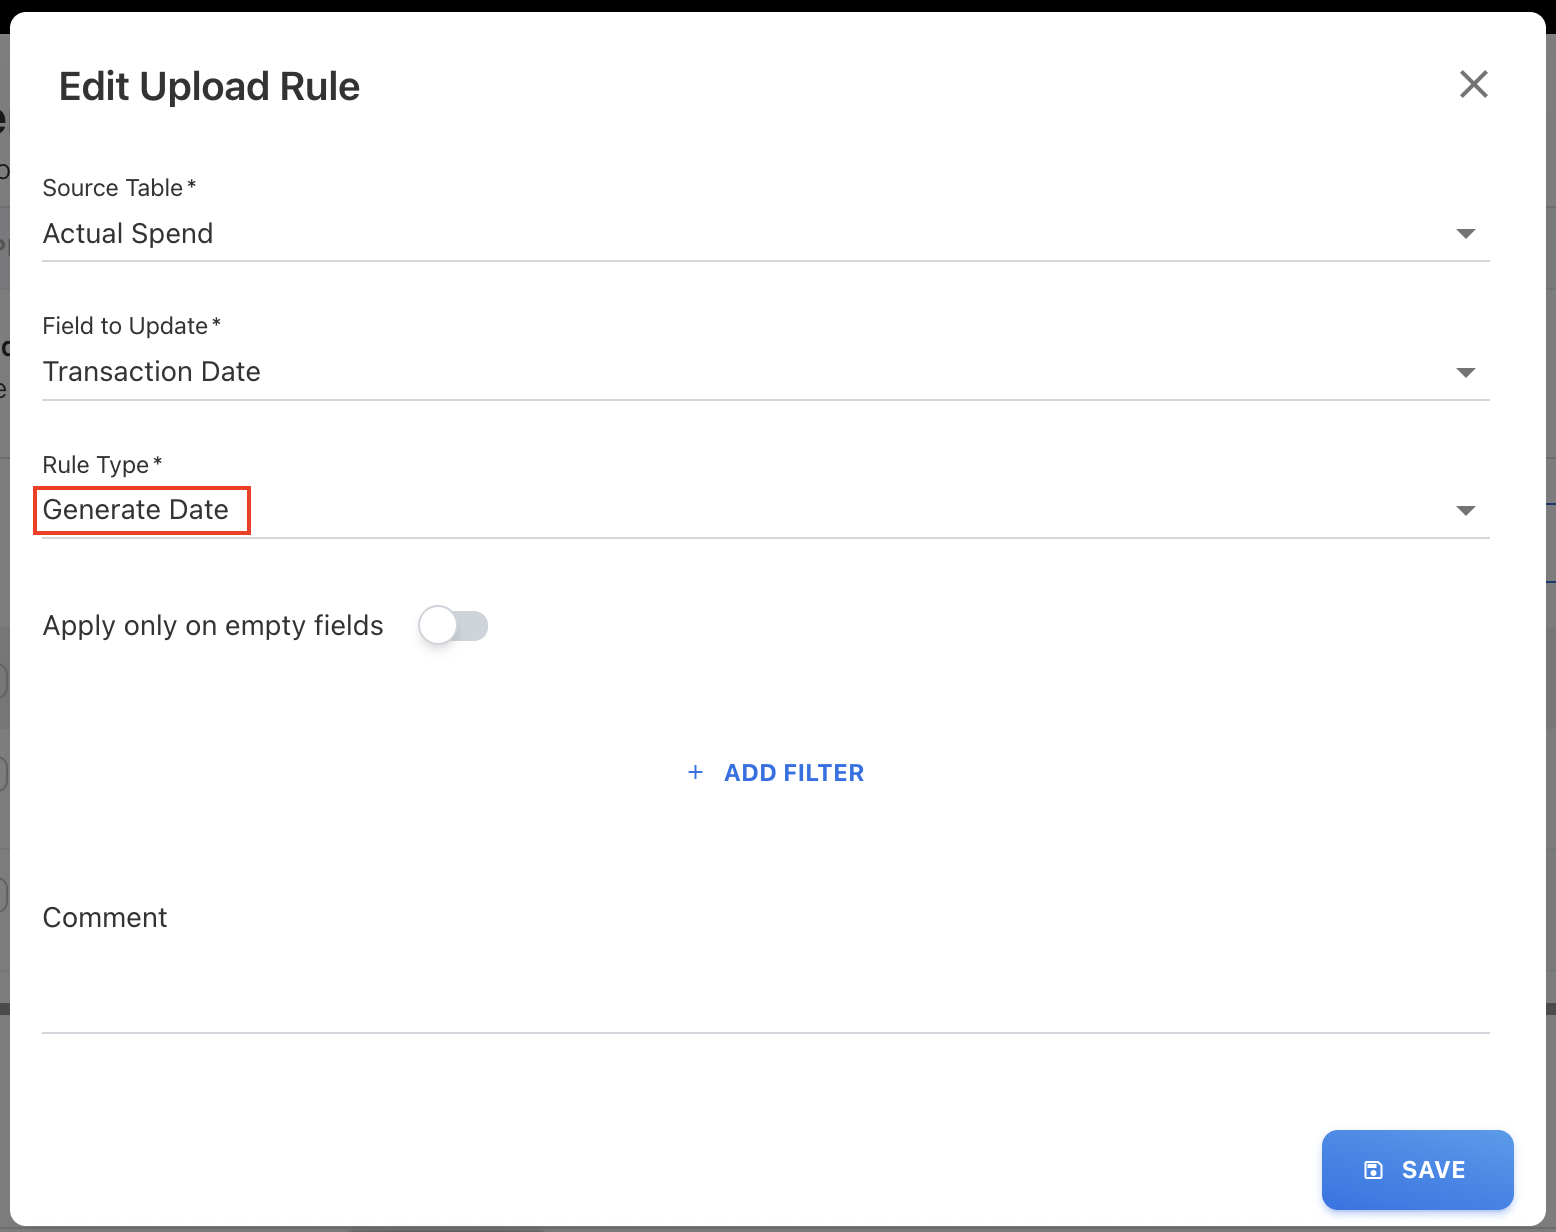
Generate Date Rule Type
A new rule type, Generate Date, has been introduced to automatically populate date fields during file uploads. When applied, this rule generates date entries in the format DD/MM/YYYY, where the day is always set to the 1st, and the month and year are derived from the file’s loaded month and year. This helps ensure consistency and reduces manual entry errors for date-based fields.
-
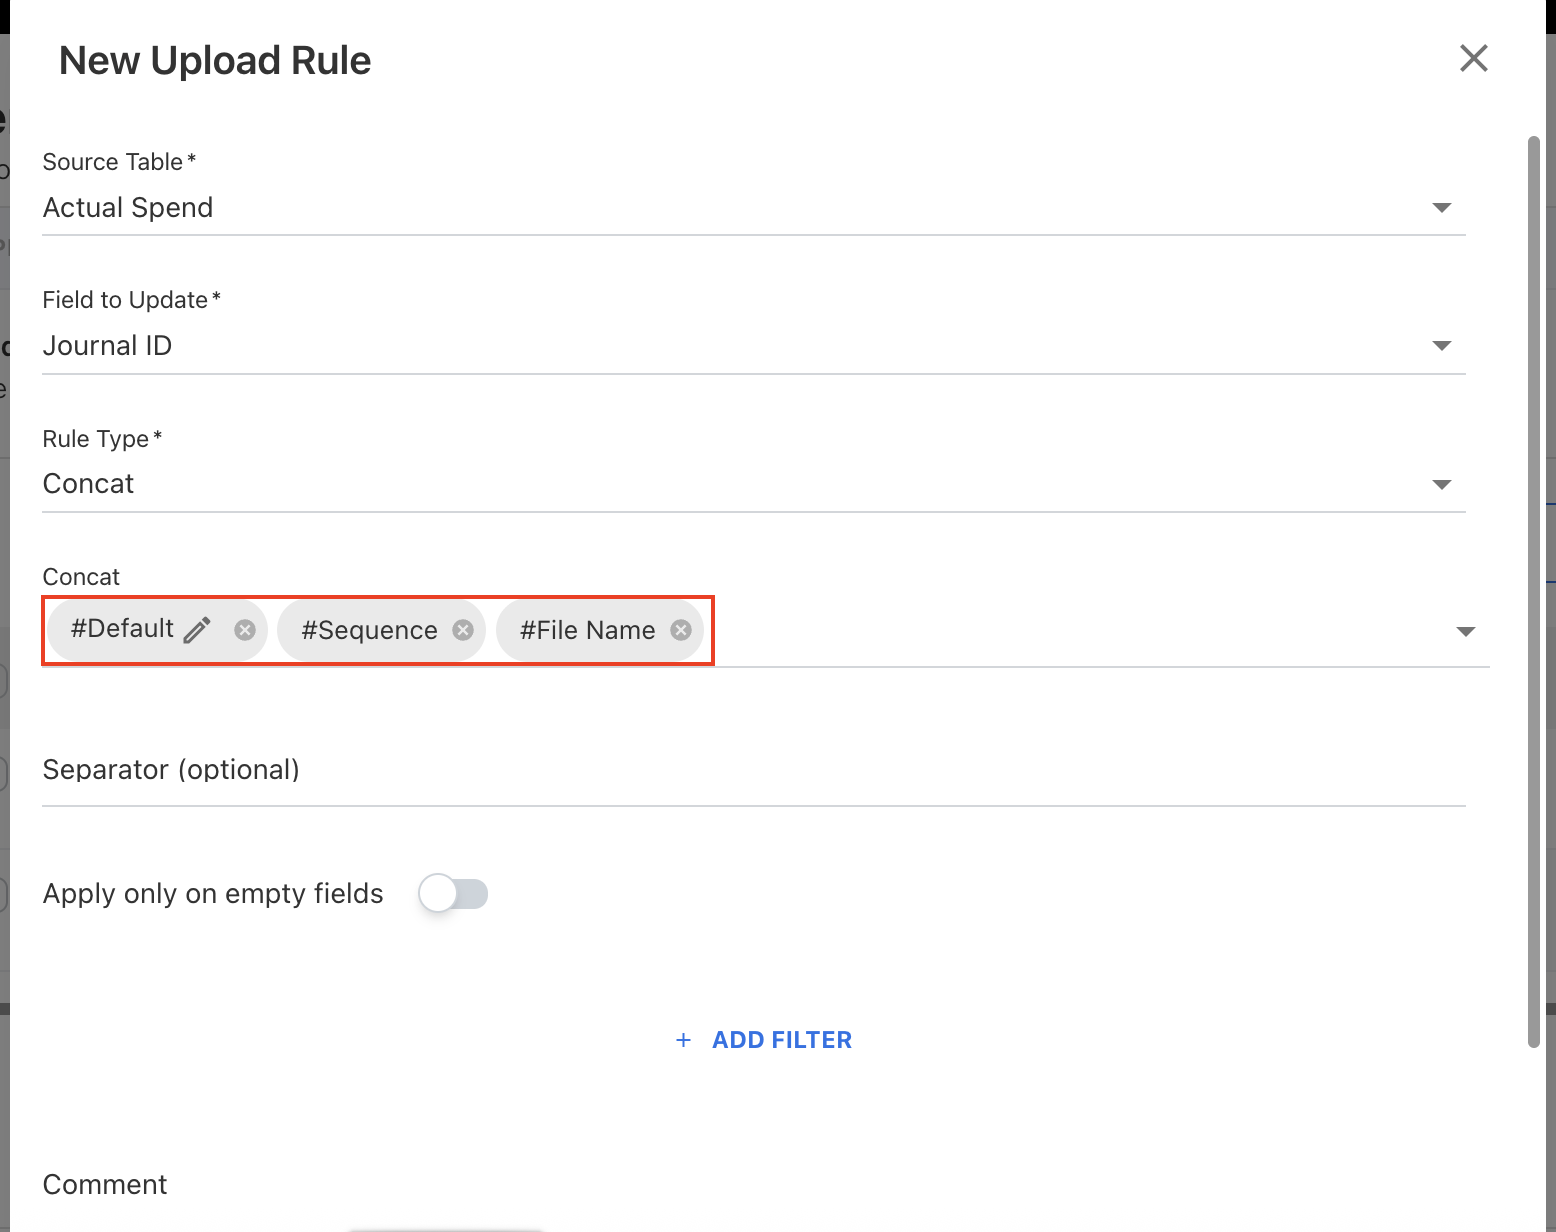
Journal ID Seeding
A new capability has been added to create a Journal ID sequence by concatenating multiple values, making it easier to generate unique identifiers during uploads. Three new fields have been added to the dropdown of Concat rule type:-
#Default – allows you to add a default editable value.
-
#Sequence – generates a sequential number automatically. It includes a year Id – month id of the uploaded month & year.
-
#File Name – uses the file name in the concatenation.
-
-
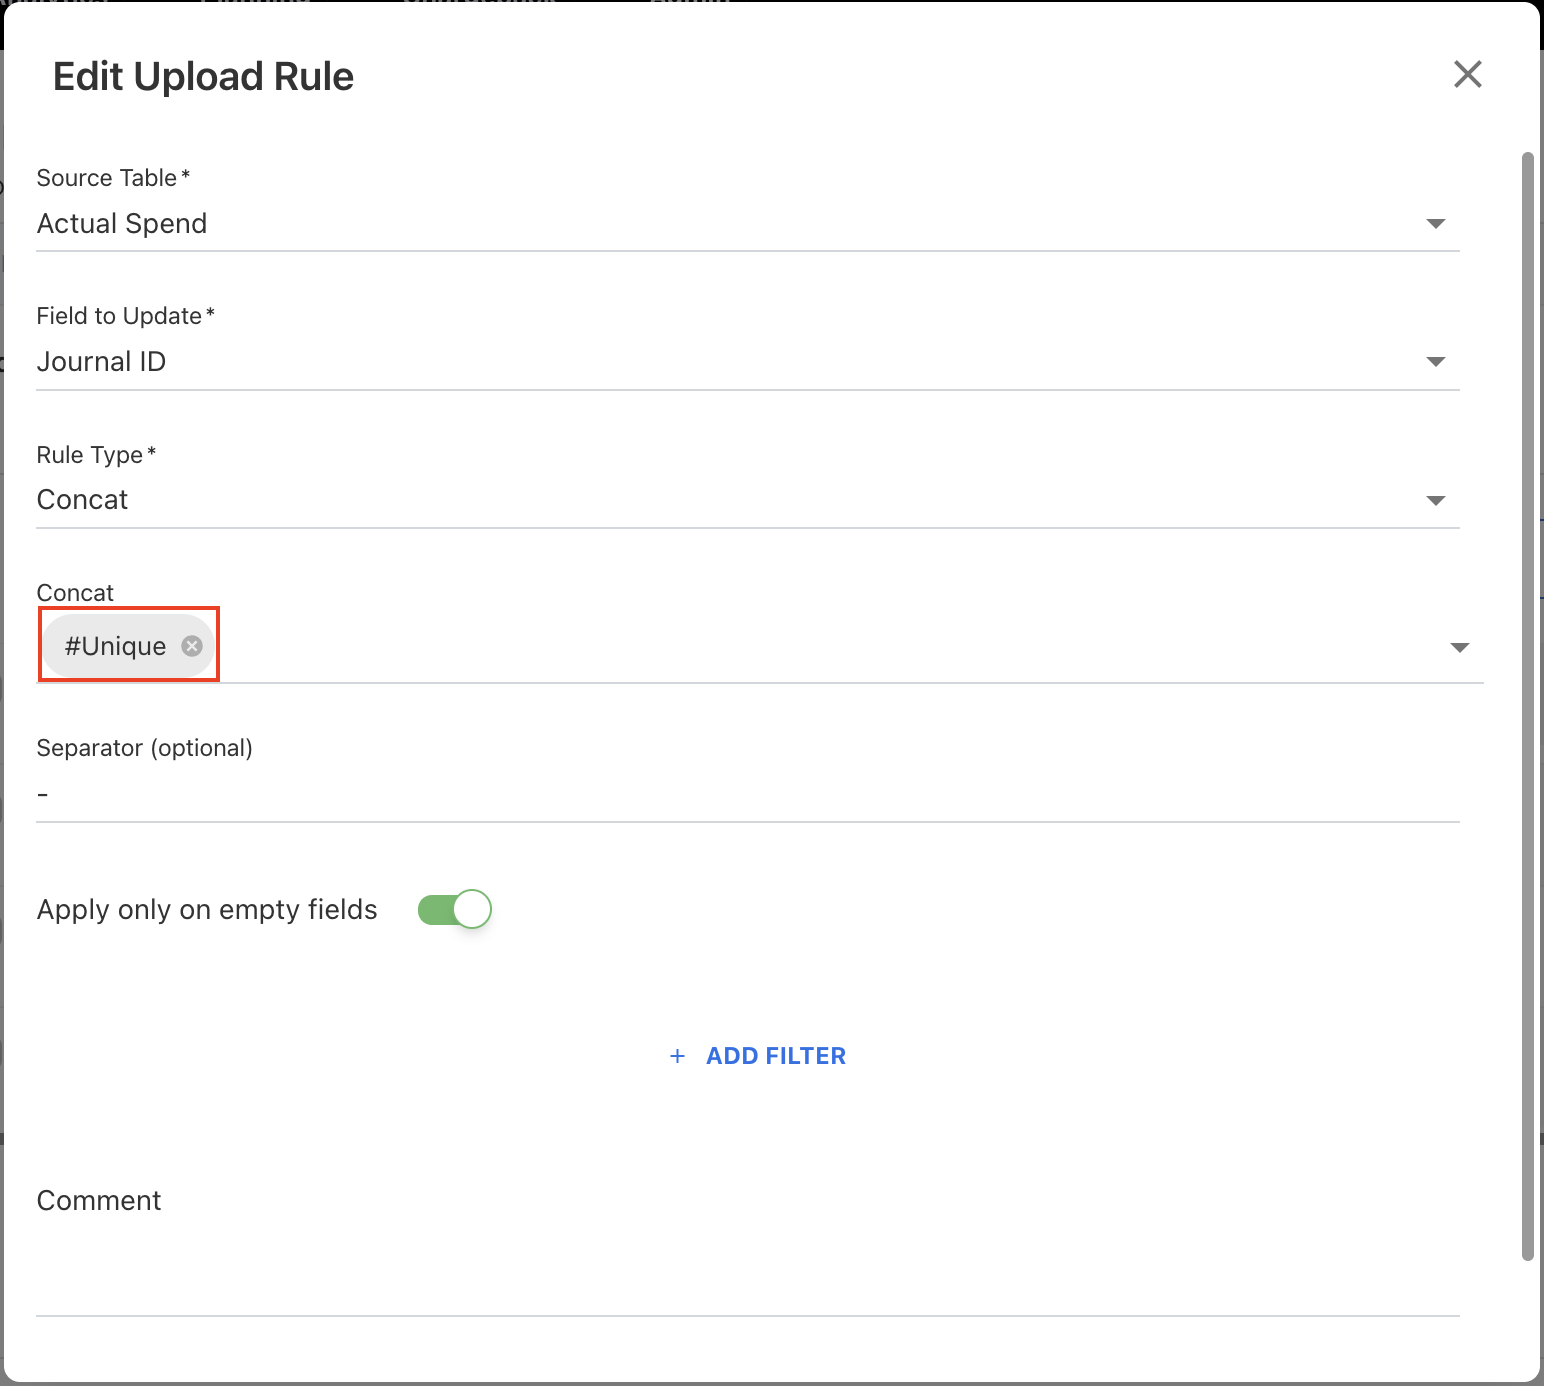
Unique IDs
The Concat rule type is now provided with a new Unique field. This new field is used to covert the duplicate IDs into an unique IDs by incrementing the duplicates. After executing the upload rule using unique field, the destination column concatenated with unique sequence for example, JRNL001-1, JRNL001-2, JRNL001-3 and so on, followed by user defined seperator value.To ensure clarity and avoid discrepancies, it is recommended to use a separator value when applying this rule.
These enhancements simplify the upload process, reduce manual adjustments, and ensure better traceability of uploaded records.
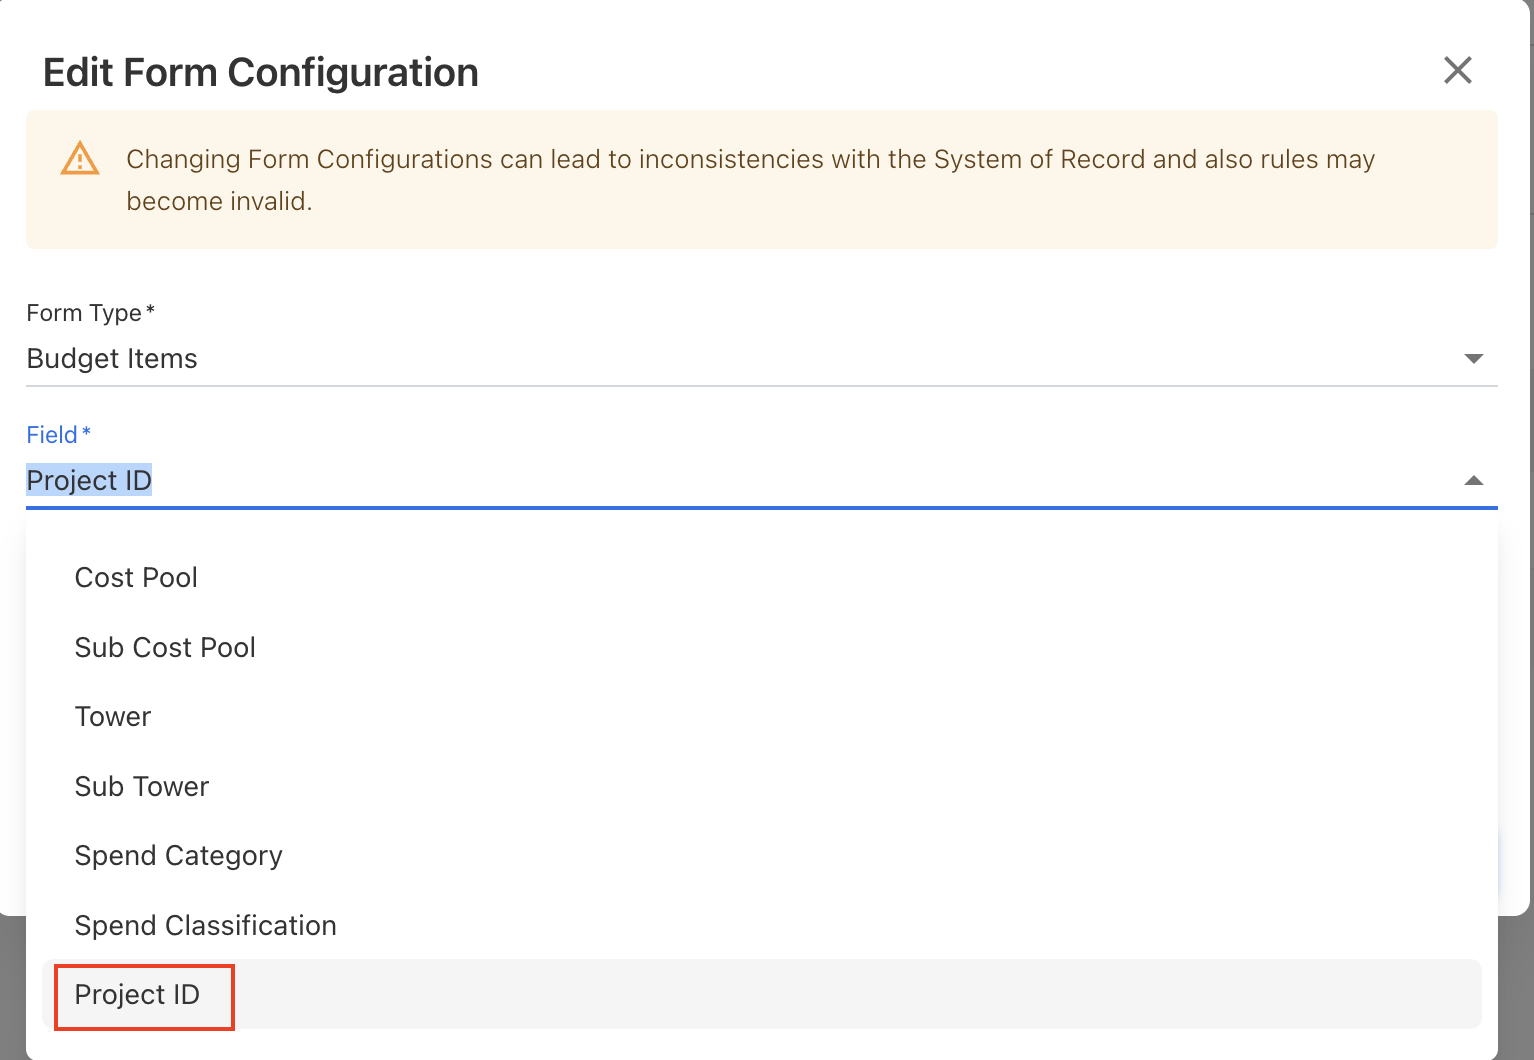
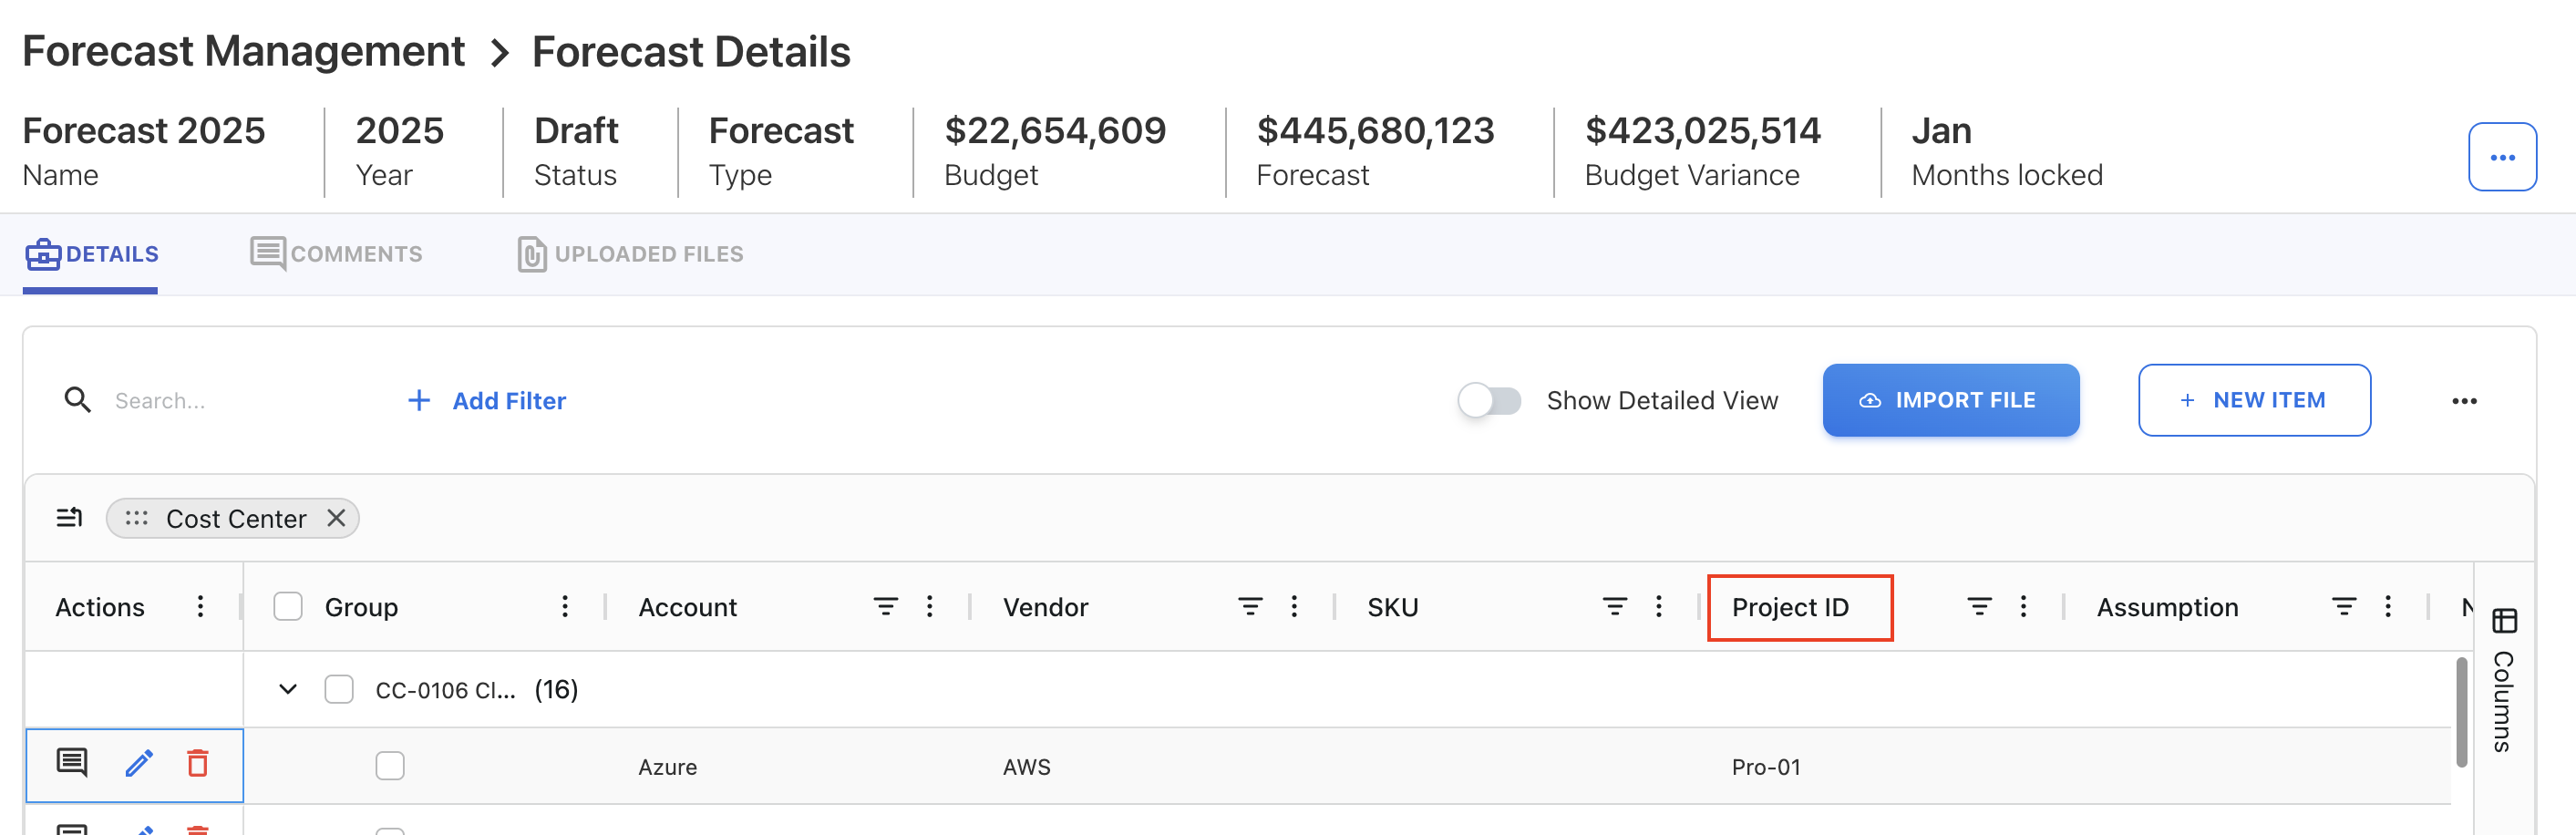
Configurable Project ID Field for Budget and Forecasting
A new Project ID field has been introduced for the Budget and Forecast modules. This field can be configured through the Form Configuration settings. By enabling a Project ID field, users can better align budgets and forecast with project-specific tracking requirements.
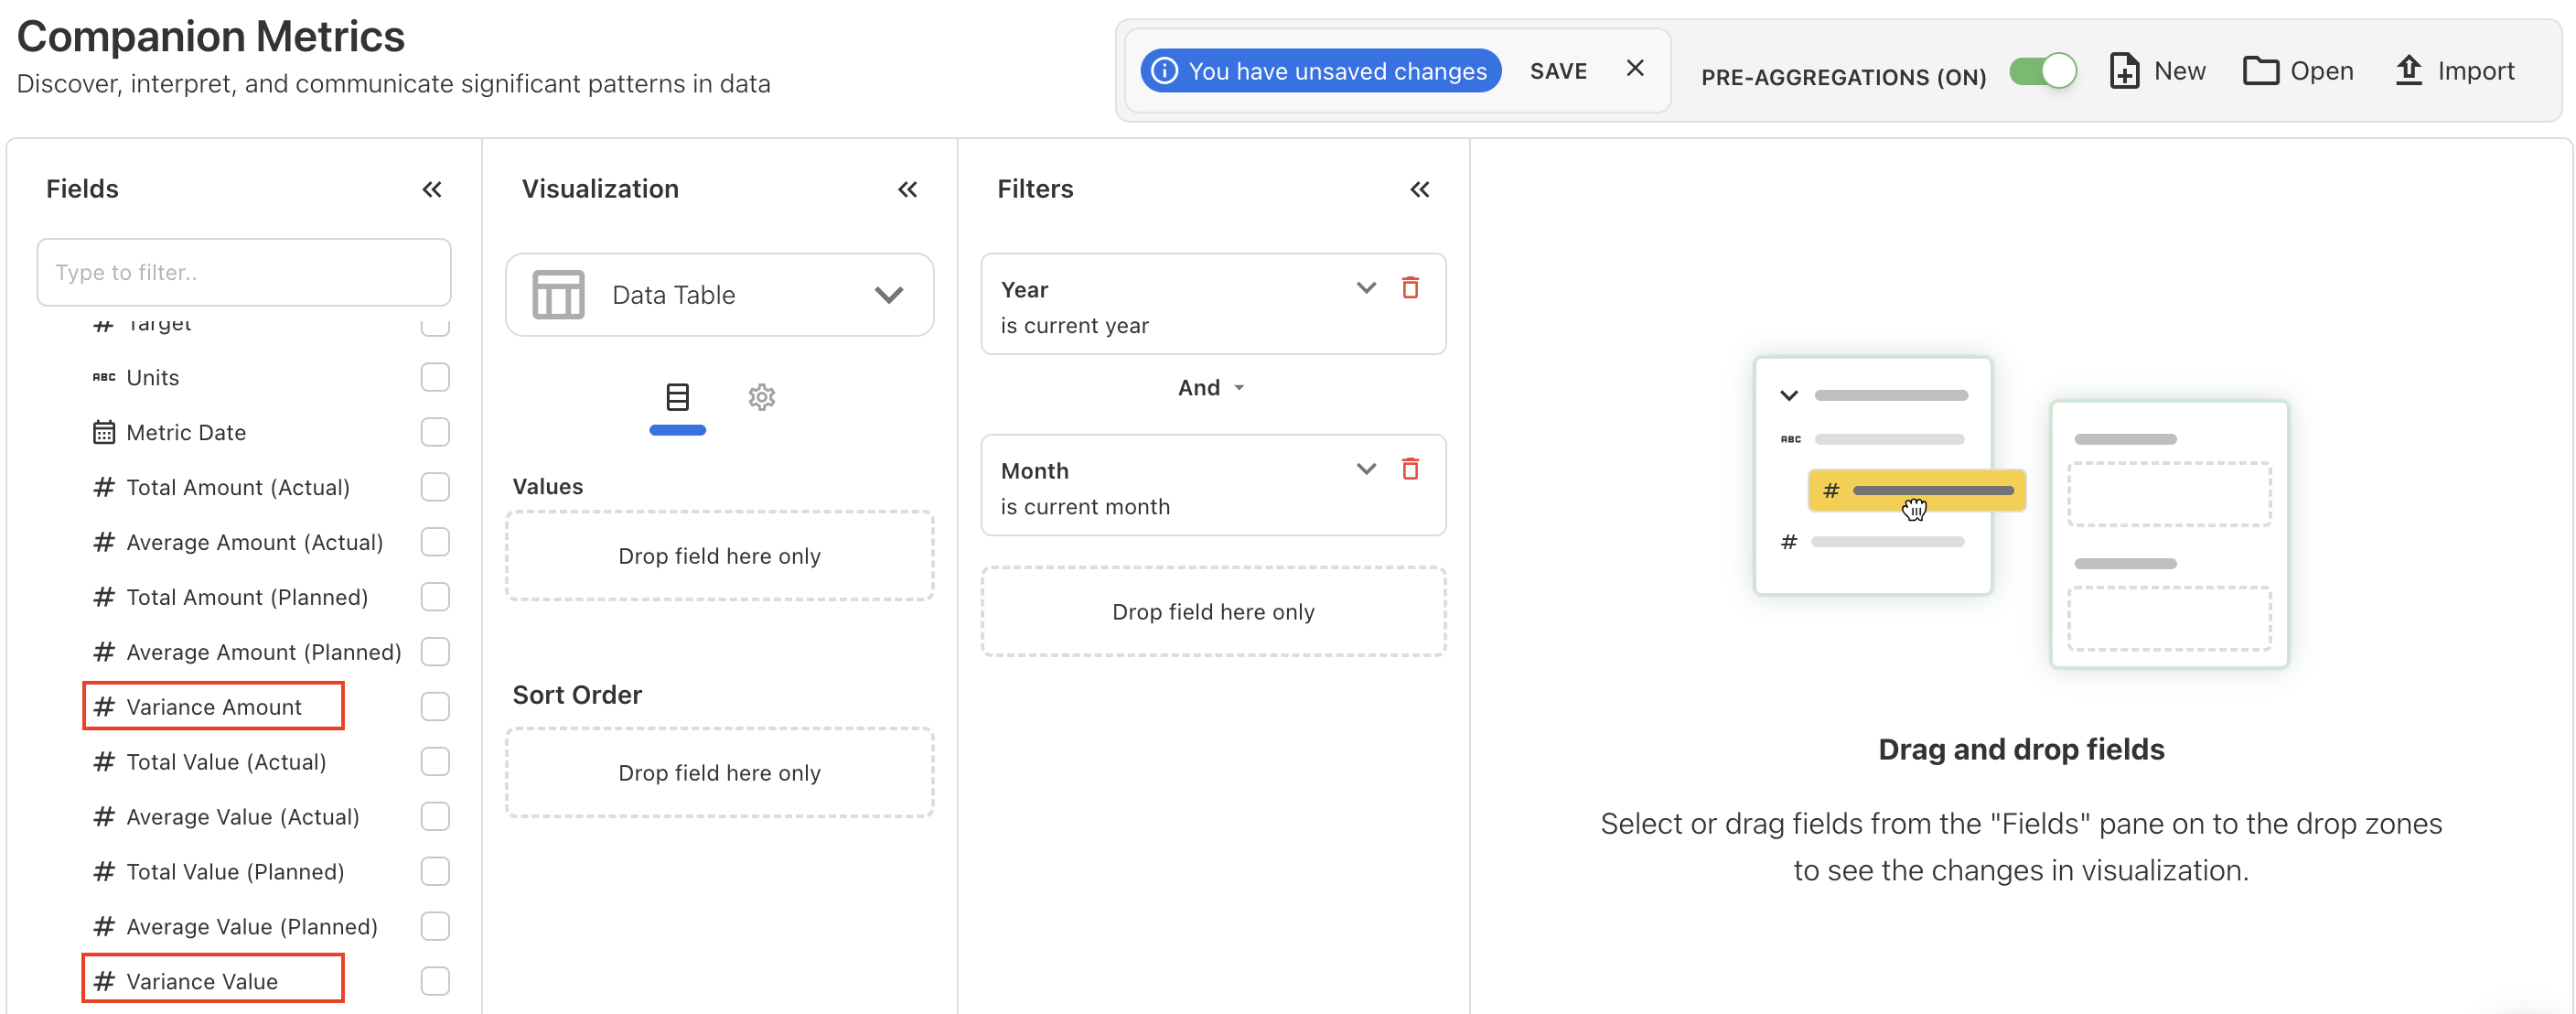
New Variance Fields in Companion Metrics Cube
The Companion Metrics cube is enhanced with two new additional fields: Variance Amount and Variance Value.
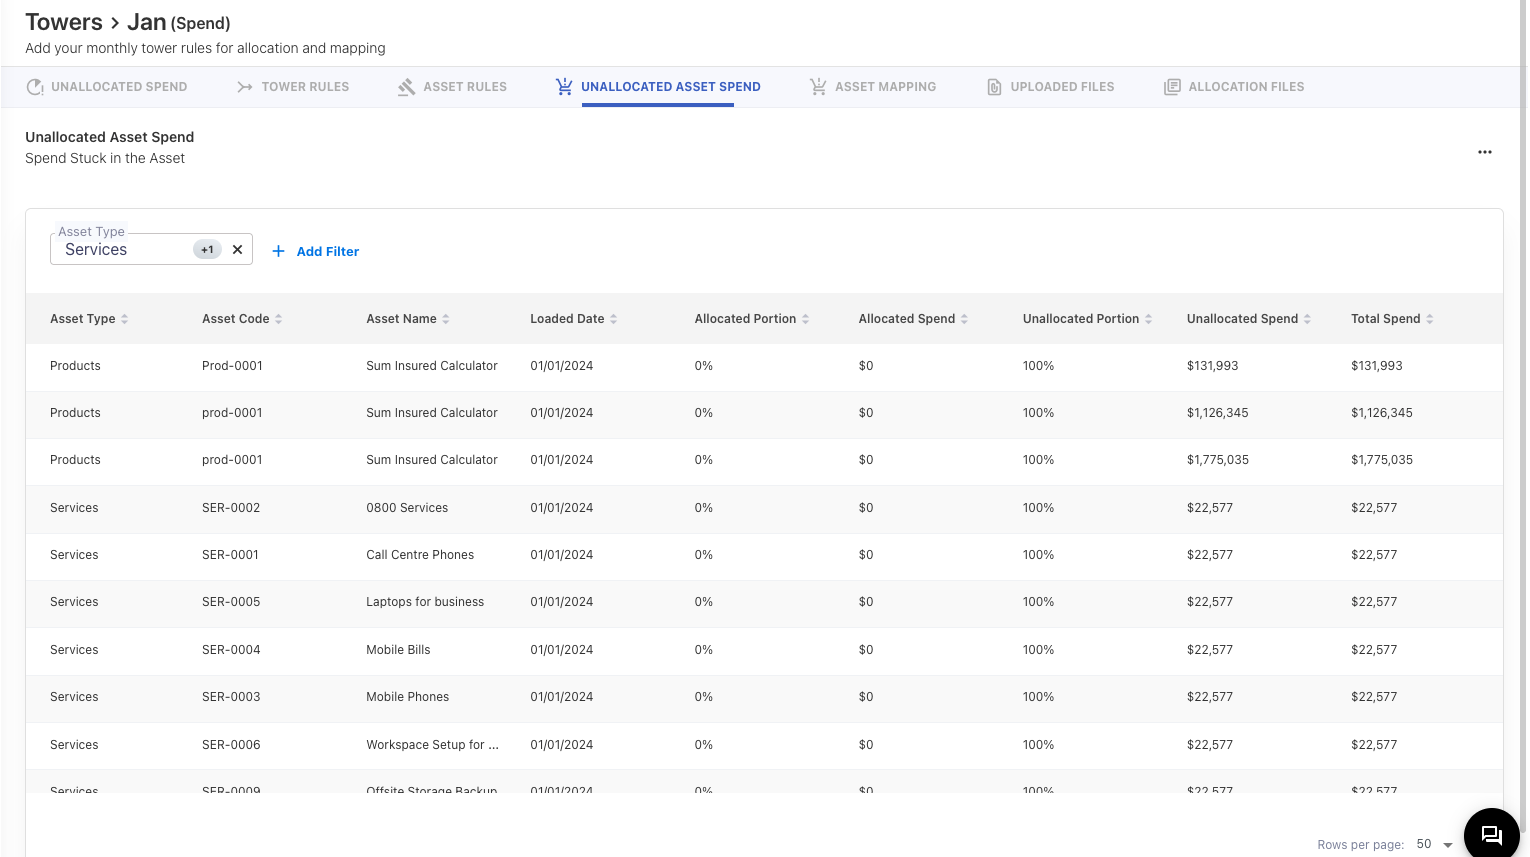
Unallocated Asset Spend Fix
The Product and Services assets spend distribution will be filtered out from Unallocated Asset Spend.
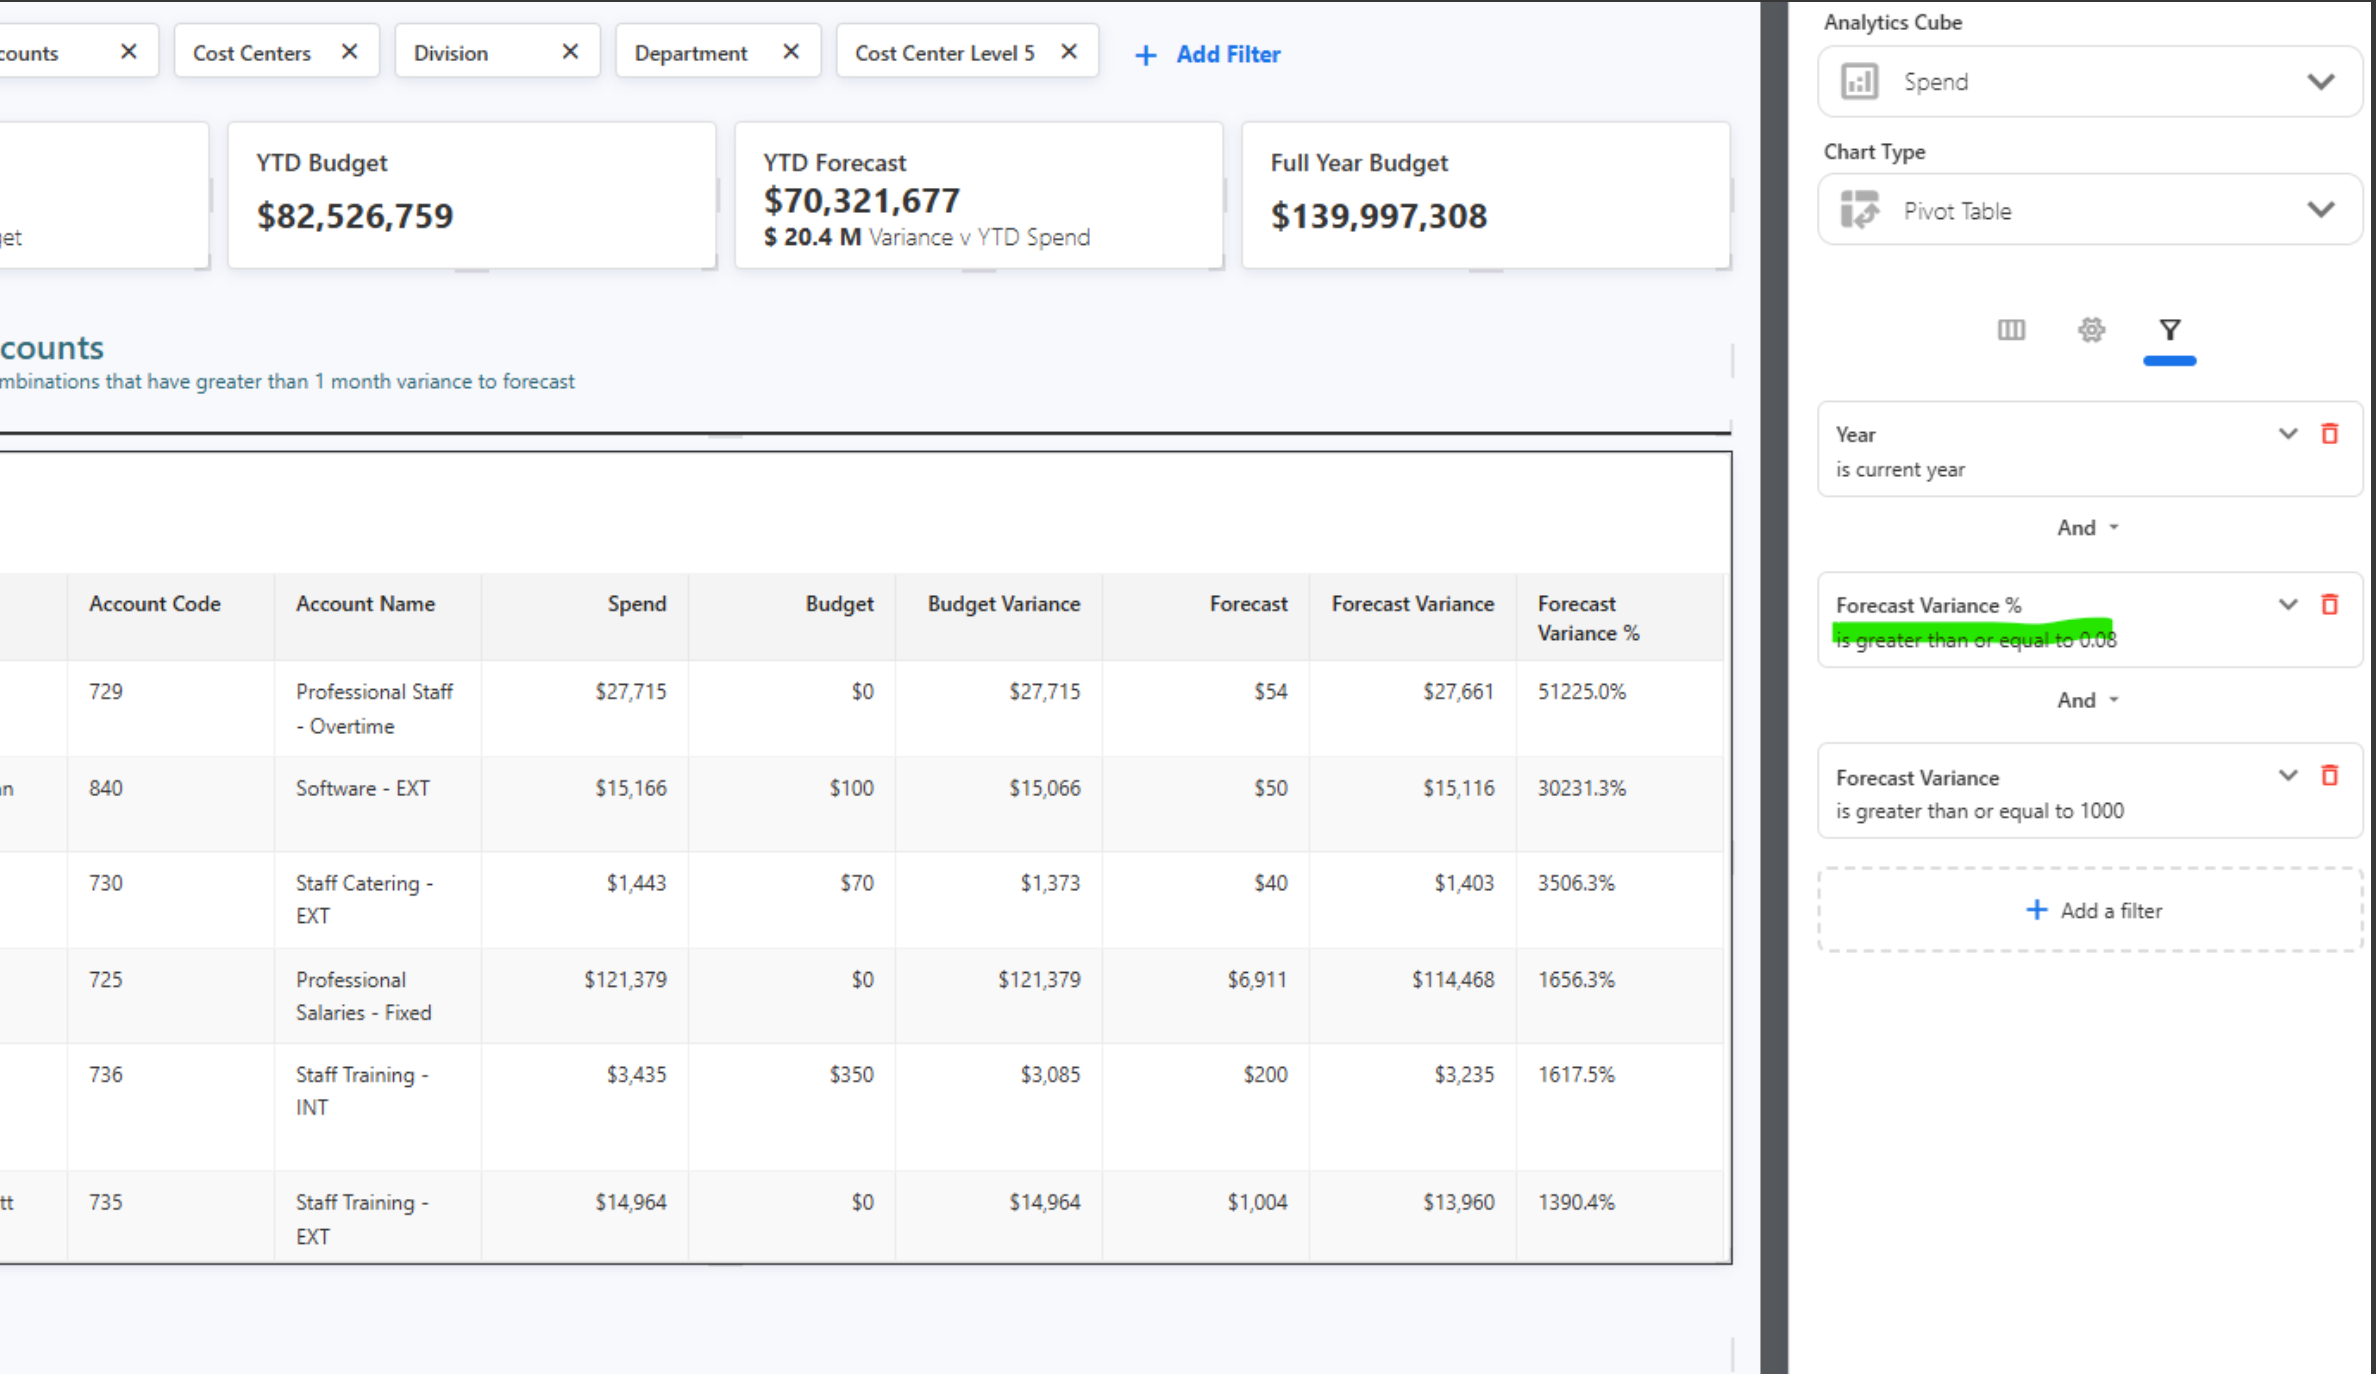
Forecast Variance Filter Fix
The variance percentage filter in Analytics and the Custom Dashboard will now appear in percentage form instead of decimal form.
September 15, 2025
Enhancements and bug fixes
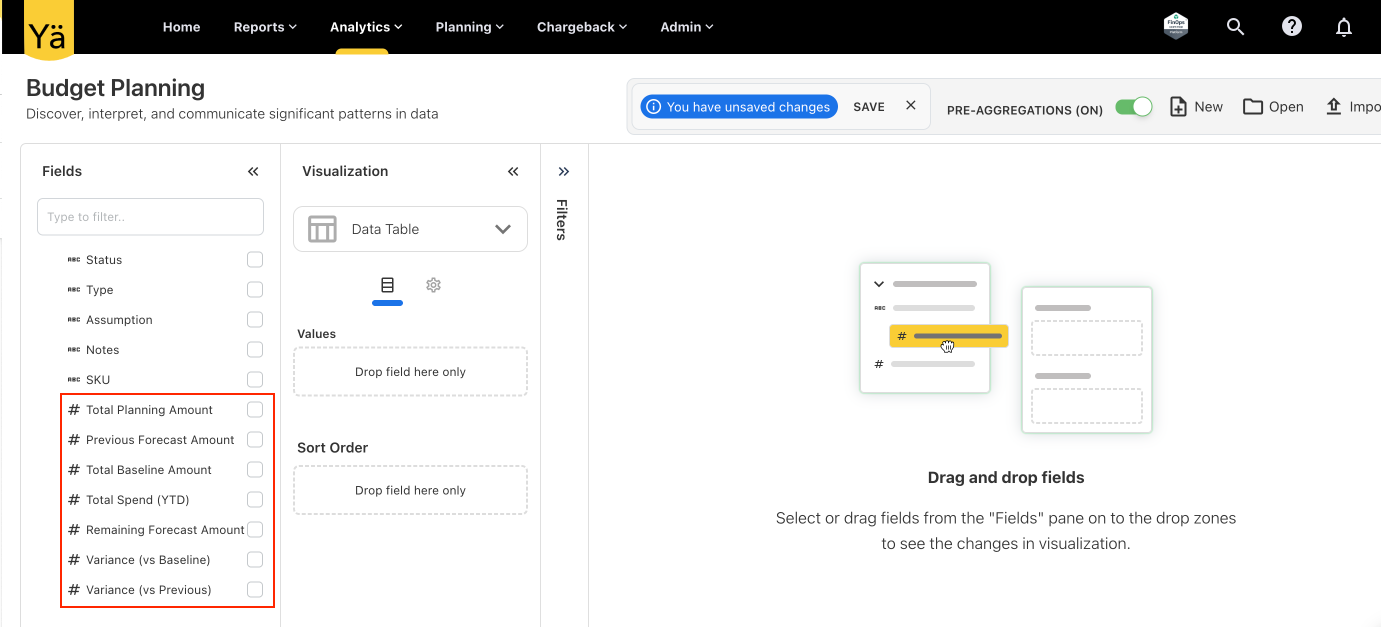
Additional Fields in Planning Cube
The Planning cube in Analytics now includes the following additional fields:
-
Total Planning Amount
-
Previous Forecast Amount
-
Total Baseline Amount
-
Total Spend (YTD)
-
Remaining Forecast Amount
-
Variance (vs Baseline)
-
Variance (vs Previous)
No Role - A New Role Type
We have introduced a new role called No Role in user management. This allows Admins to add users into the system without immediately assigning them access permissions. Users with the No Role option will not have any dashboards, reports, or functional access when they log in, ensuring that access is fully controlled until the Admin assigns a role.
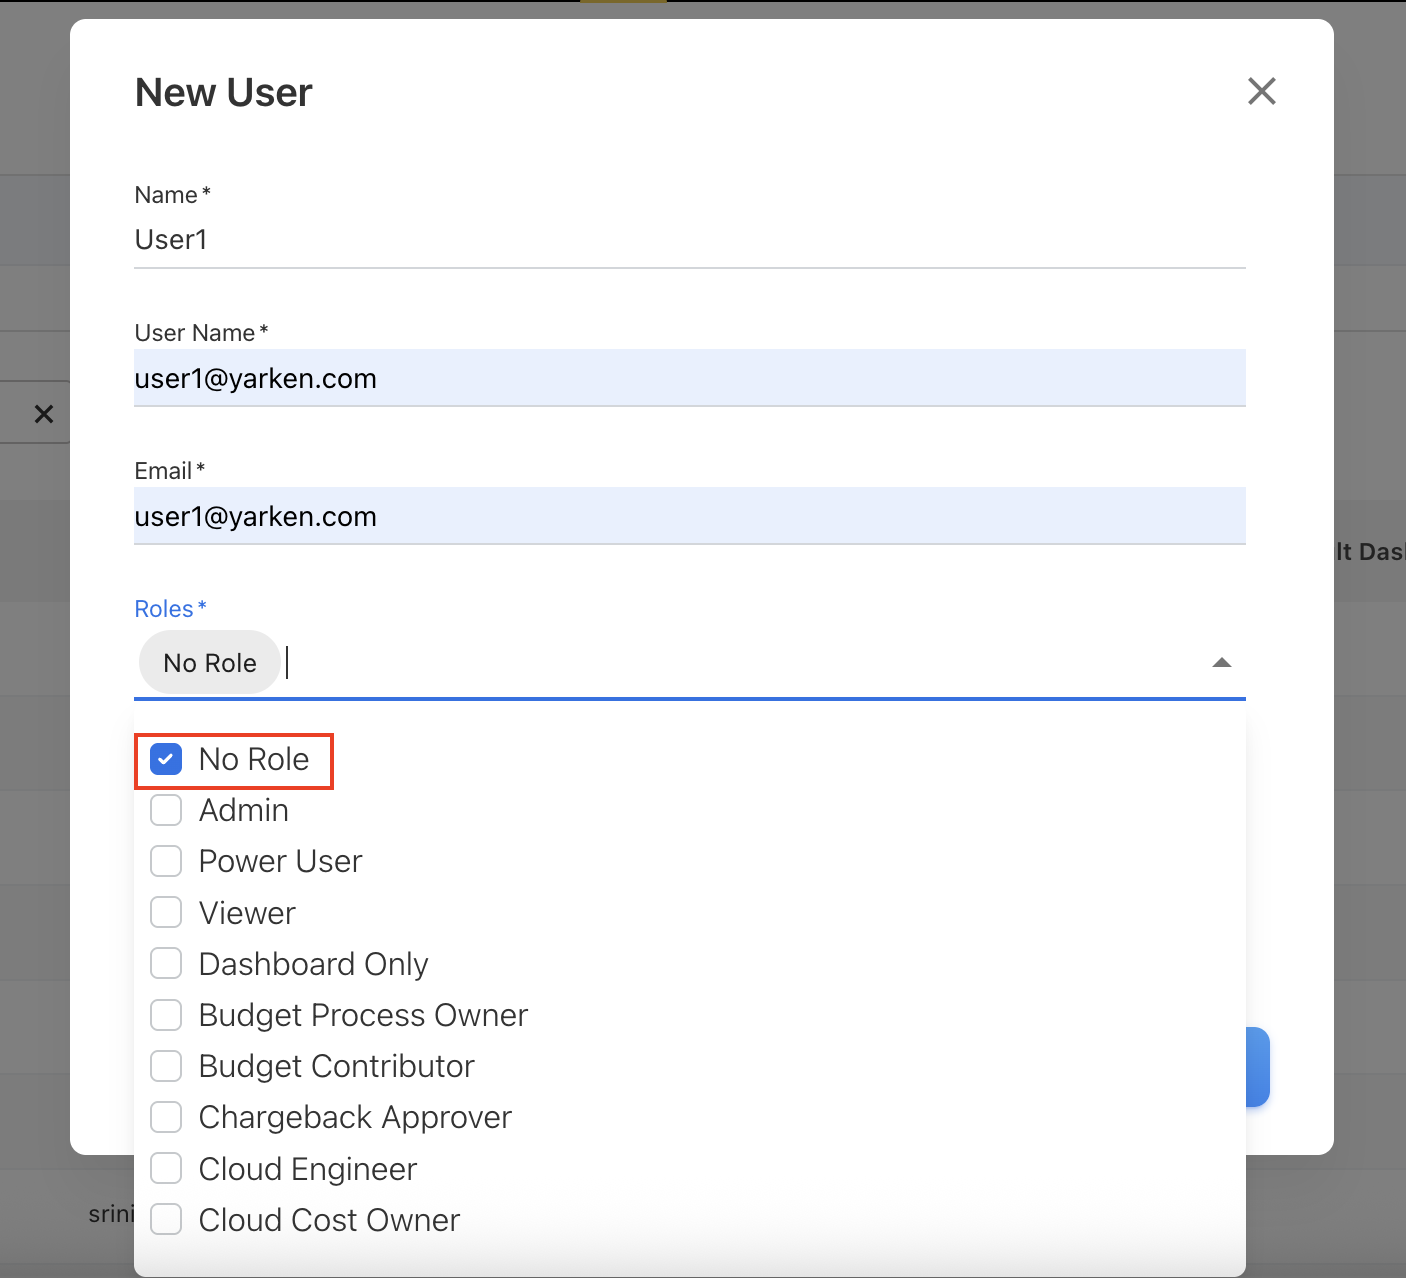
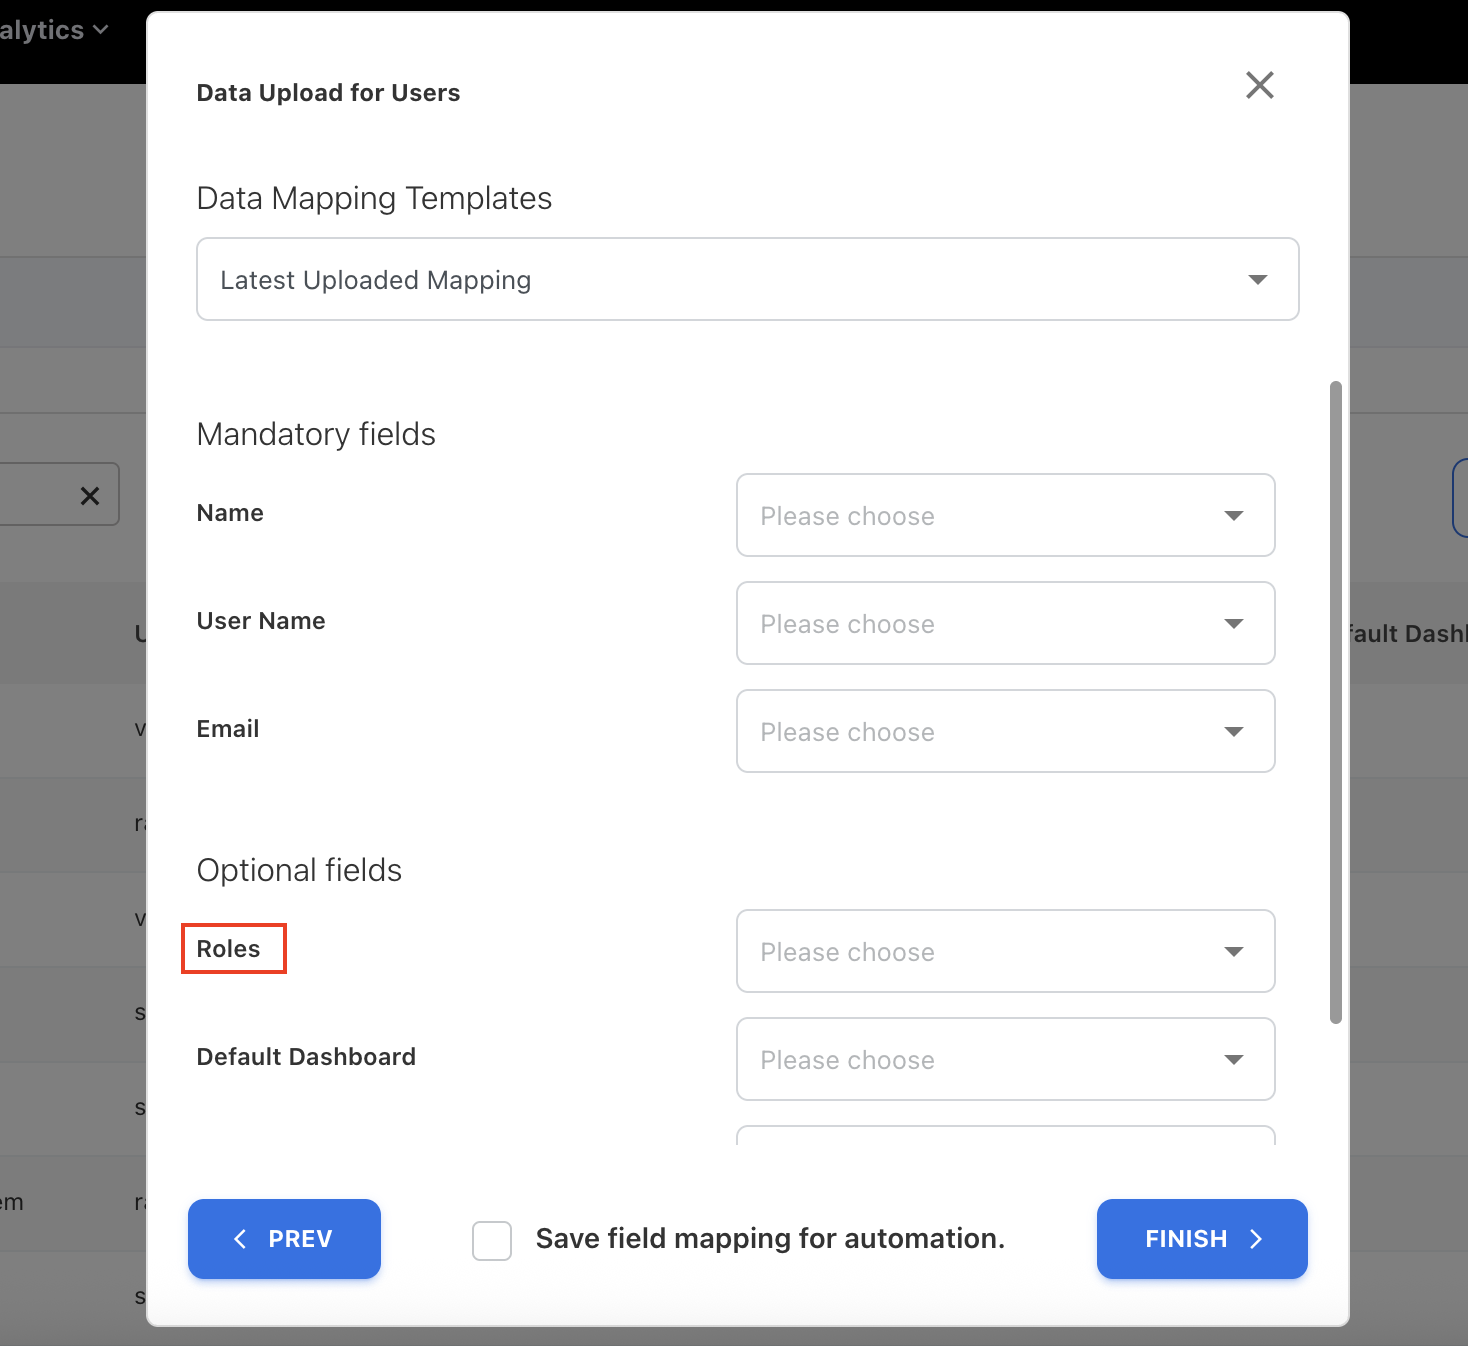
To support bulk user onboarding, the Roles field is now made optional when uploading users via file. If no role is specified in the upload file, the system will automatically assign the No Role to those users. This makes it easier to pre-load large groups of users into the system and assign roles later as needed. However, when creating users manually through the interface, assigning a role remains mandatory to maintain proper access control.
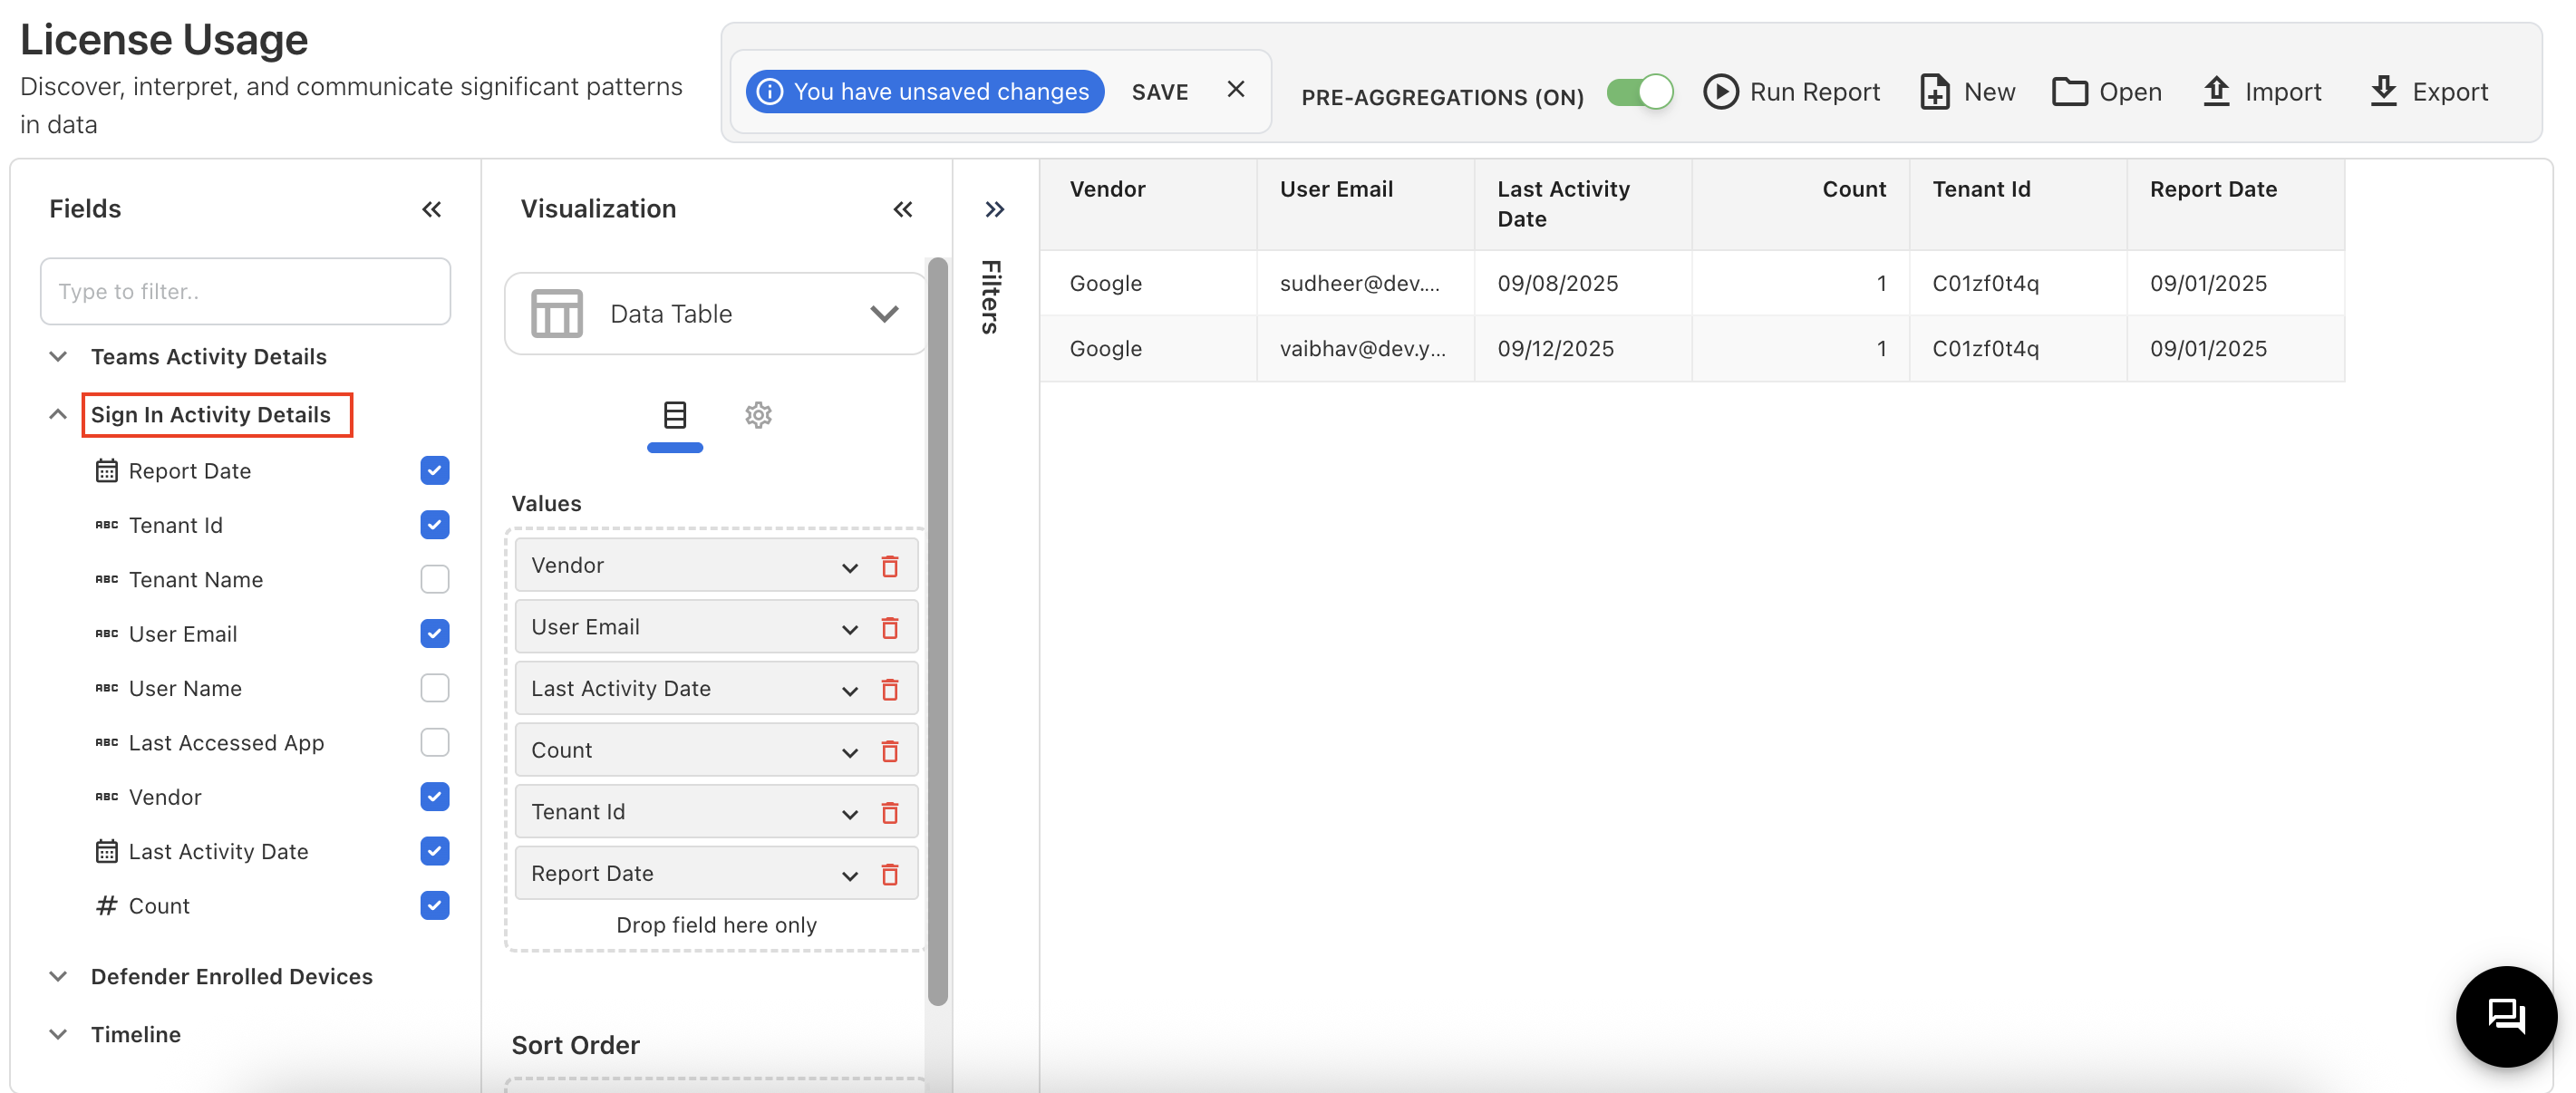
Sign In Activity Details - Entra ID and Google Workspace
We’ve introduced a new capability to capture Entra ID and Google Workspace sign-in activity details for all users in a tenant. This provides visibility into user authentication across your organization.
The report includes:
-
Tenant ID & Tenant Name
-
User Email & User Name
-
Last Accessed App and Vendor
-
Last Activity Date
-
Count of sign-ins
-
Report Date
Use cases key highlights:
-
Application usage– Identify which apps are last accessed across the tenant (Only for Microsoft).
-
User activity tracking – Monitor last sign-in dates and frequency of user access.
-
Account monitoring – Detect inactive accounts.
-
Audit reporting – Maintain tenant-wide authentication records.
-
Vendor analysis – Tracking sign-in activity across vendors (Microsoft or Google).
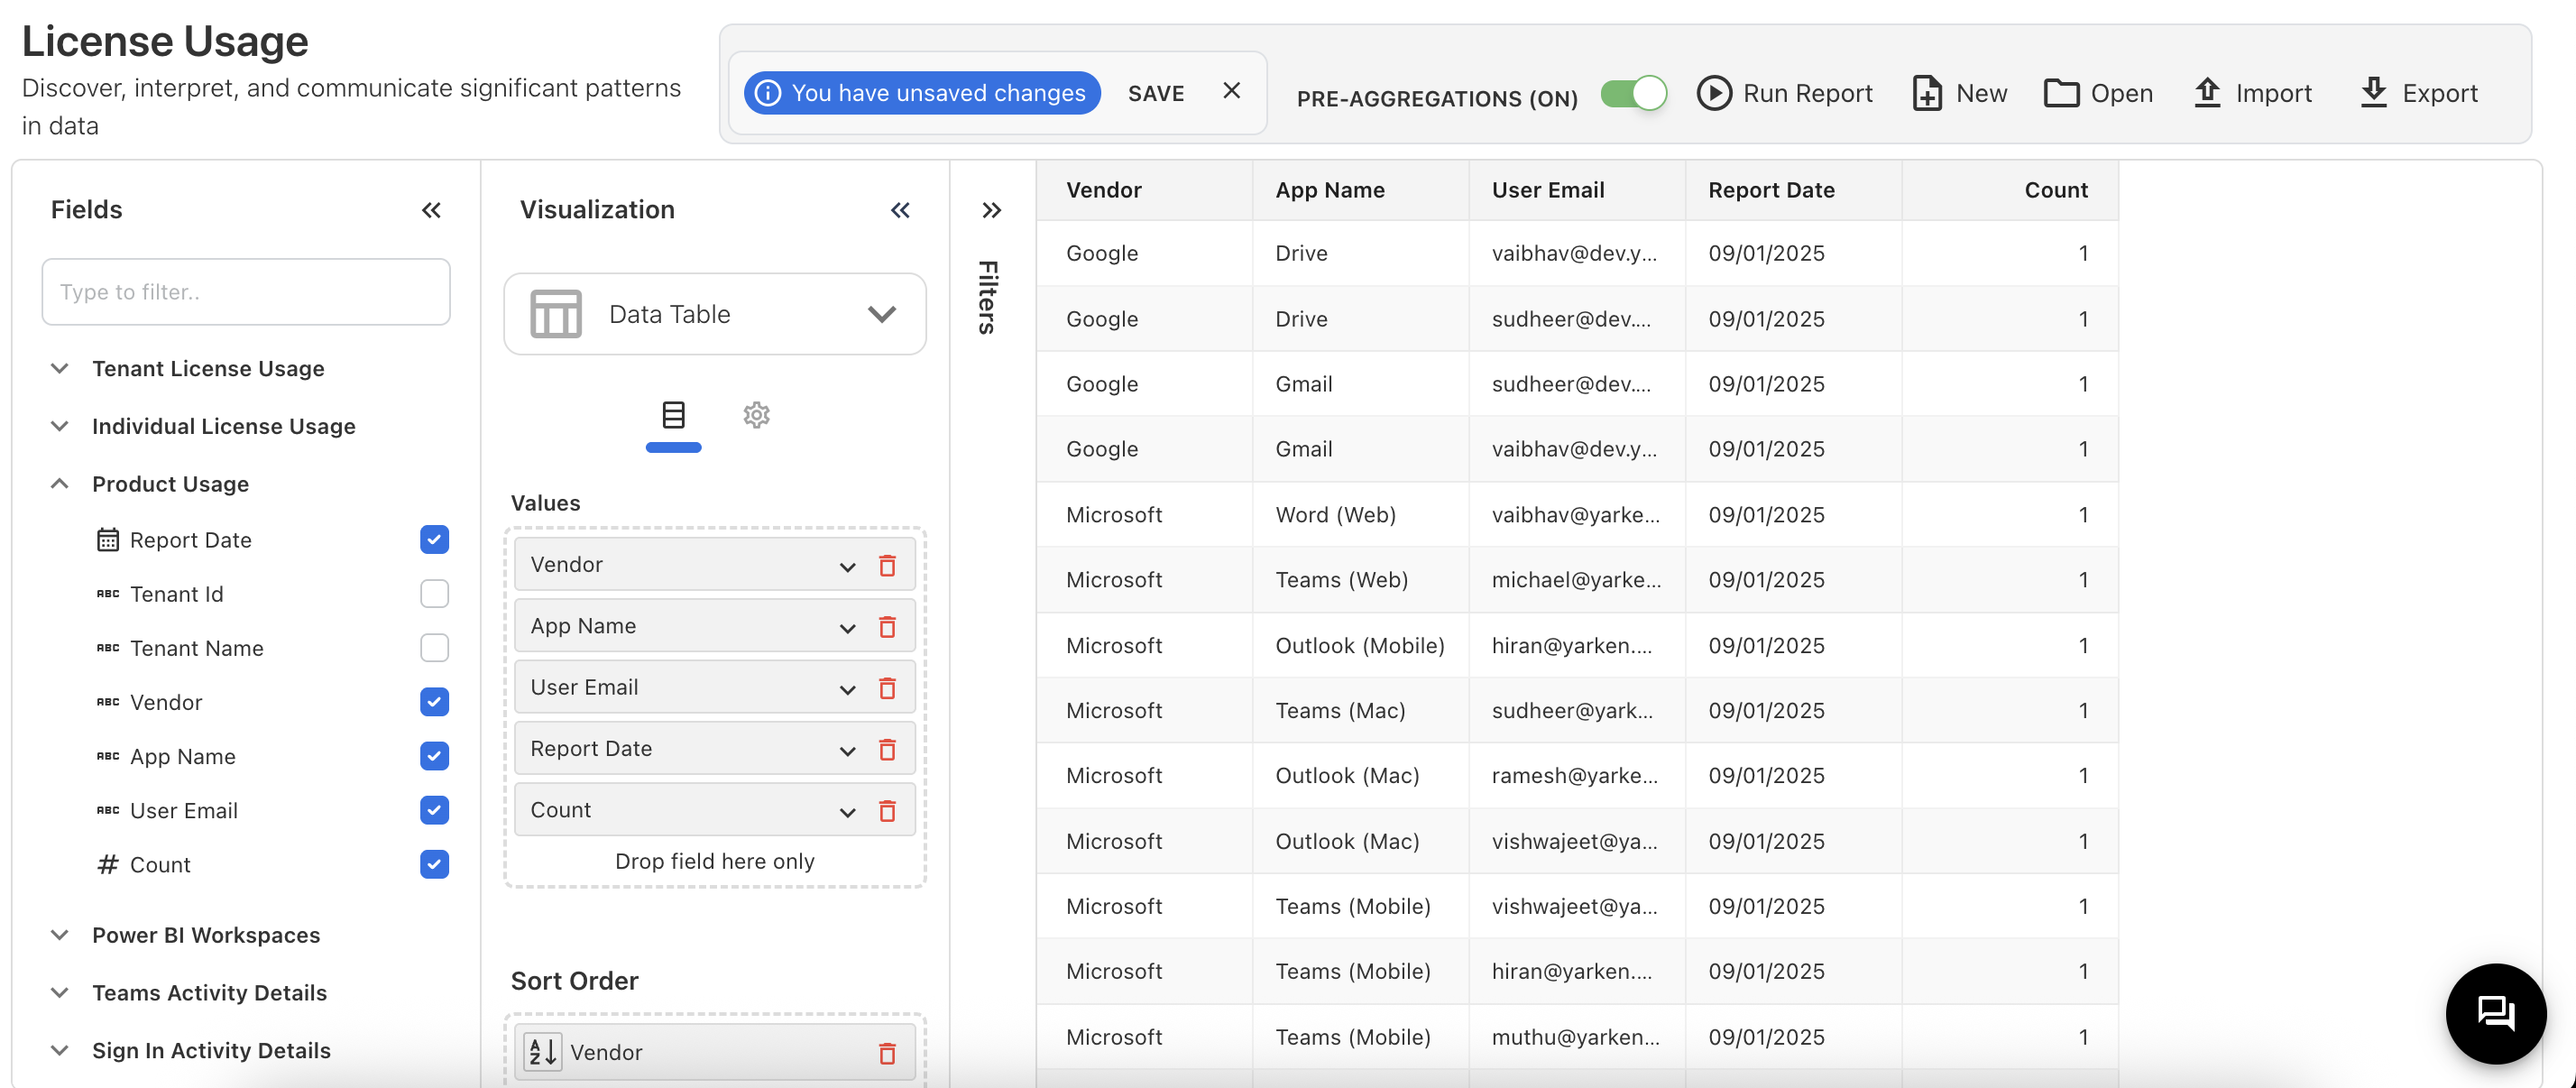
Tracking Google Products Usage
We’ve added support to capture and report on monthly product usage across Google productivity tools (Docs, Sheets, and Slides). This helps analysts evaluate actual adoption and optimize license tiers accordingly.
Key highlights
-
Tool adoption tracking: Monitor adoption trends for Docs, Sheets, and Slides at a monthly level.
-
Active users: Understand which productivity tools are most actively used and by which user.
-
Monthly activity summary: Usage data is aggregated and stored in the Product Usage cube.
Captured fields in Product Usage cube:
-
Product Date
-
Tenant Id
-
Tenant Name
-
Vendor
-
App Name
-
User Email
-
Count
Spend Refresh Issue on Home Page
The Home Page refresh behavior has been modified so that the data will be shown only for the latest cube-refreshed month. Previously, the home screen did not display the latest data unless the cube was refreshed.
September 08, 2025
Click to expand...
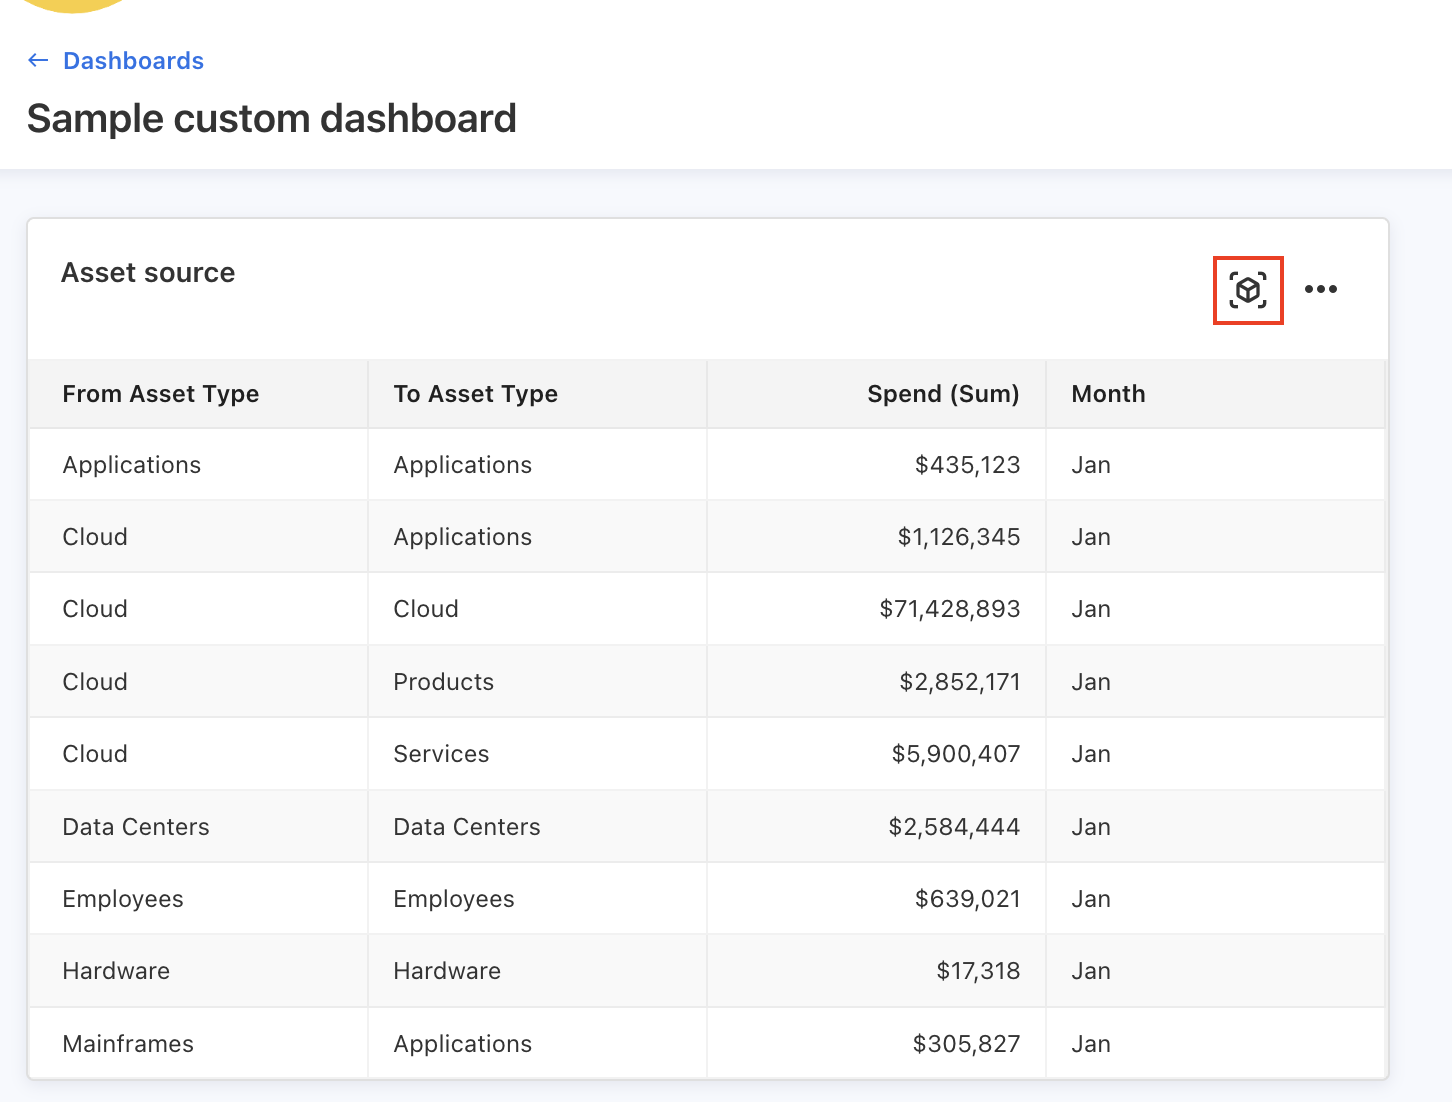
Open Custom Dashboard Charts in Analytics
The charts and tables from the Custom Dashboard can now be opened directly in Analytics. An icon Open in Analytics has been added to each chart and table. When clicked, the selected visualization opens in Analytics with the same filter criteria applied.
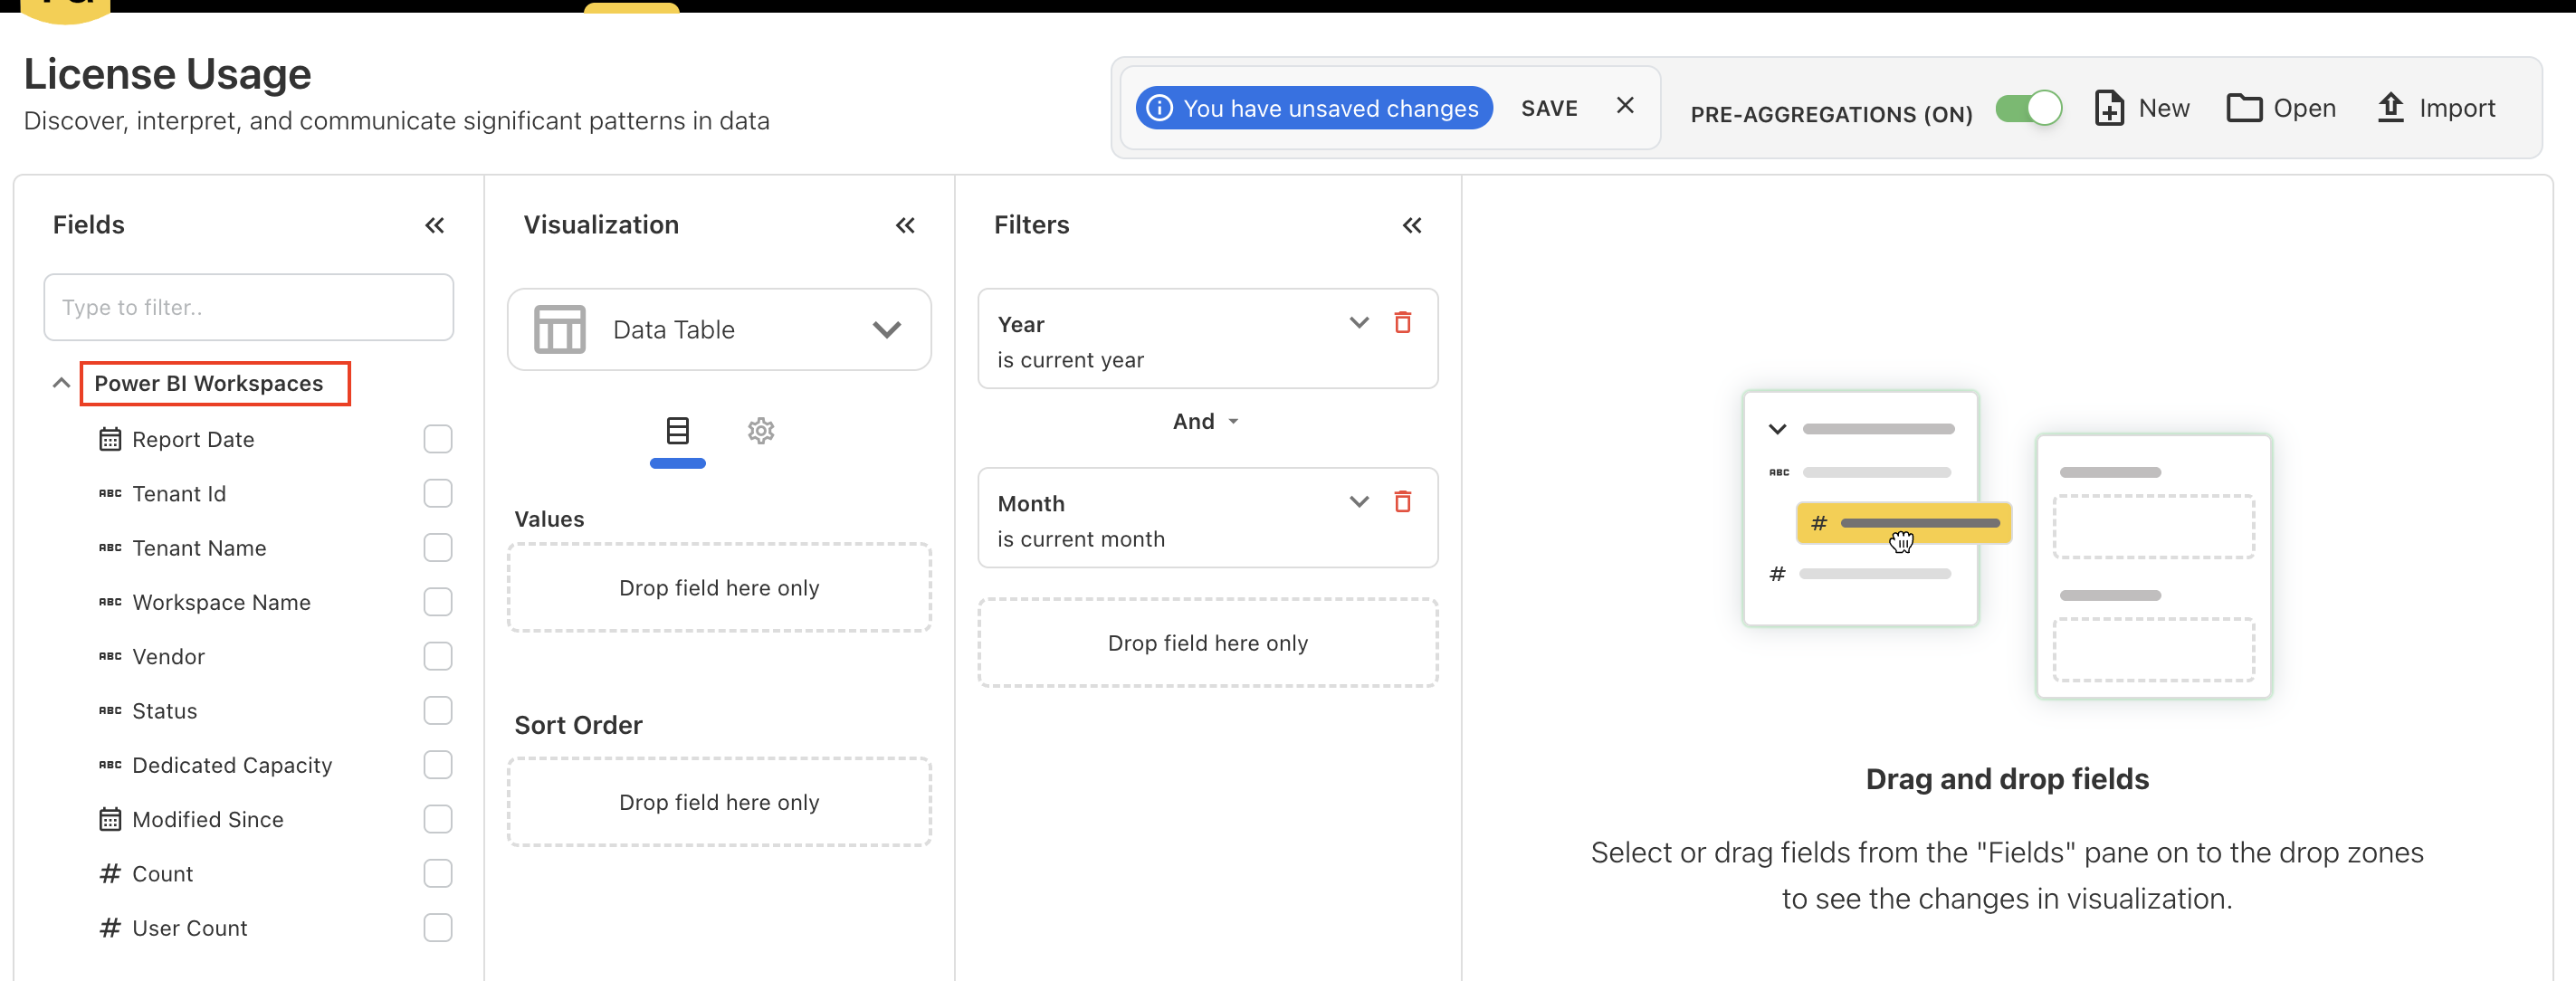
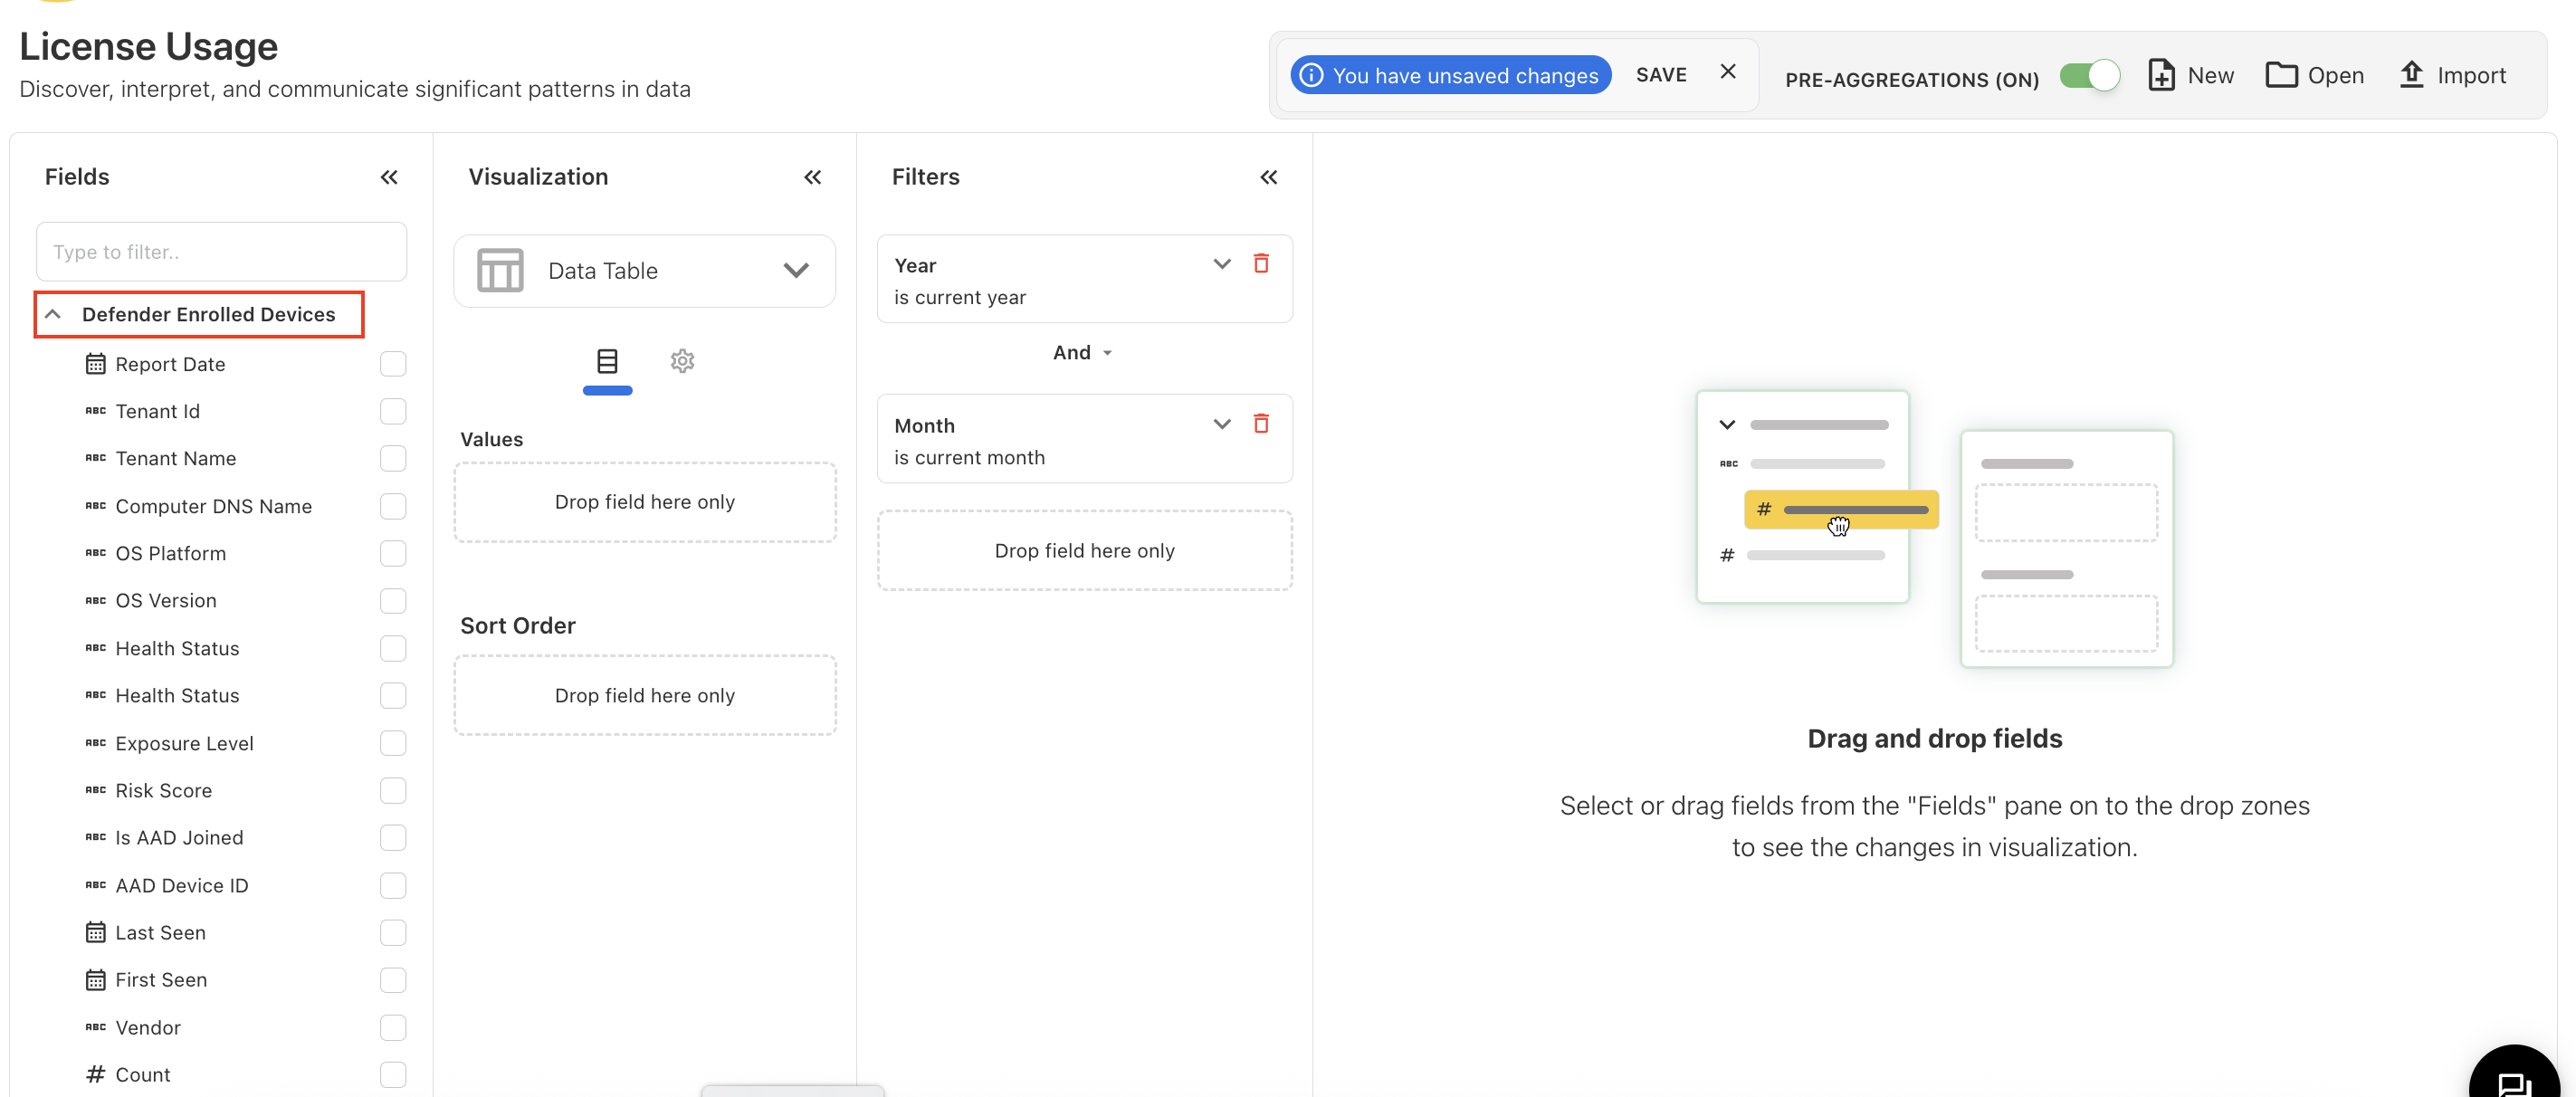
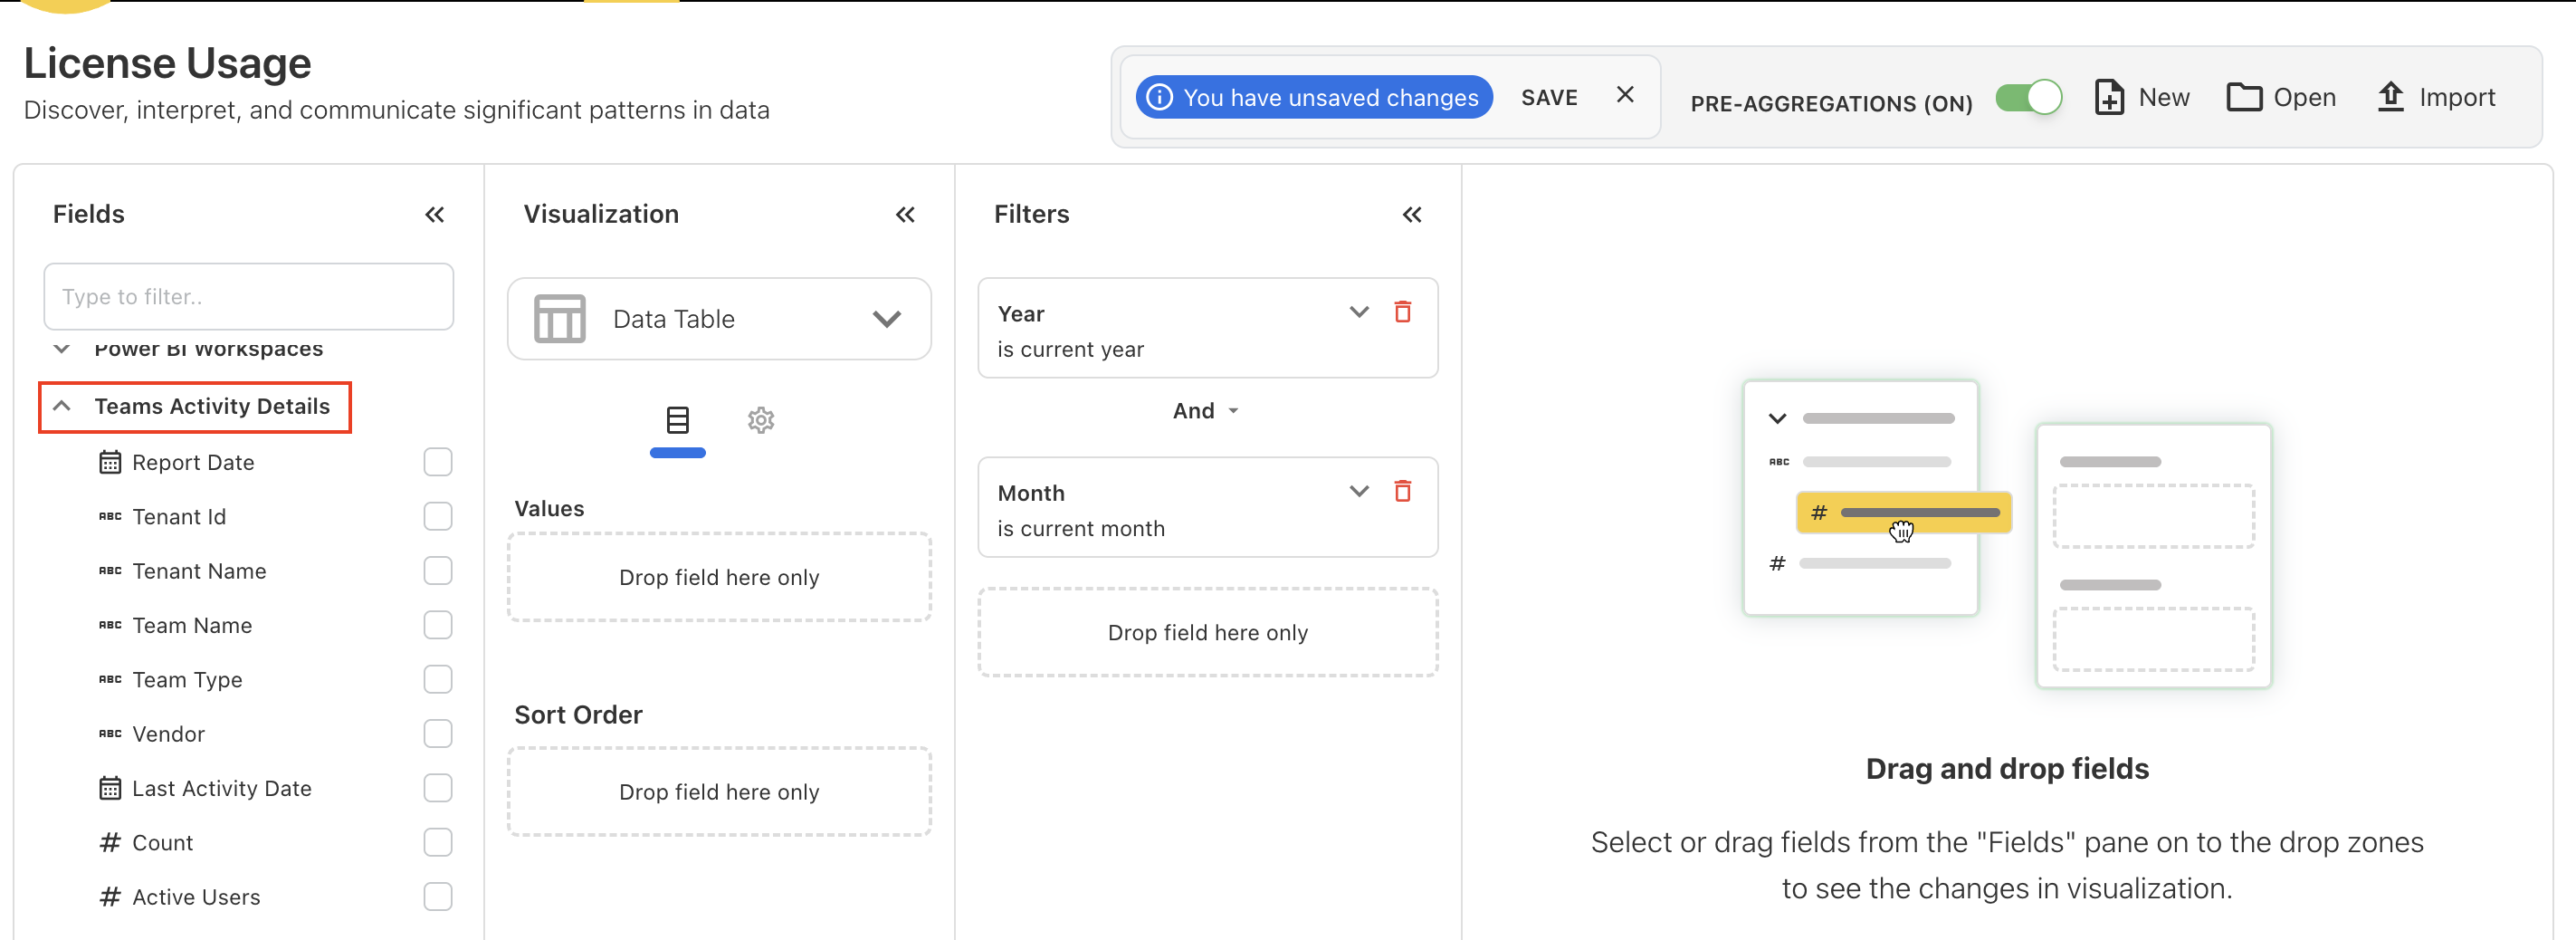
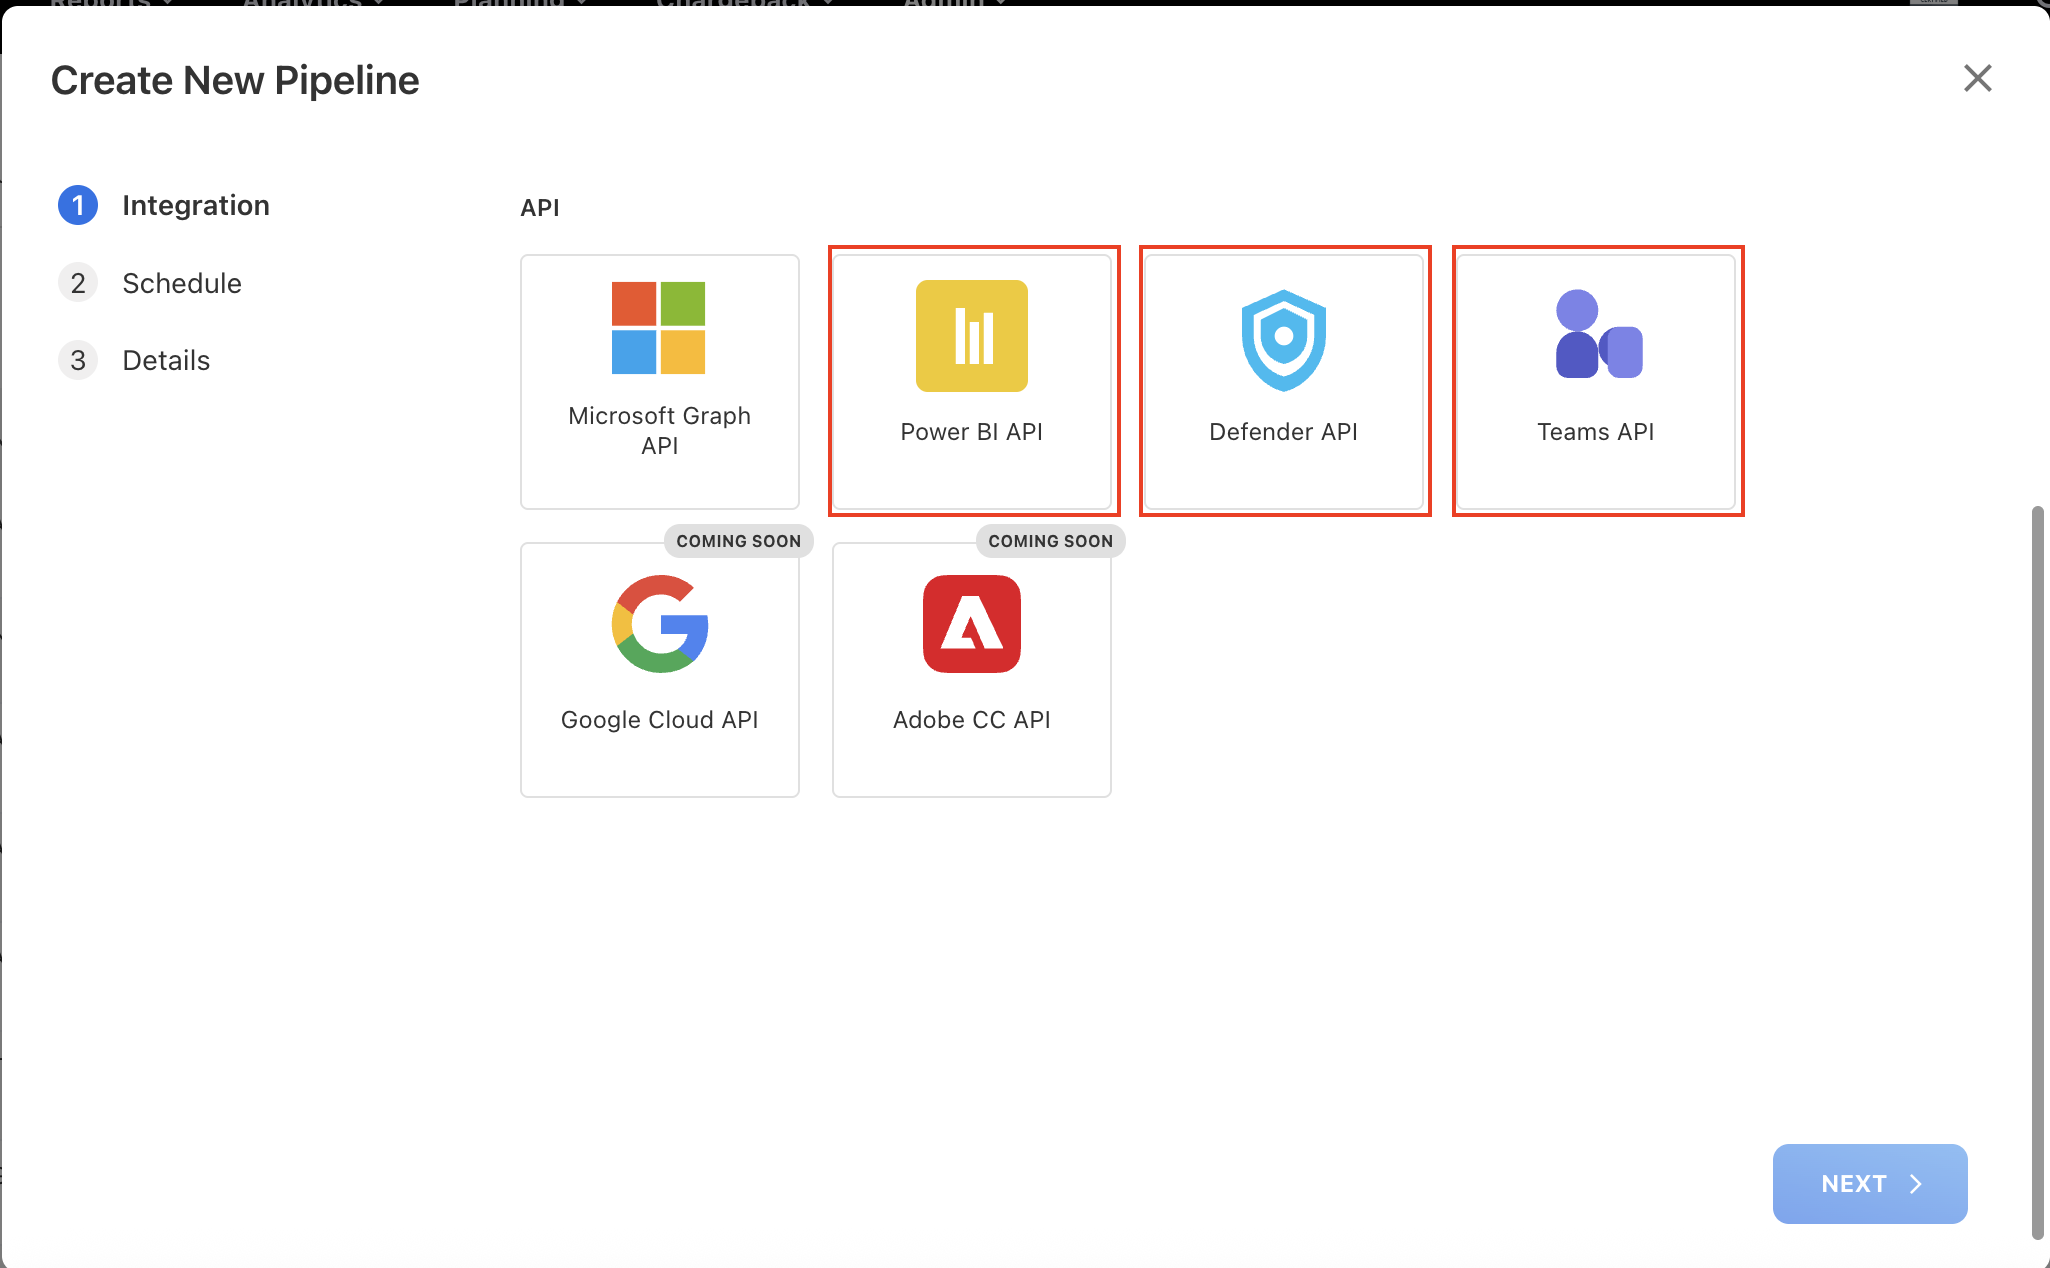
New API Integrations
We have added new API integrations to expand license usage tracking and reporting. These integrations allow the system to capture richer usage insights directly from Microsoft services:
-
Power BI API – Track usage across Power BI workspaces. Monitor usage patterns and users license count.
-
Defender API - Retrieve information on Microsoft Defender-enrolled devices.
-
Teams API - Capture detailed insights into Teams activity, including active users, to optimize license allocation.
-
Entra ID API – Access sign-in activity logs for Entra ID (Azure AD), last access app and last activity dates.
New APIs unlocked
License Storage Migration
All license usage and product usage data is now stored in files instead of the database. The data has been moved to S3 in Parquet format, improving scalability, performance, and storage efficiency. This change also ensures faster retrieval and better handling of large datasets.
September 01, 2025
Enhancements and bug fixes
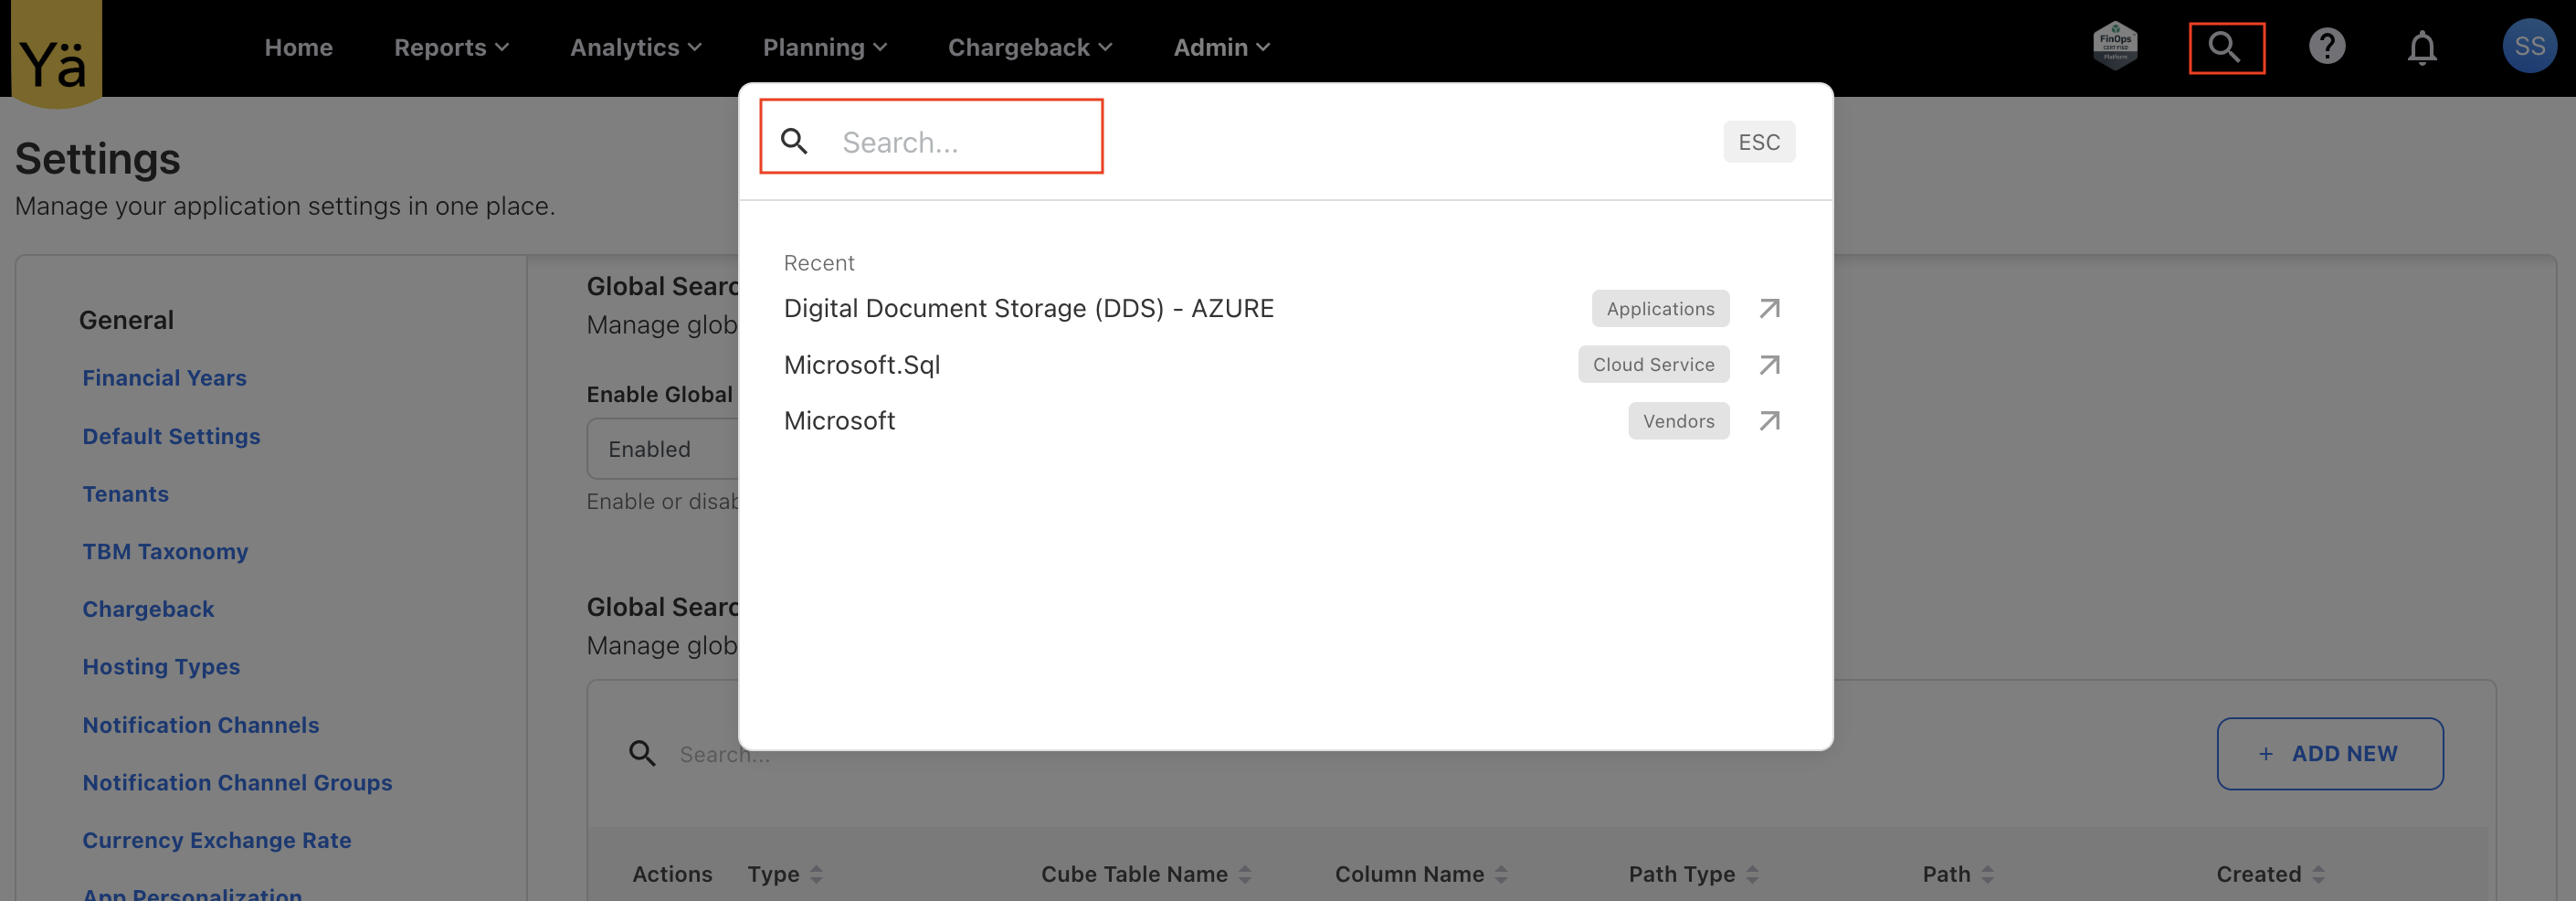
Global Search - A New Search Capability on Menubar
A new Global Search feature has been introduced in the application. This allows end users to search across configured resource types (standard & custom dashboards, or reports) directly from menubar without navigating through multiple dashboards.
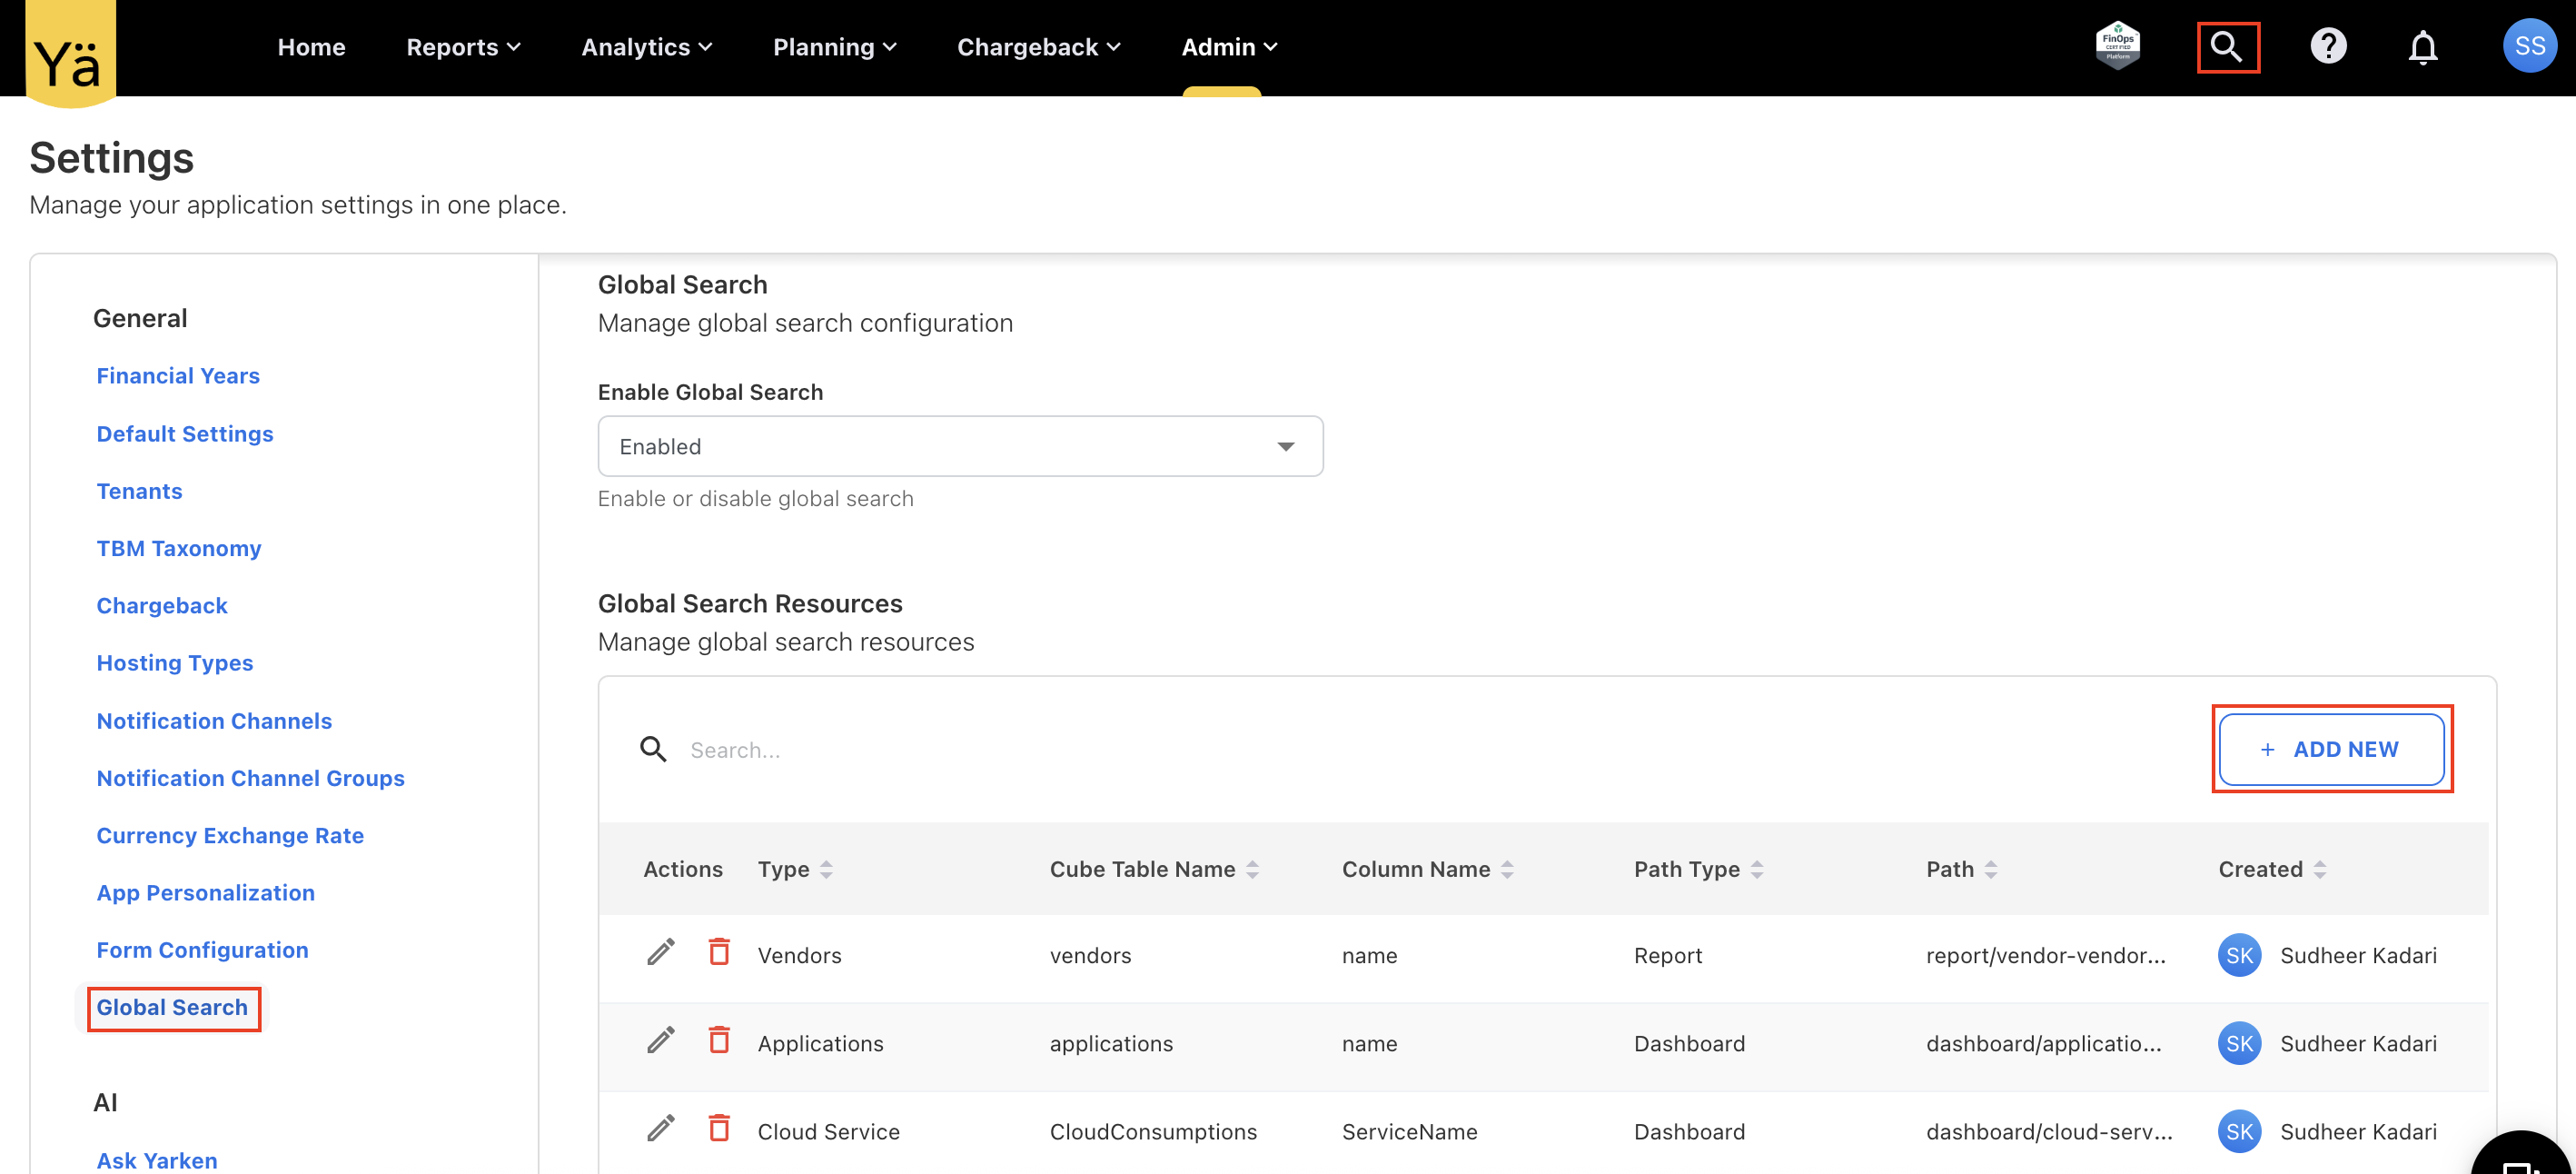
The configuration for global search is managed by the admin through application Settings. While setting it up, the admin can define the following criteria:
-
Resource Type – The type of resource to be made searchable.
-
Cube Table Name – The data source table to query.
-
Column Name – The specific column(s) to be included in search.
-
Path & Path Type – To determine navigation context and hierarchy.
-
Filter Field – To apply additional search filters.
Once the global search is enabled by the admin, you can quickly search for configured resource type. This capability can also be disabled if it is not required.
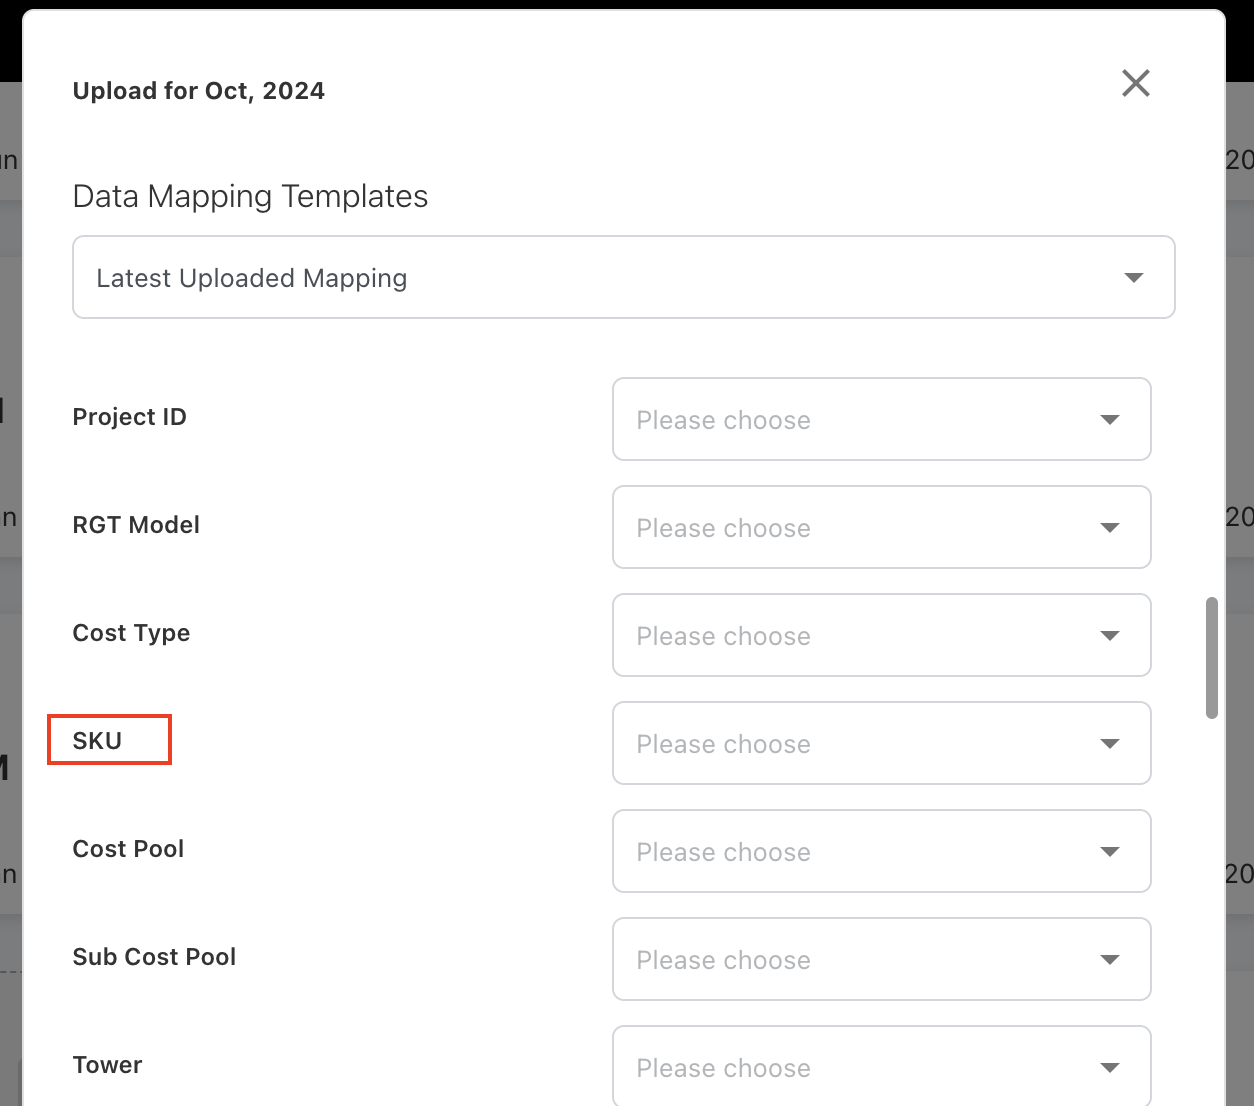
SKU Level Budgeting and Forecasting
We have enabled SKU-level budgeting and forecasting to provide more granular planning and analysis. A new optional field called SKU has been added in the Budget and Forecast planning module. This allows users to define and track spend, budget, and forecast values at the SKU level. Users can also specify the SKU when loading spend to track expenditure at a SKU level.
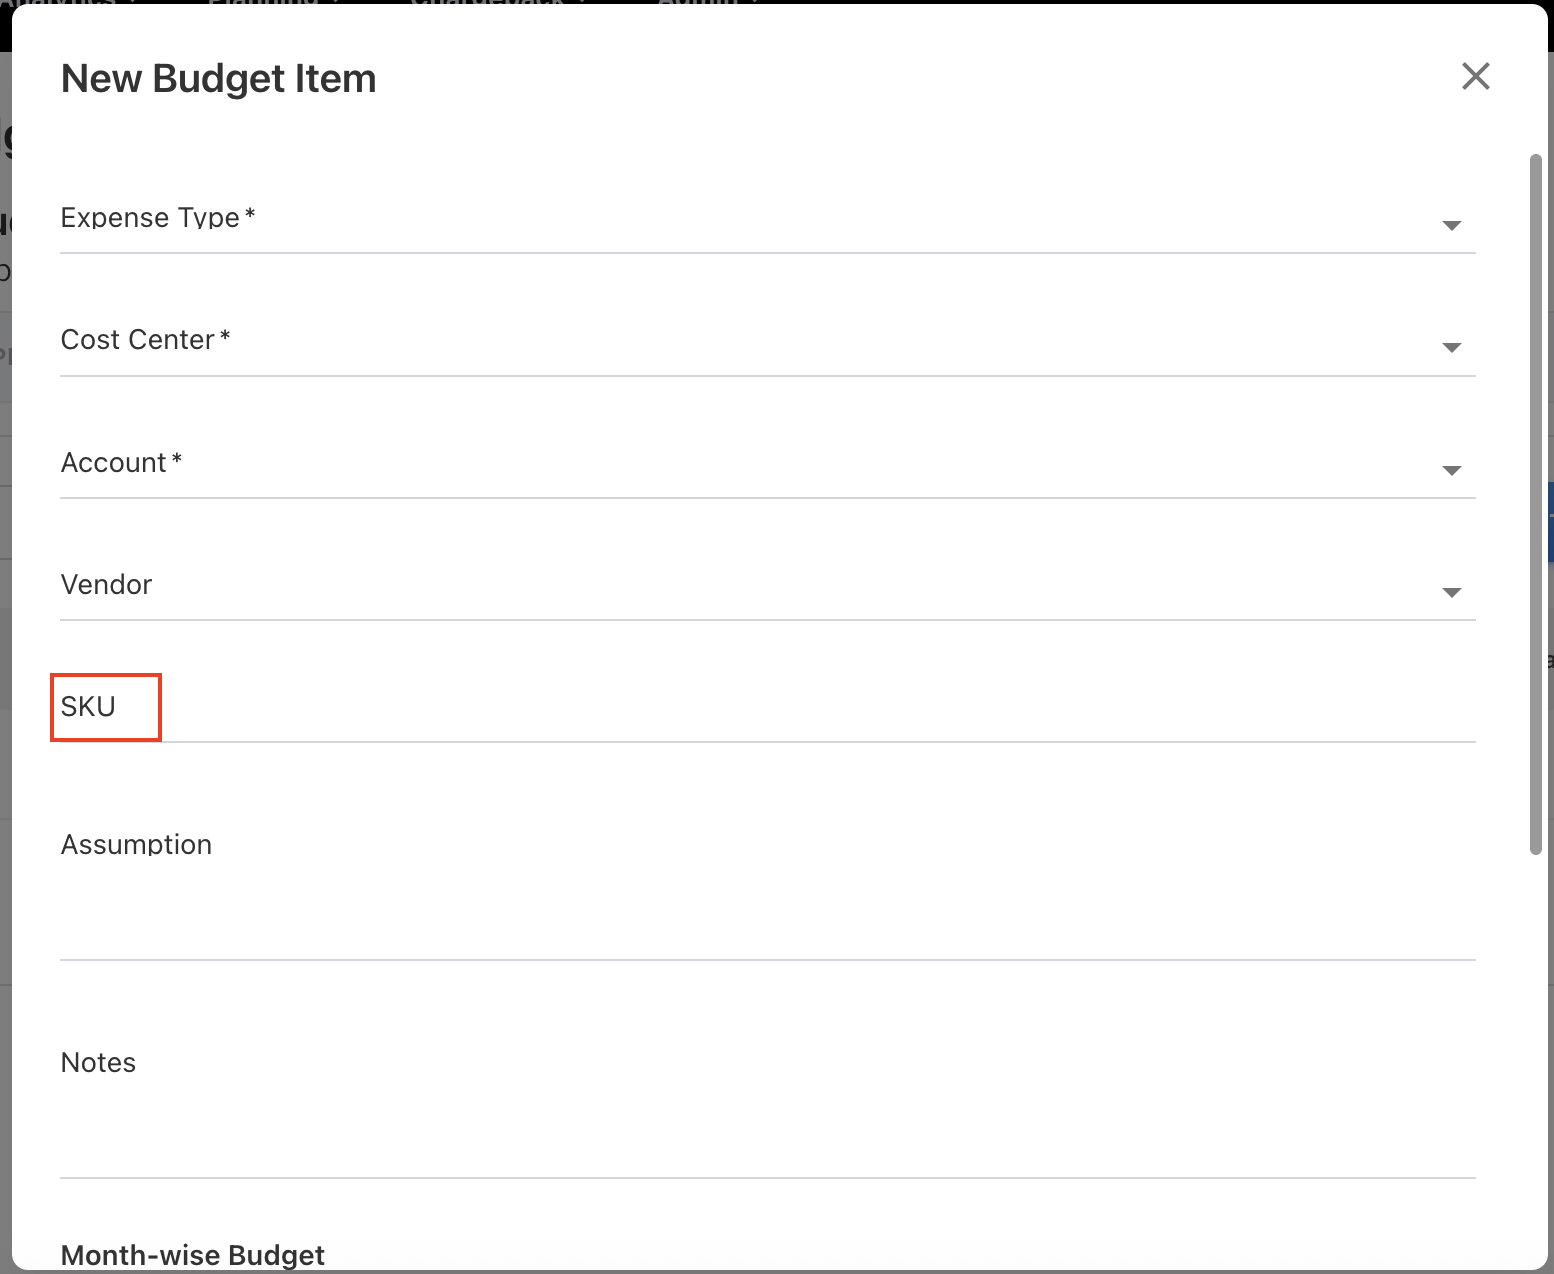
When the SKU is provided, the spend and budget can be compared for a given SKU and available for the reporting. This field can also be enabled through the Form Configuration.
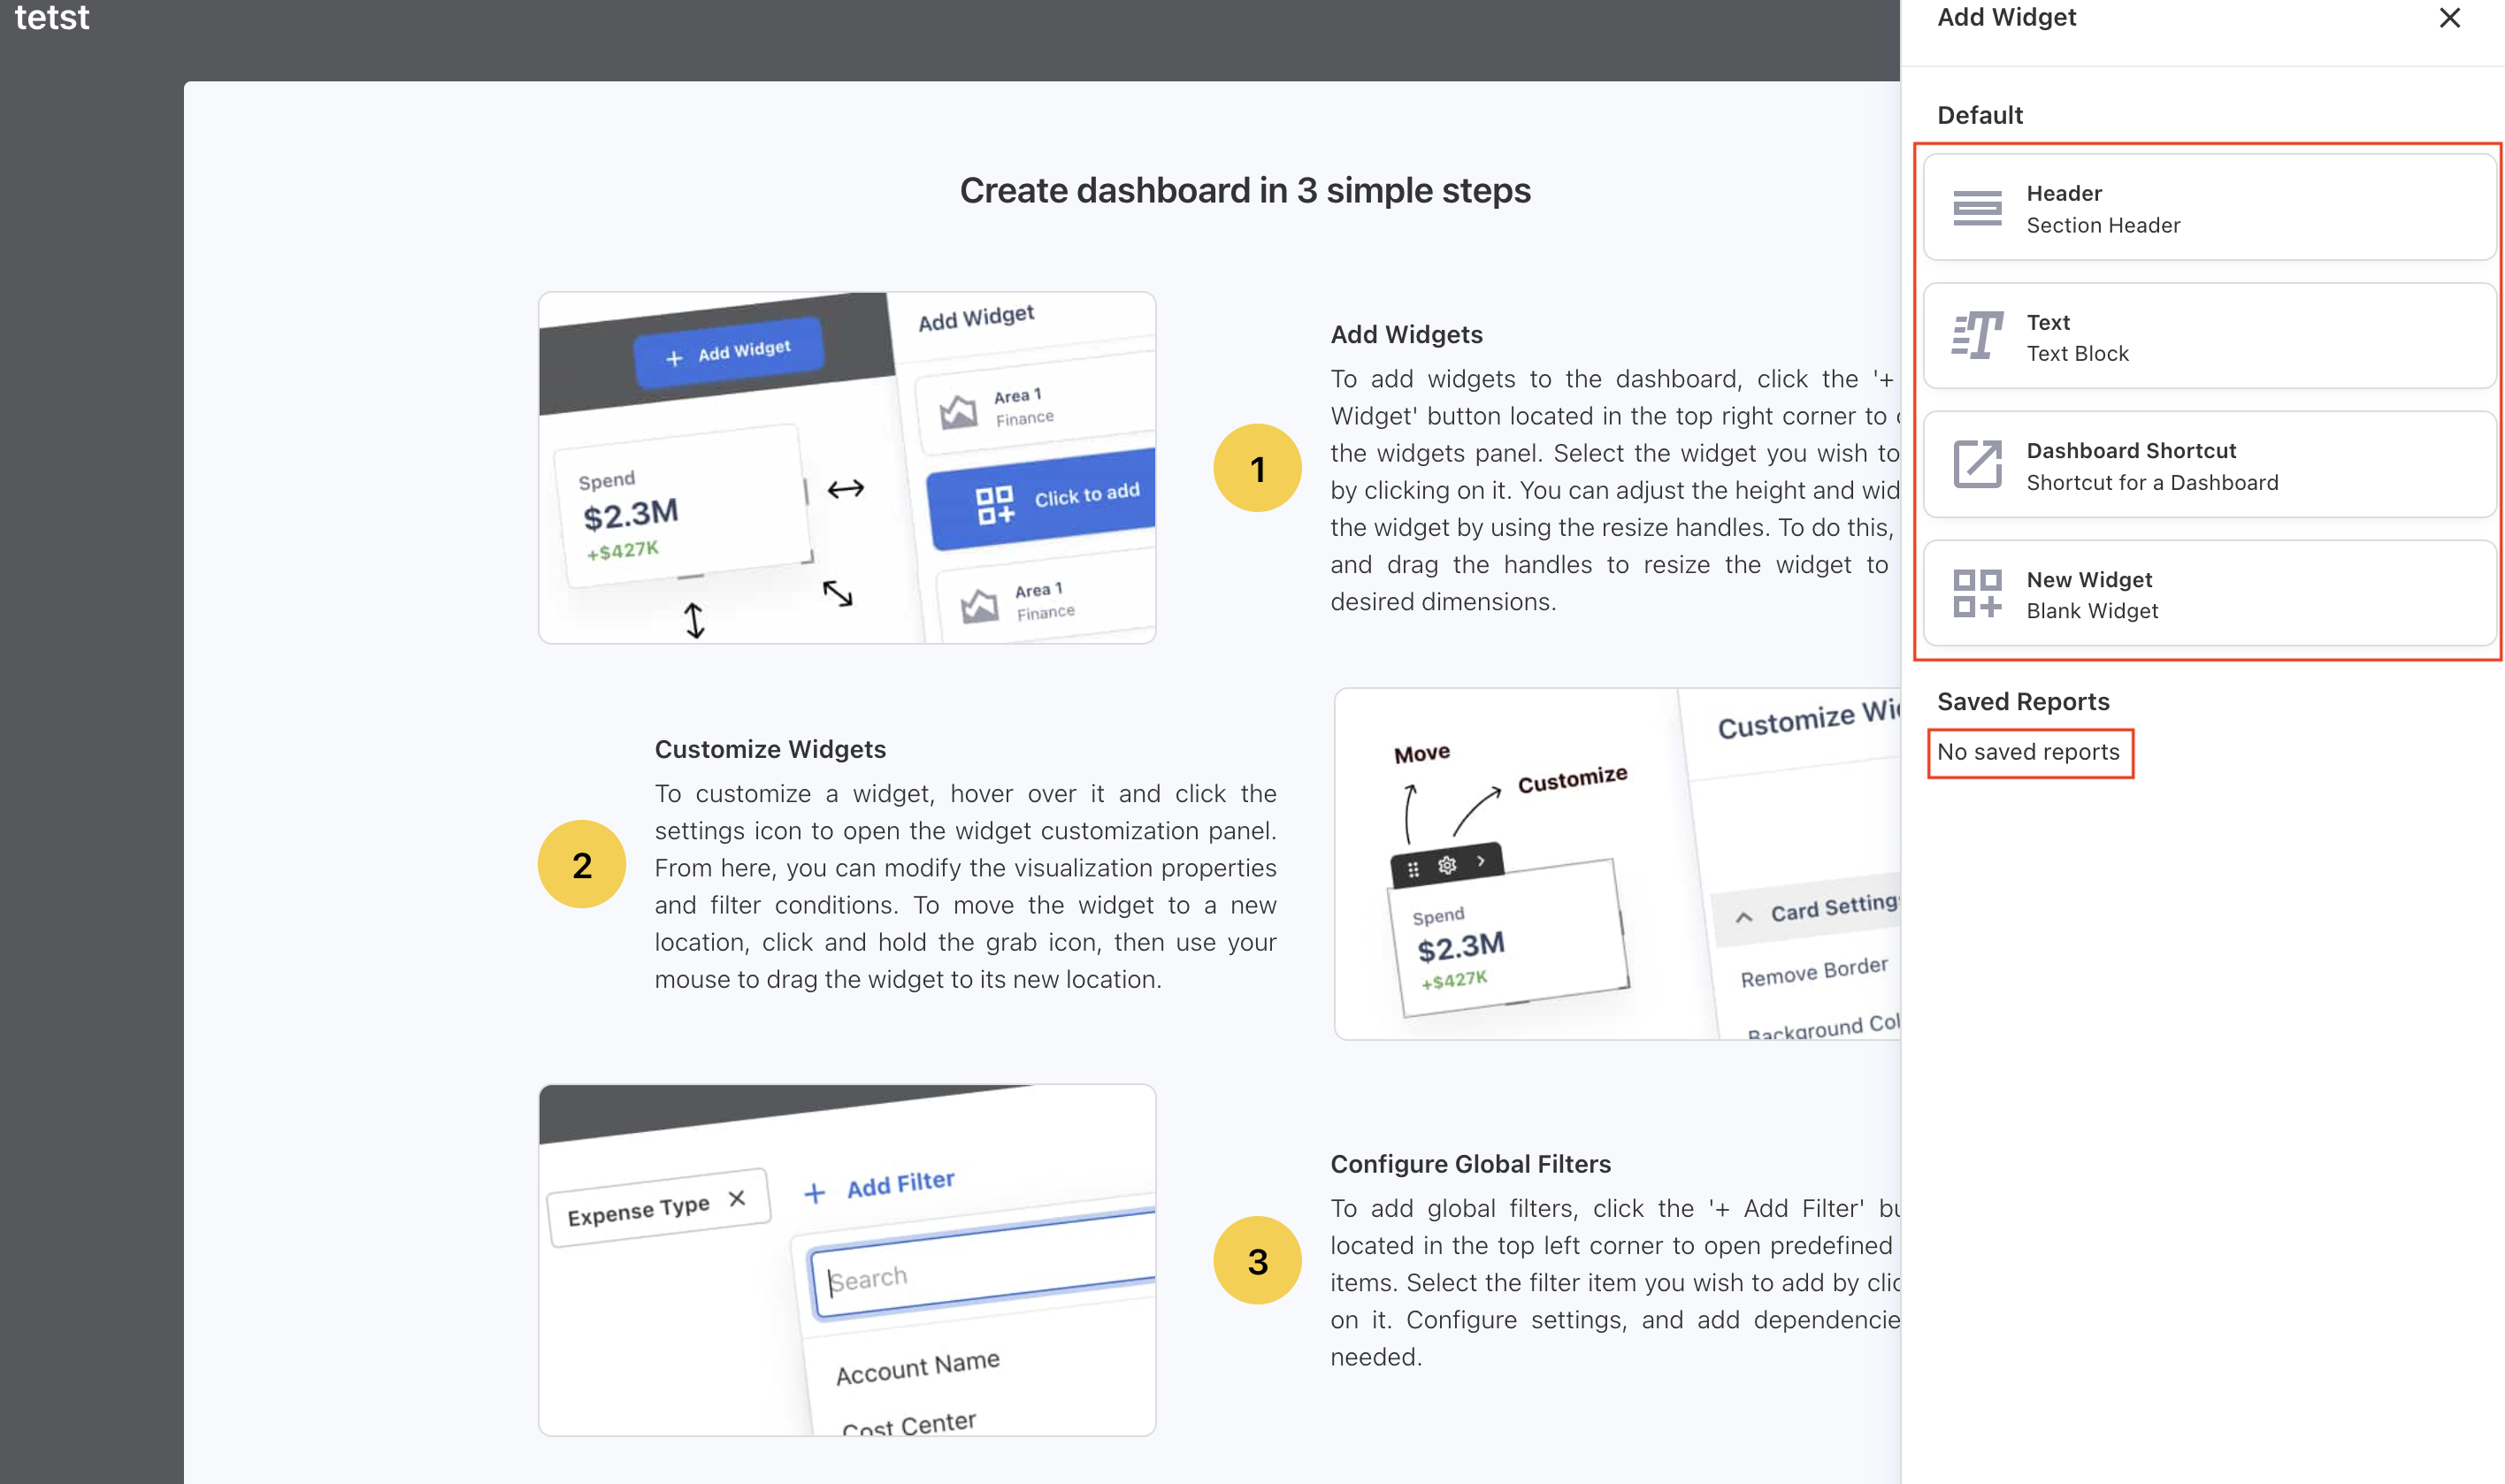
Custom Dashboard Fixes
Previously on the custom dashboard, when no saved reports were available, users were left without any indication or ability to proceed. There was no message explaining the absence of reports, nor an option to create a new one. The issue is addressed and the dashboard now:
-
Displays a clear message No saved reports, indicating that no reports are saved.
-
Provides an option to create a new report directly from the same view.
August 25, 2025
Enhancements and bug fixes
Manual Tenant Configuration
We have introduced a new capability to allow manual tenant setup. Admins can now directly configure the Tenant ID and domain. During configuration, admins also have the option to:
-
Enable Invite Only – restricts access to invited users only.
-
Enable Azure AD Roles – allows role assignments to be mapped from Azure AD roles.
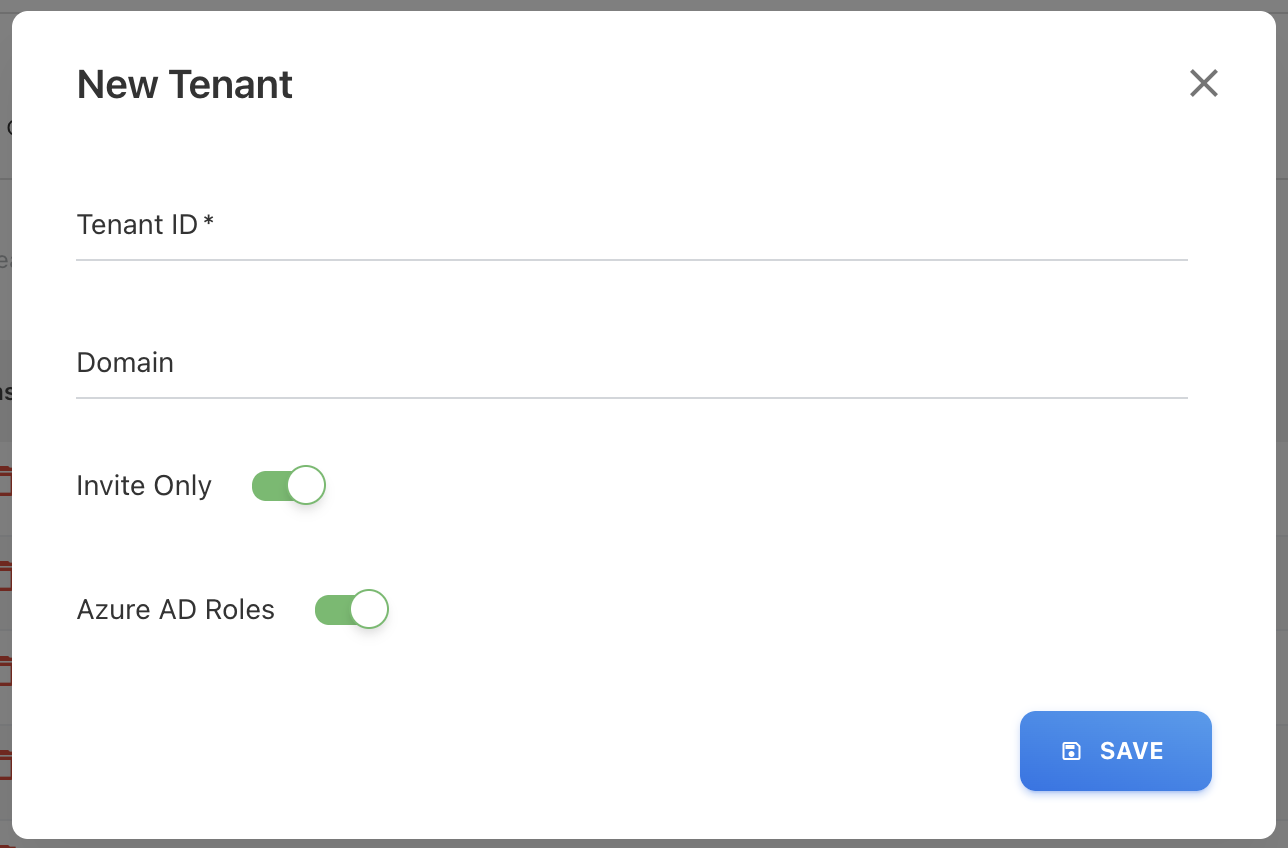
The added M365 tenant is used both for authentication and for collecting M365 license data. Additionally, a delete button has been added so that admins can remove a tenant configuration if it is no longer required.
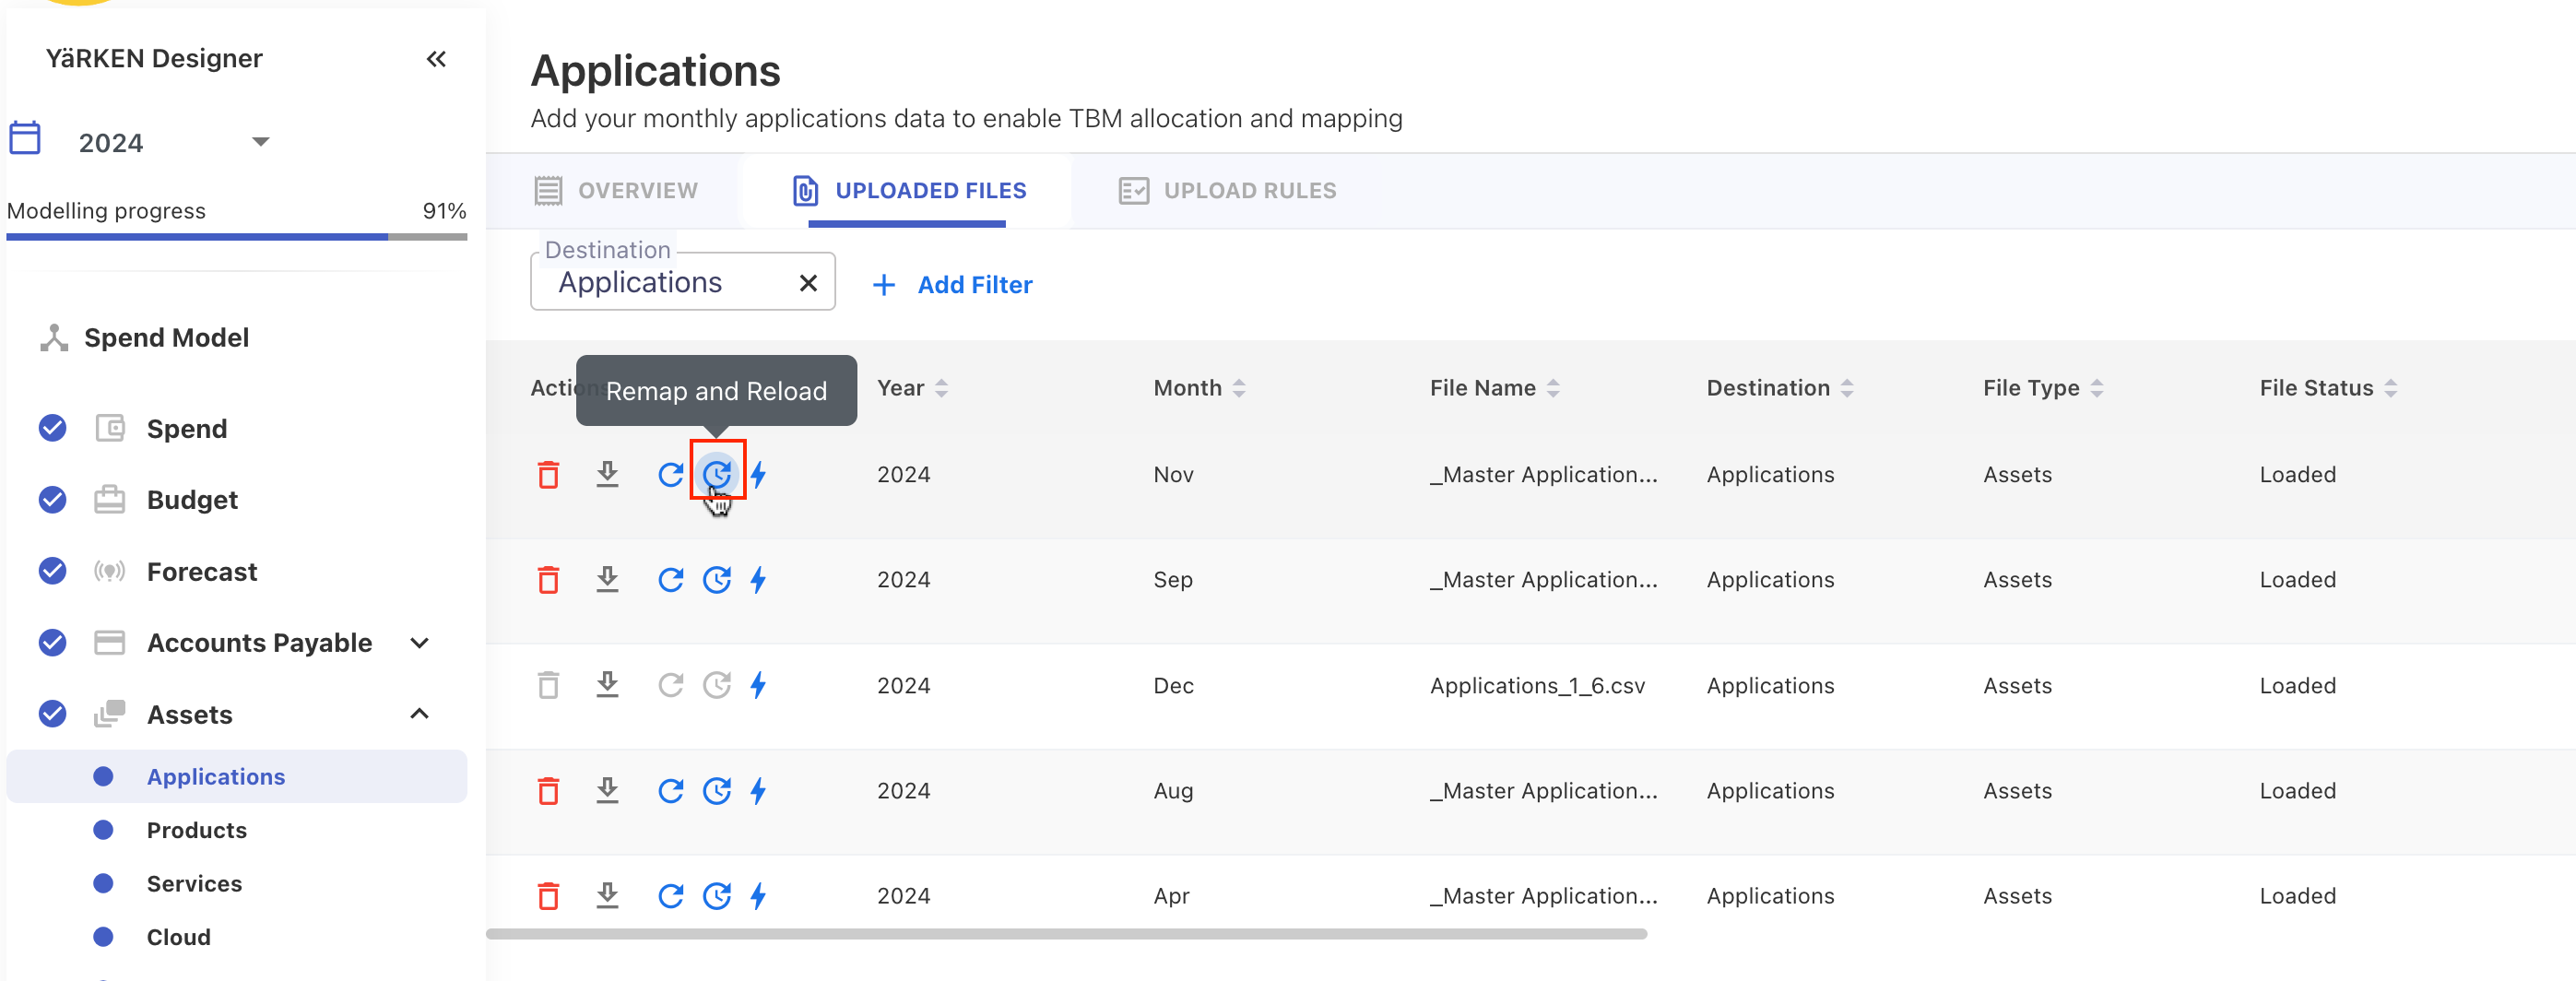
Reload and Remap for All File Types
We have extended the reload and remap functionality for all the file types. Previosly it was only added for spend files.
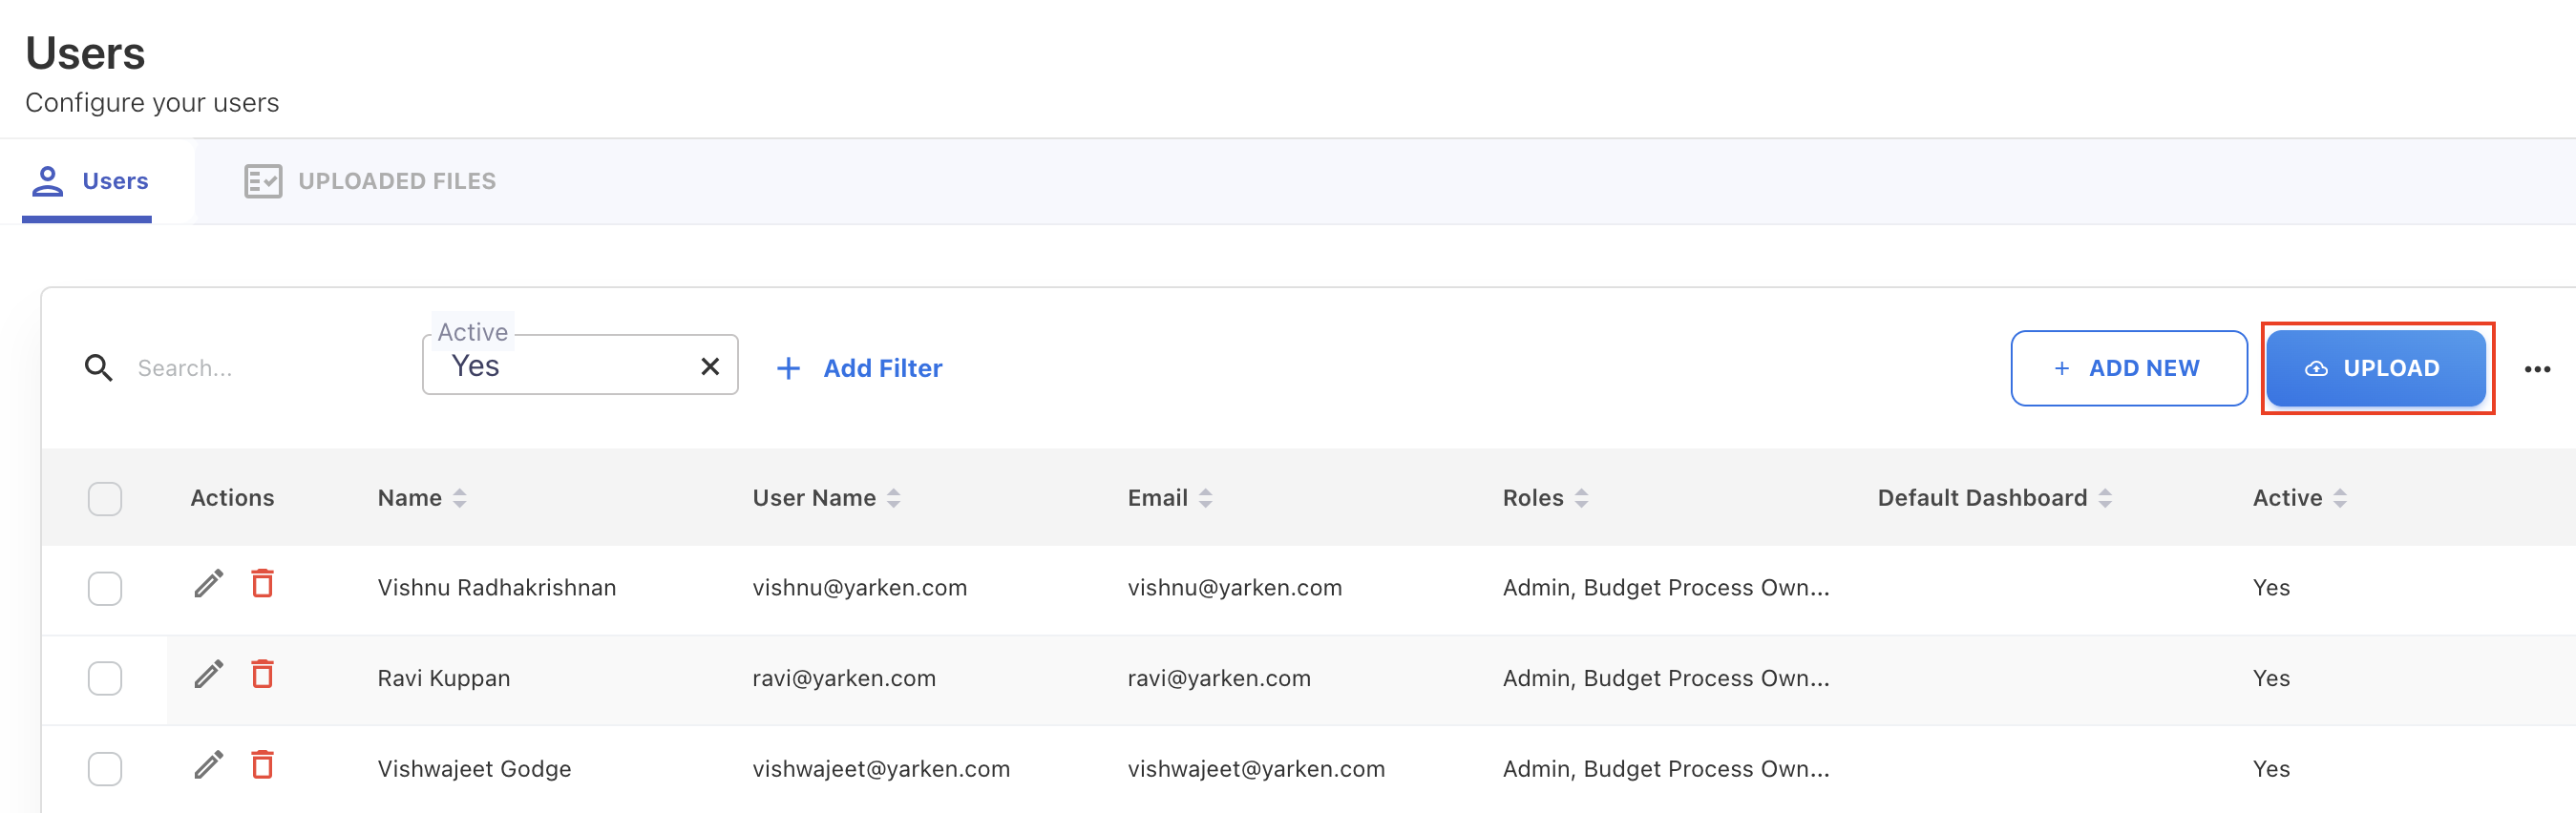
Multiple User Upload via CSV
A new capability has been added to streamline user management. Admins can now upload a CSV file containing user details directly from the Users page. This allows quick creation of multiple users in a single step.
-
If a username already exists, the user’s details are automatically updated instead of creating a duplicate.
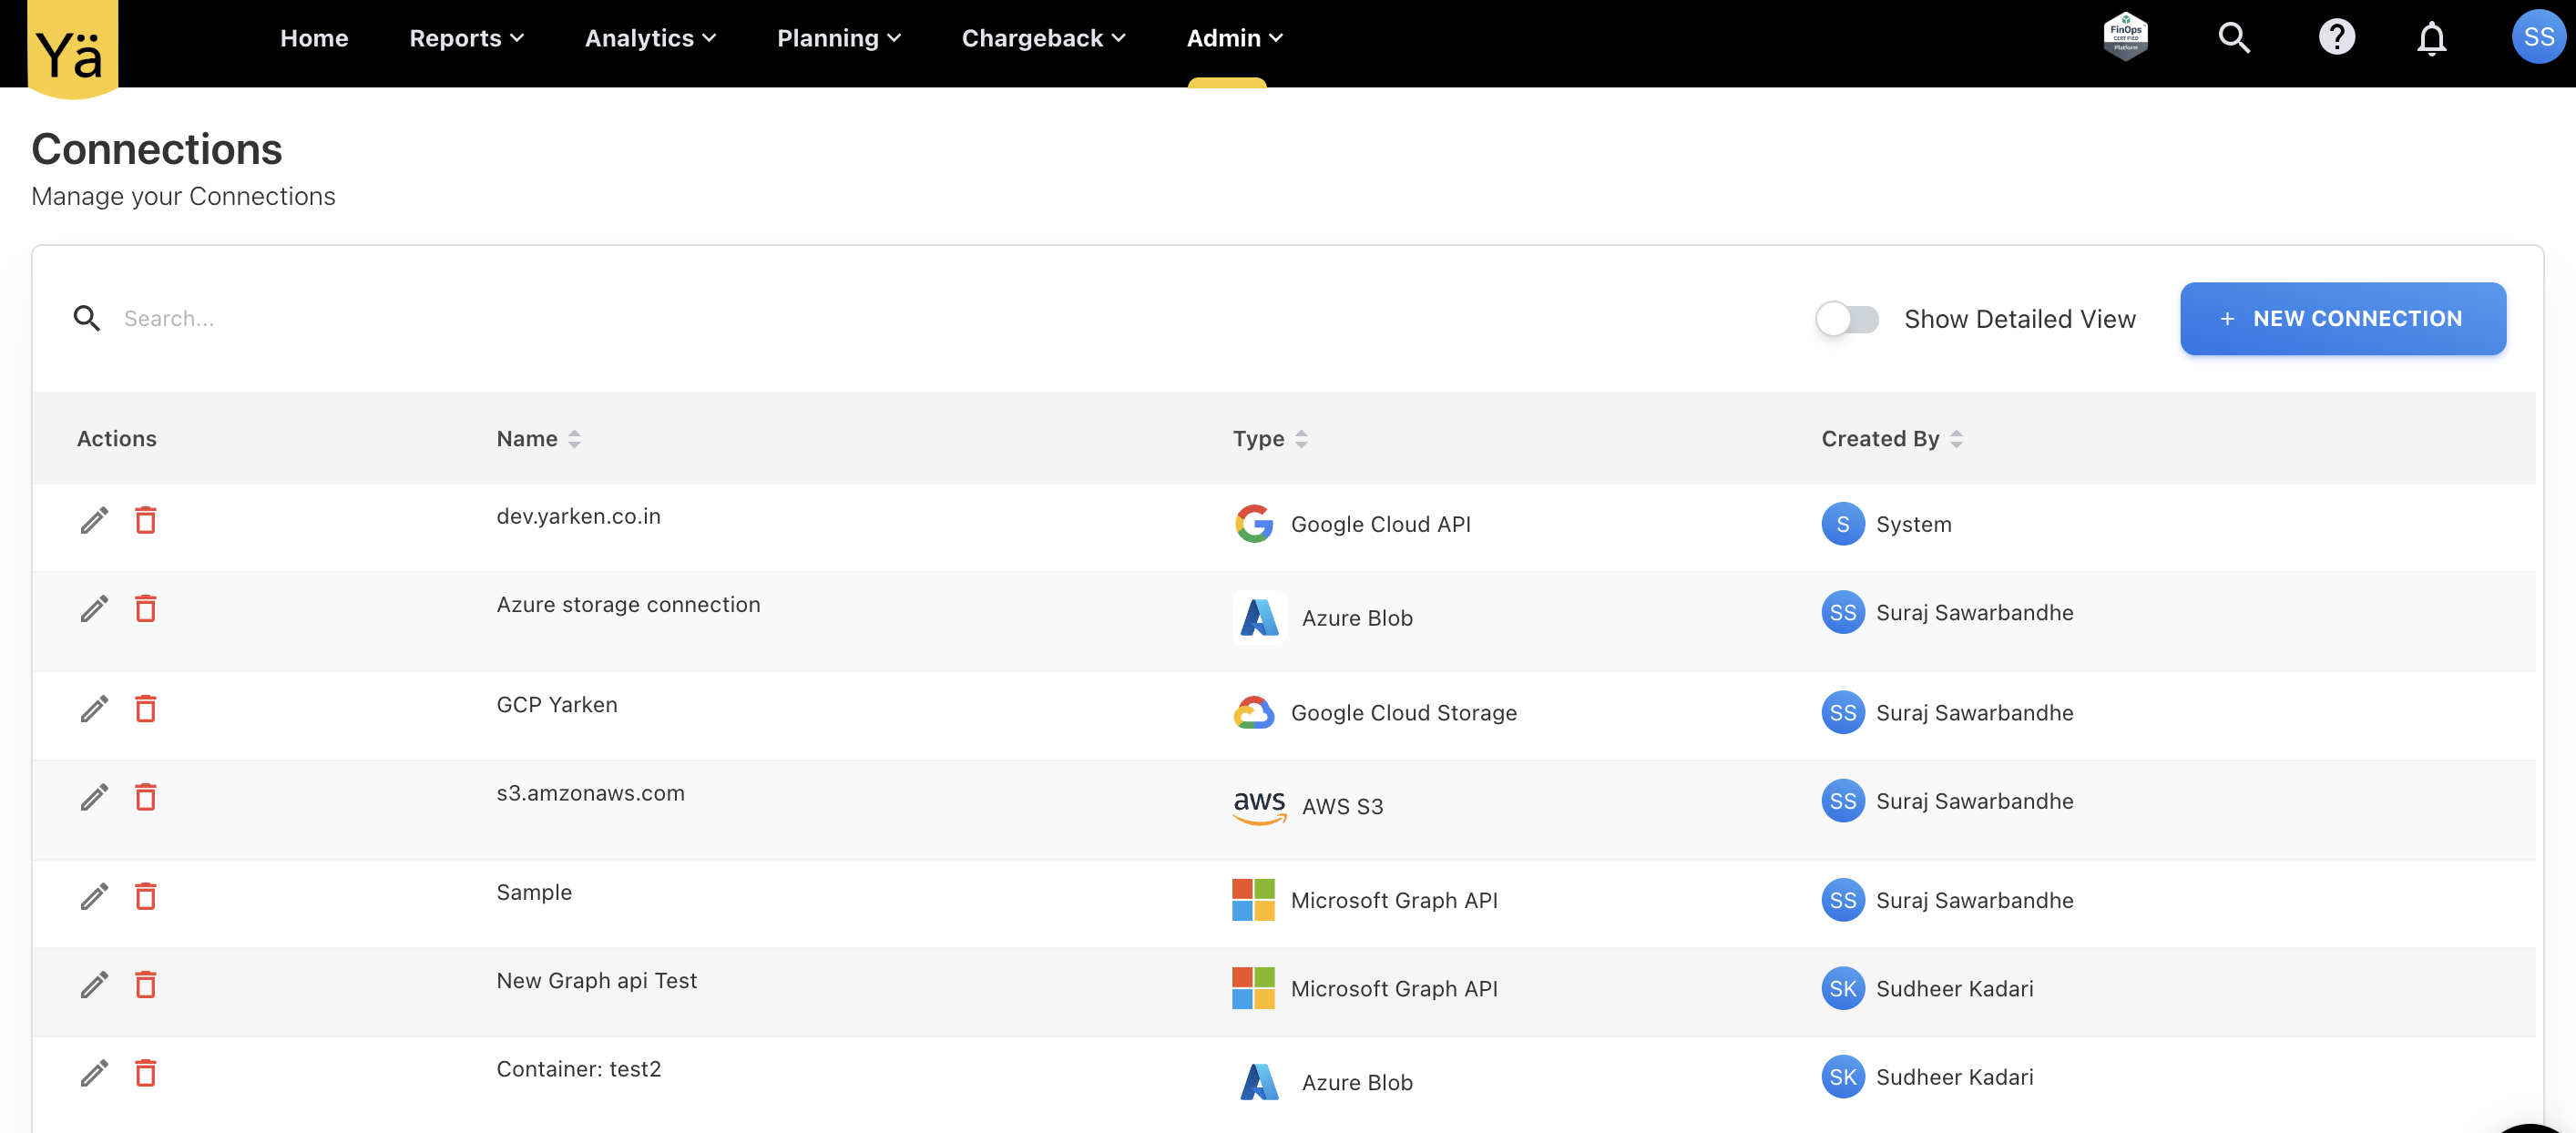
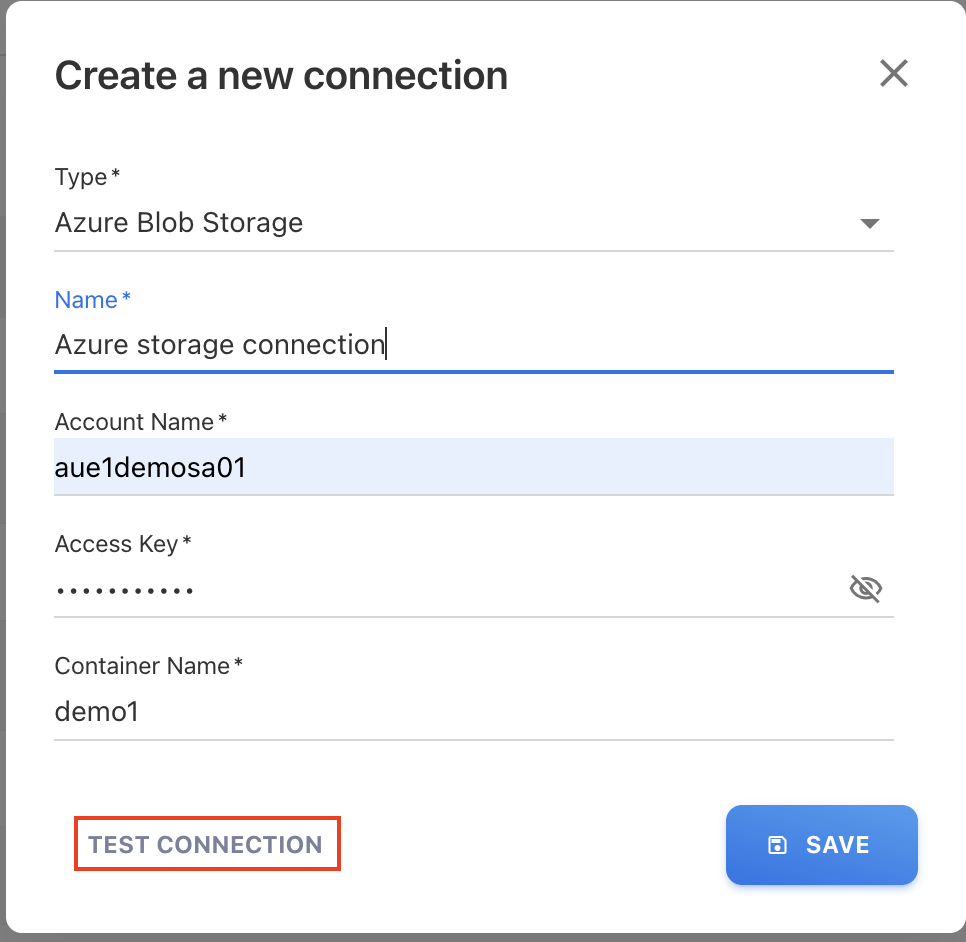
Piipeline - Manage the Connections
A new option to manage connections has been added to the Pipeline feature. Users can now:
-
Define new connections for various cloud storage types.
-
Edit or delete existing connections.
-
Validate connection credentials.
A TEST CONNECTION button is provided to verify the entered credentials before saving. This validation can also be used on existing connections to ensure they remain valid.
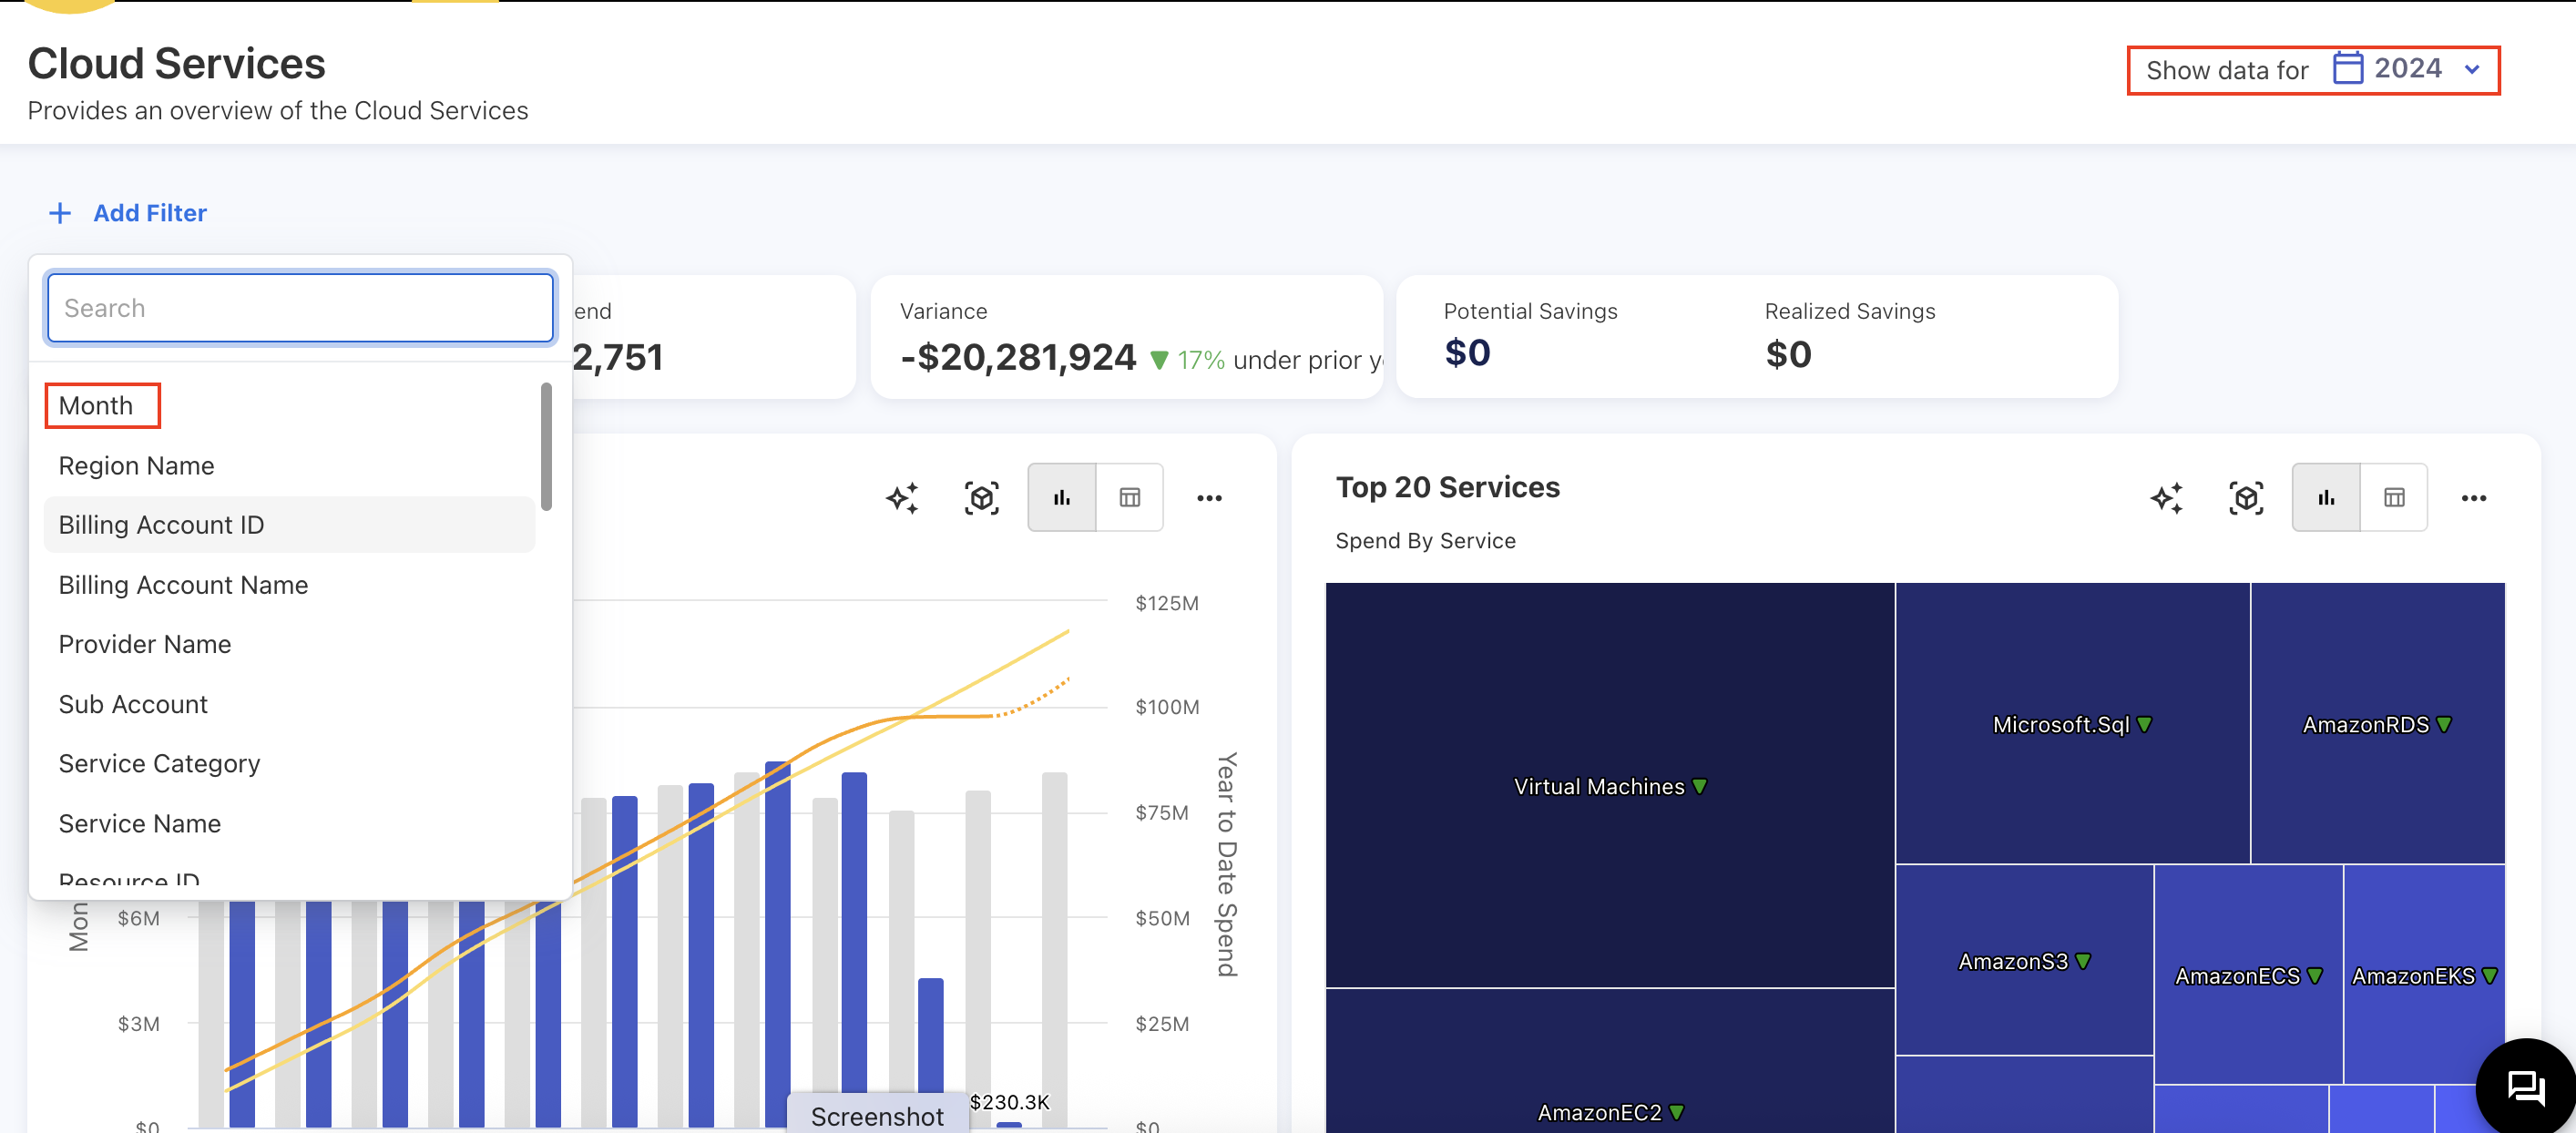
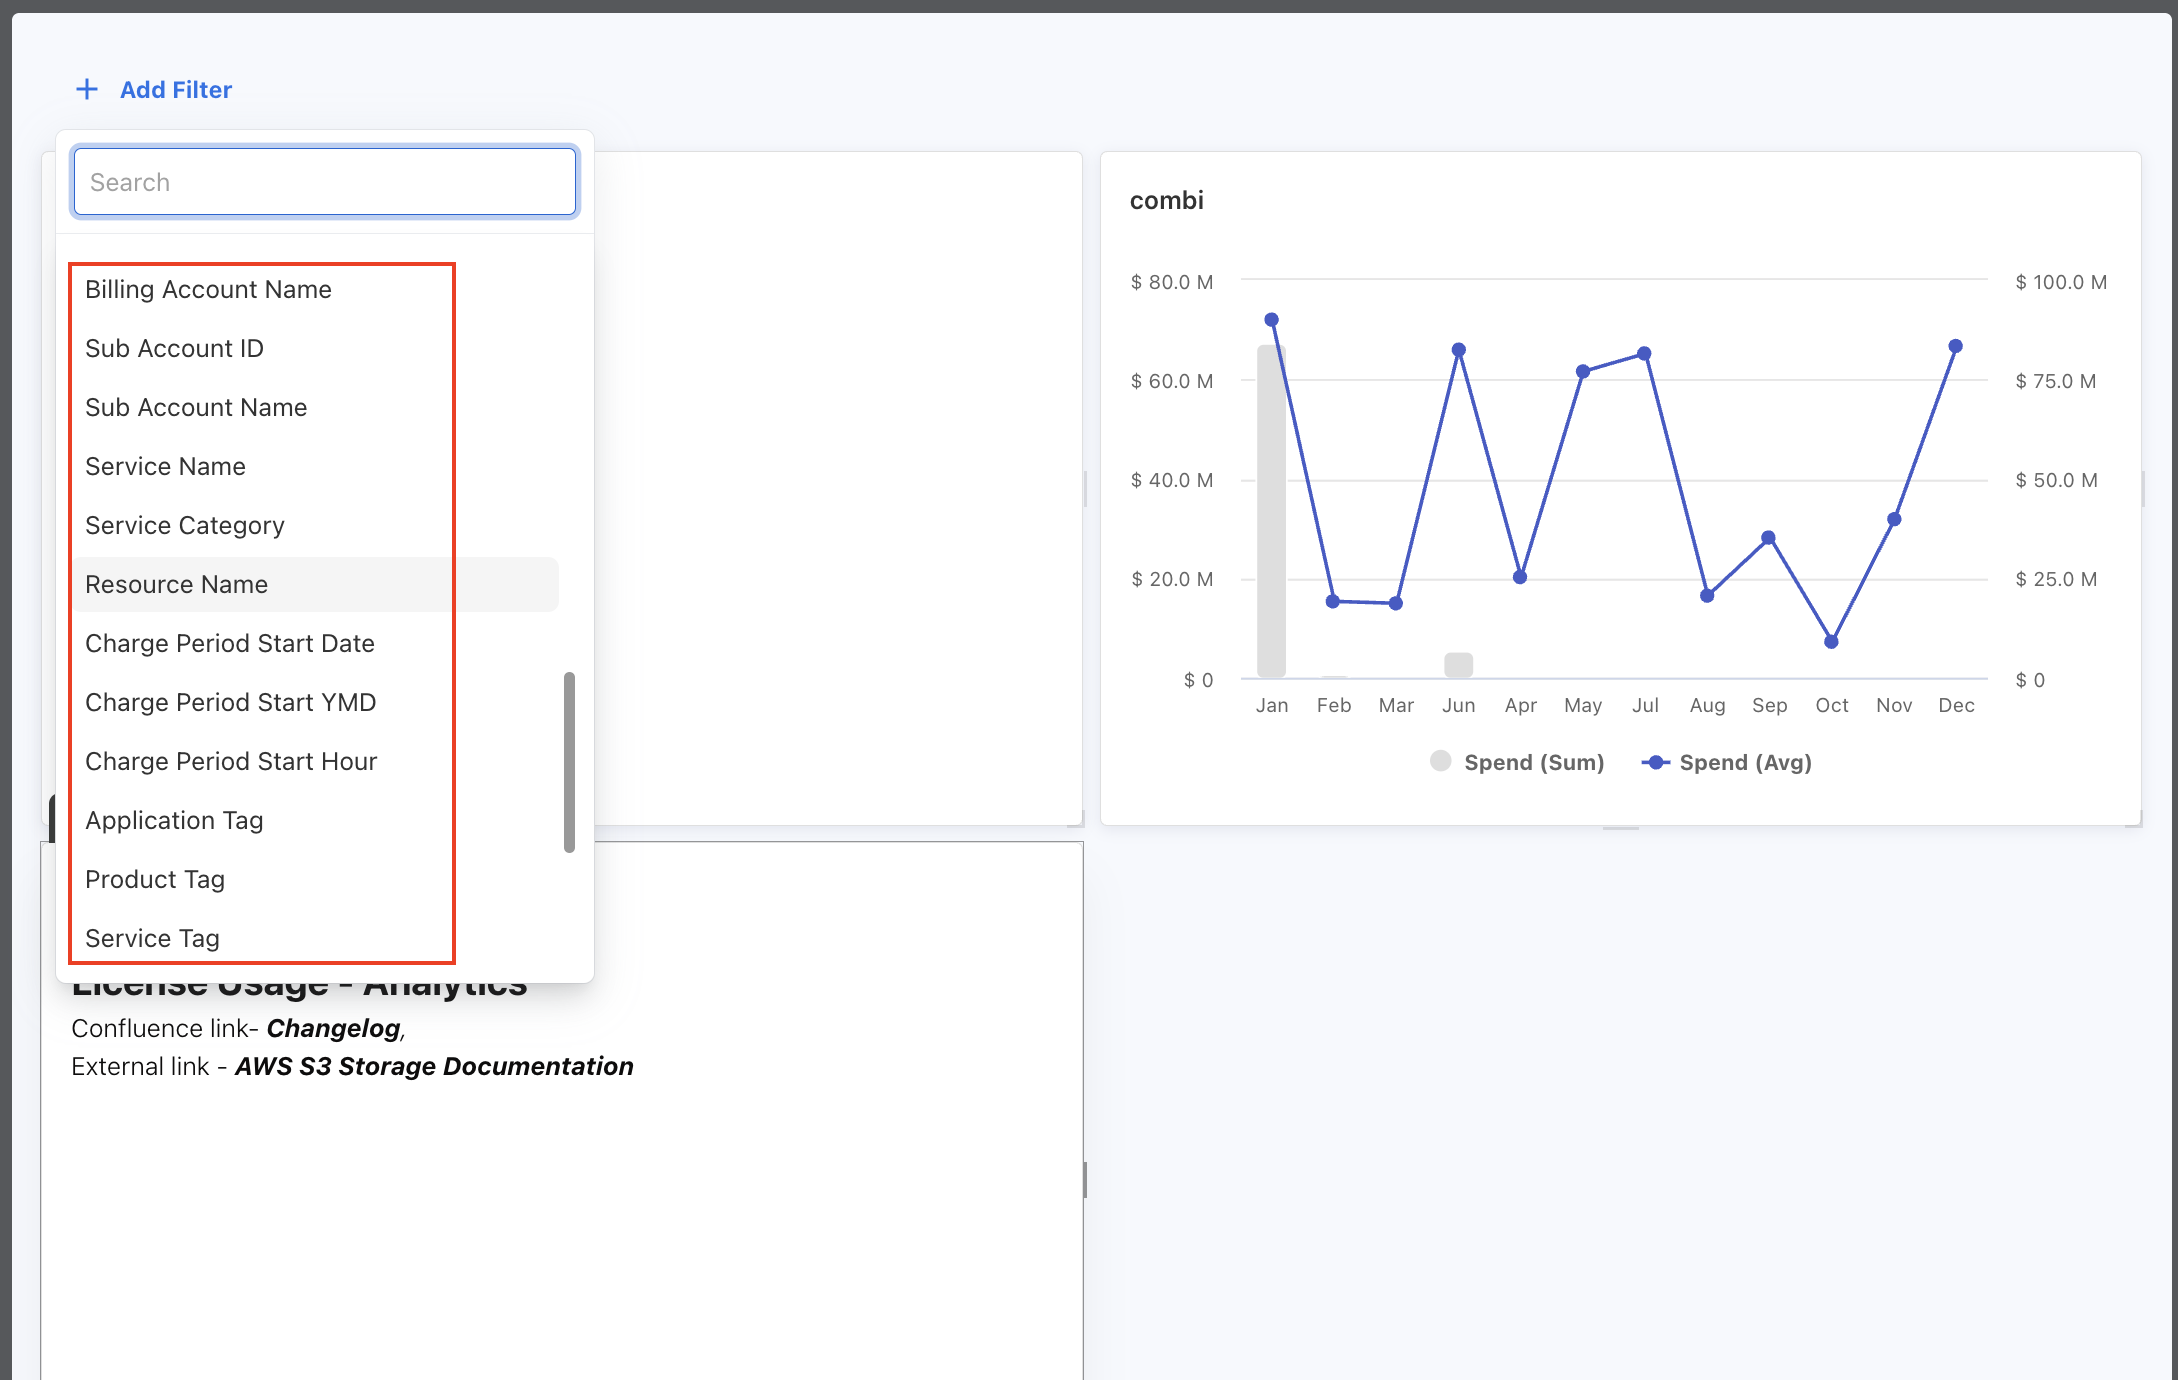
Cloud Dashboards - Month Filter Update
The following changes have been applied across all cloud dashboards:
-
The default global month filter has been relocated under the Add Filter option. By default, dashboards no longer display a specific month’s data. Users must manually add the month filter to view monthly data, with the ability to select multiple months.
-
A global year filter is now available by default on the dashboard.
-
The Spend YTD KPI has been removed.
CSV Download Data Formatting Issue
Previously, we used the XLSX package to convert and download data as CSV files. However, due to the package’s default behavior, number-type strings were automatically reformatted, causing discrepancies in the actual data.
To resolve this, we have updated the process to bypass the XLSX package and directly generate CSV files. Now, all field and row values are wrapped in quotation marks, ensuring data format preservation and consistency.
August 18, 2025
Bug fix
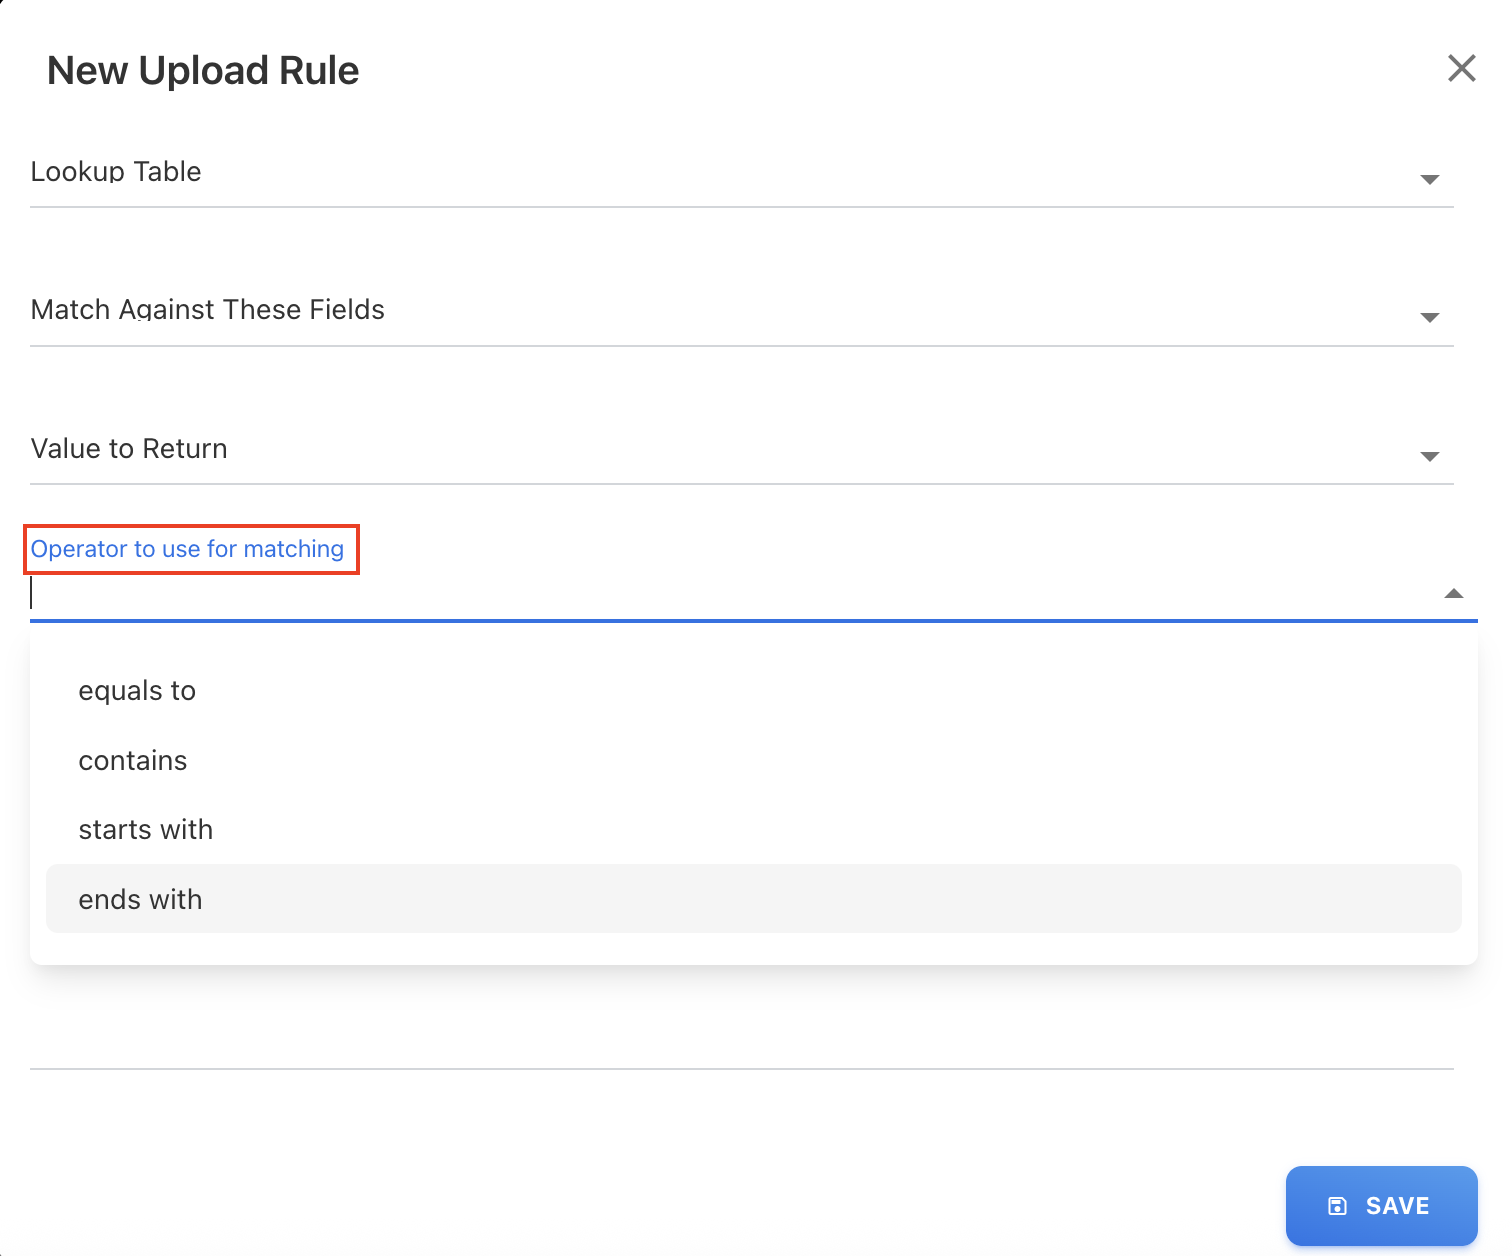
Upload Rule - Matching Criteria in Lookup Rule Type
In the Upload Rules, the Lookup rule type was not performing exact matches and occasionally returned incorrect values due to the recent field updates in this rule type. The rule sometimes provided partial matches instead of the complete value. To address this, we have introduced a new field called Operator to use for matching, which allows users to define the matching criteria. The available options are:
-
equals to
-
contains
-
starts with
-
ends with
This ensures more accurate results when applying lookup rules during data upload.
August 11, 2025
Enhancements and bug fixes
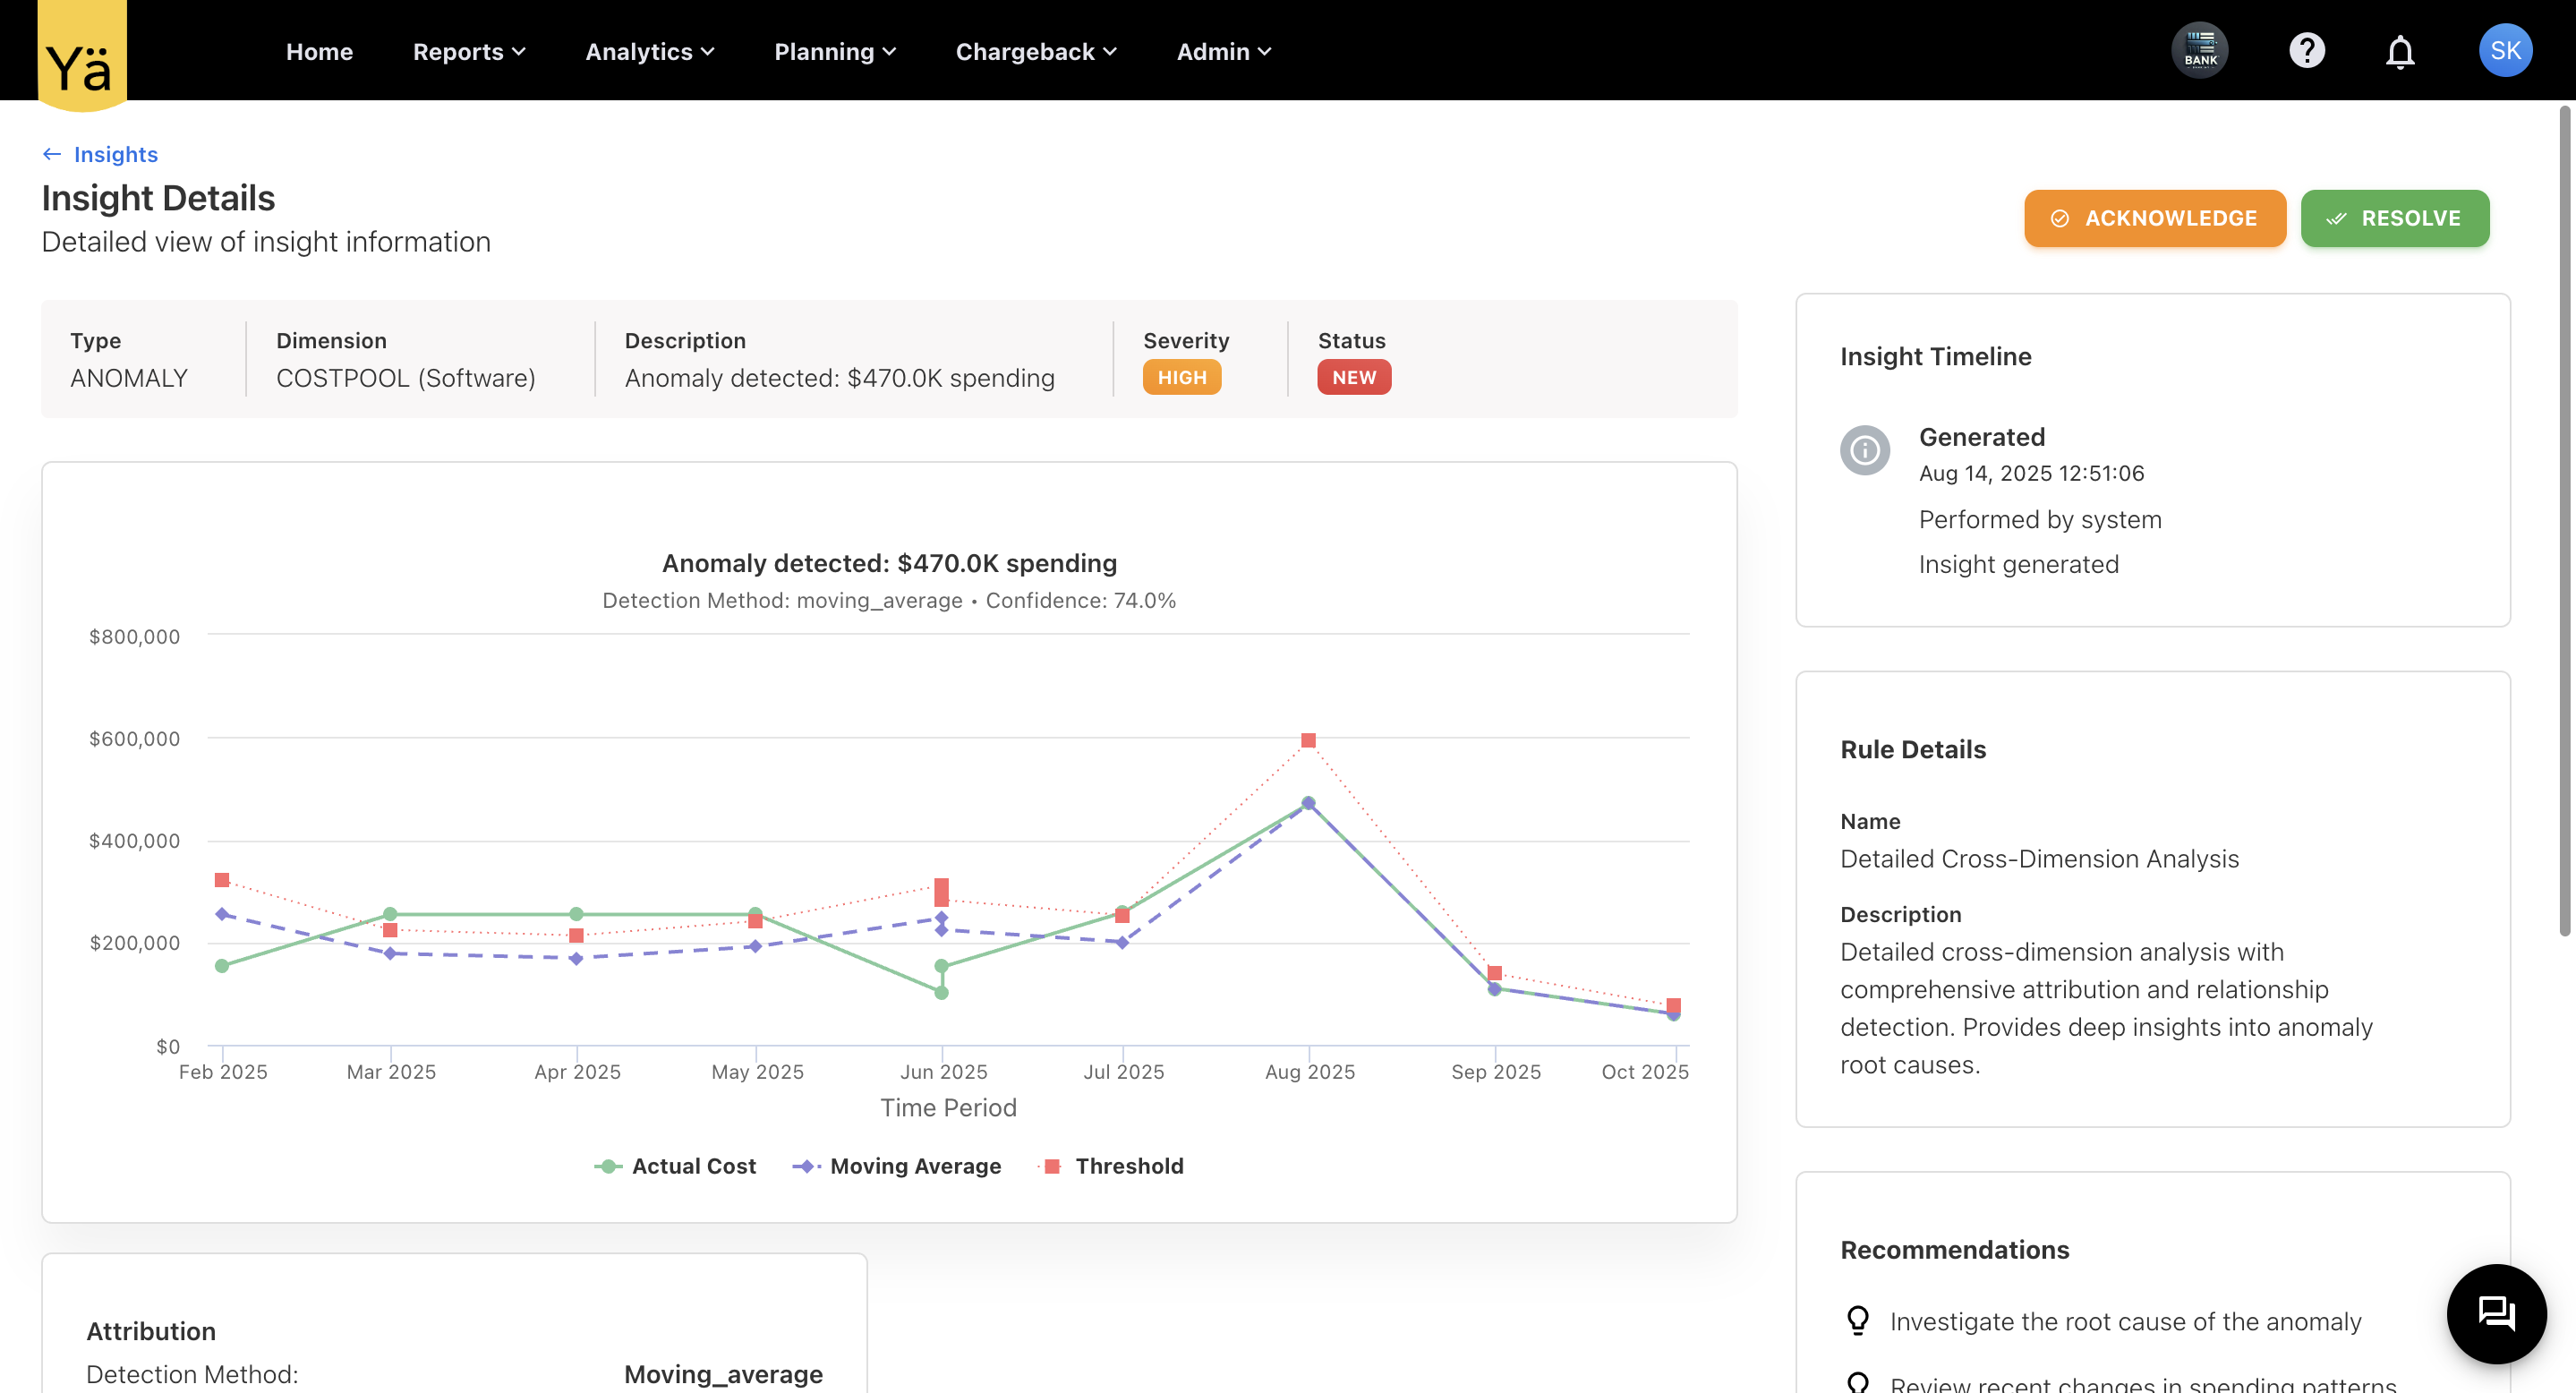
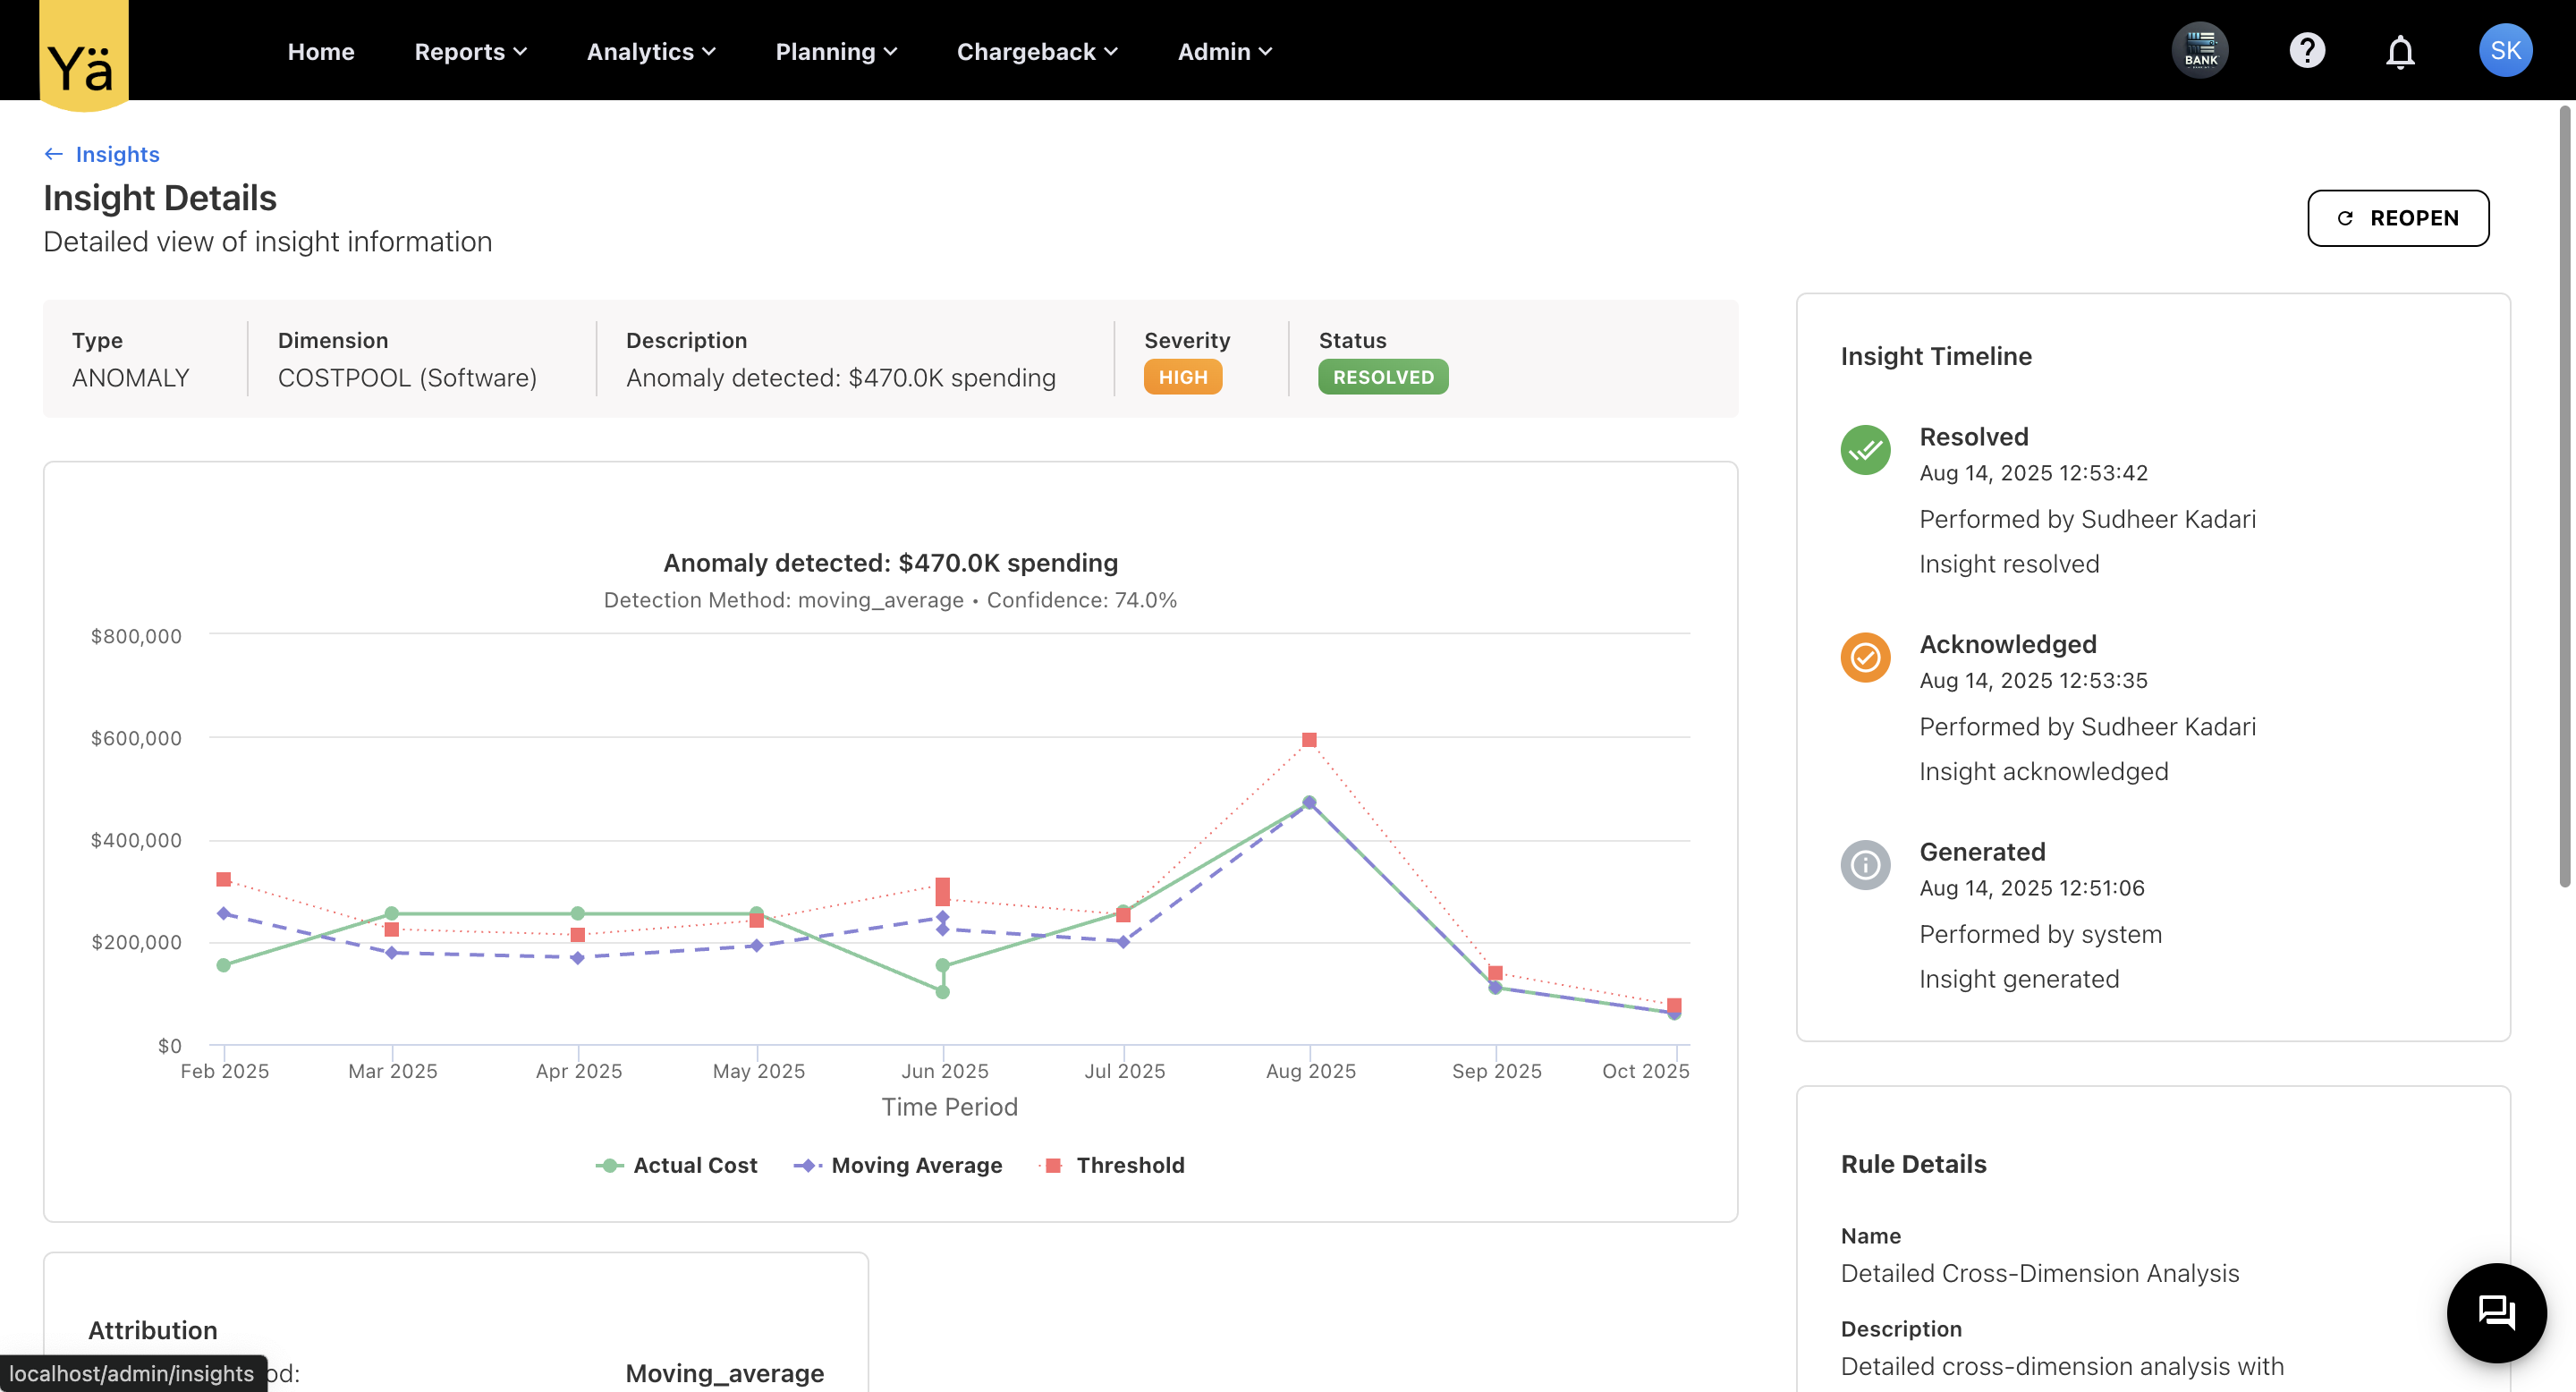
Insights - A New Feature for Anomaly Detection
We’re thrilled to announce Insights, a powerful new feature designed to elevate your FinOps and TBM practices with rule-based intelligence. With Insights, you can now automatically detect anomalies, explain cost trends, and uncover optimization opportunities across both cloud and non-cloud spend.
Key Features & Capabilities
-
Smart Anomaly Detection
-
Detect unexpected spikes, drops, or unusual patterns in spending, budgets, and variances.
-
Proactively identify cost risks before they impact your financial goals.
-
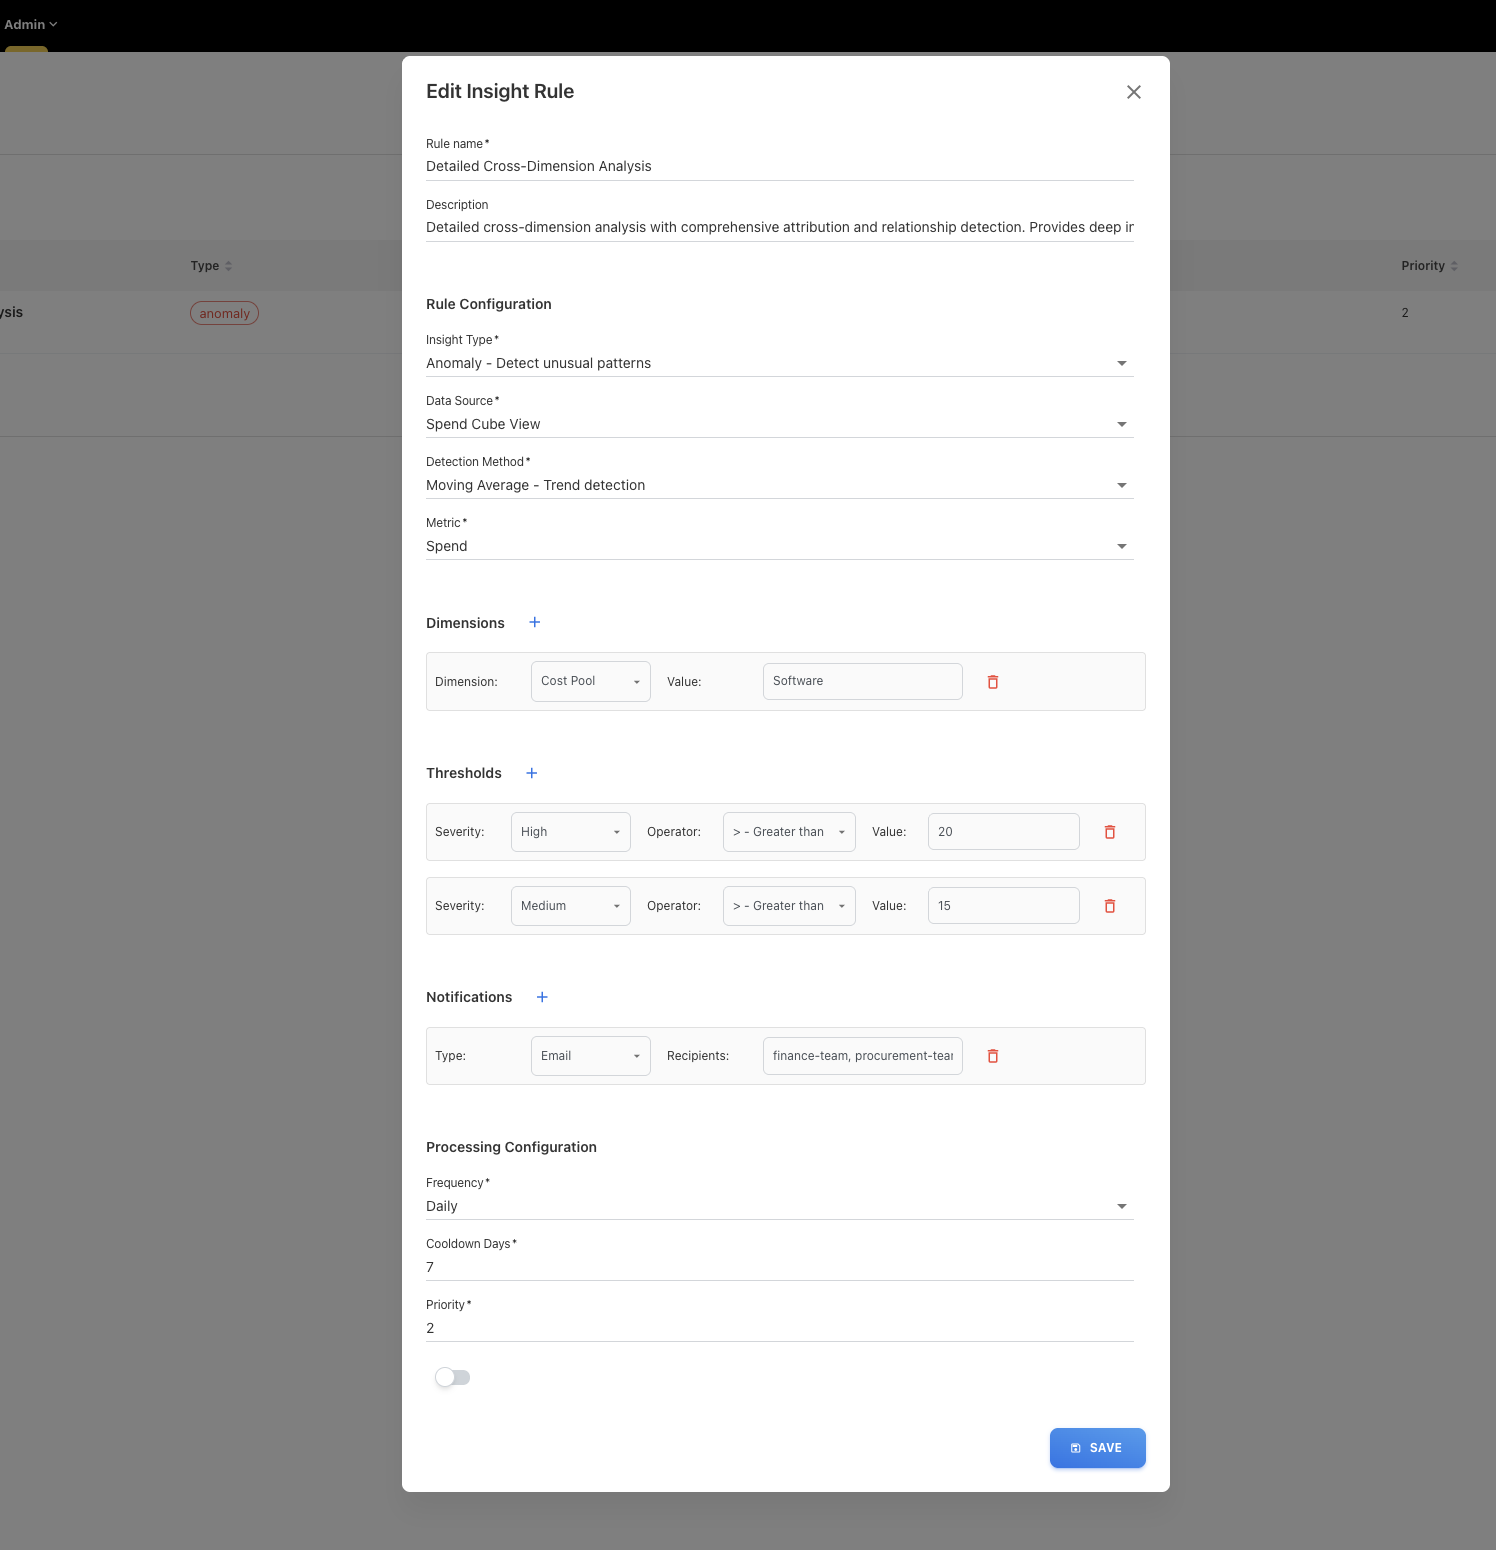
Rule-Based Insight Engine
-
Each insight is generated by a user-defined rule, allowing precise control over what’s monitored.
-
Define custom rules to trigger insights based on your unique business needs.
-
Configure rules by selecting:
-
Data sources (cloud/non-cloud spend, budgets, etc.)
-
Detection methods (thresholds, statistical deviations)
-
Metrics & dimensions (e.g., by provider, cloud service, account)
-
Alert preferences (on Teams, Slack, email)
-
Frequency, cooldown periods, and priority levels for processing insight.
-
-
Interactive Visualization & Analysis
-
After rule execution, view detailed anomaly information directly on interactive charts.
-
Resolution Workflow
-
Detected anomalies can be acknowledged and resolved from the Insights screen, making follow-up simple and trackable.
Insights user flow (Quickstart)
-
Create a Rule – Define what constitutes an anomaly for your business.
-
Get Alerts – Receive notifications when deviations occur.
-
Analyze Insights – Investigate anomalies with visual trend breakdowns.
-
Take Action – Resolve issues or optimize costs based on findings.
This first release focuses on Anomaly Detection, with additional insight types planned for future updates, enabling deeper cost, usage, and performance optimization.
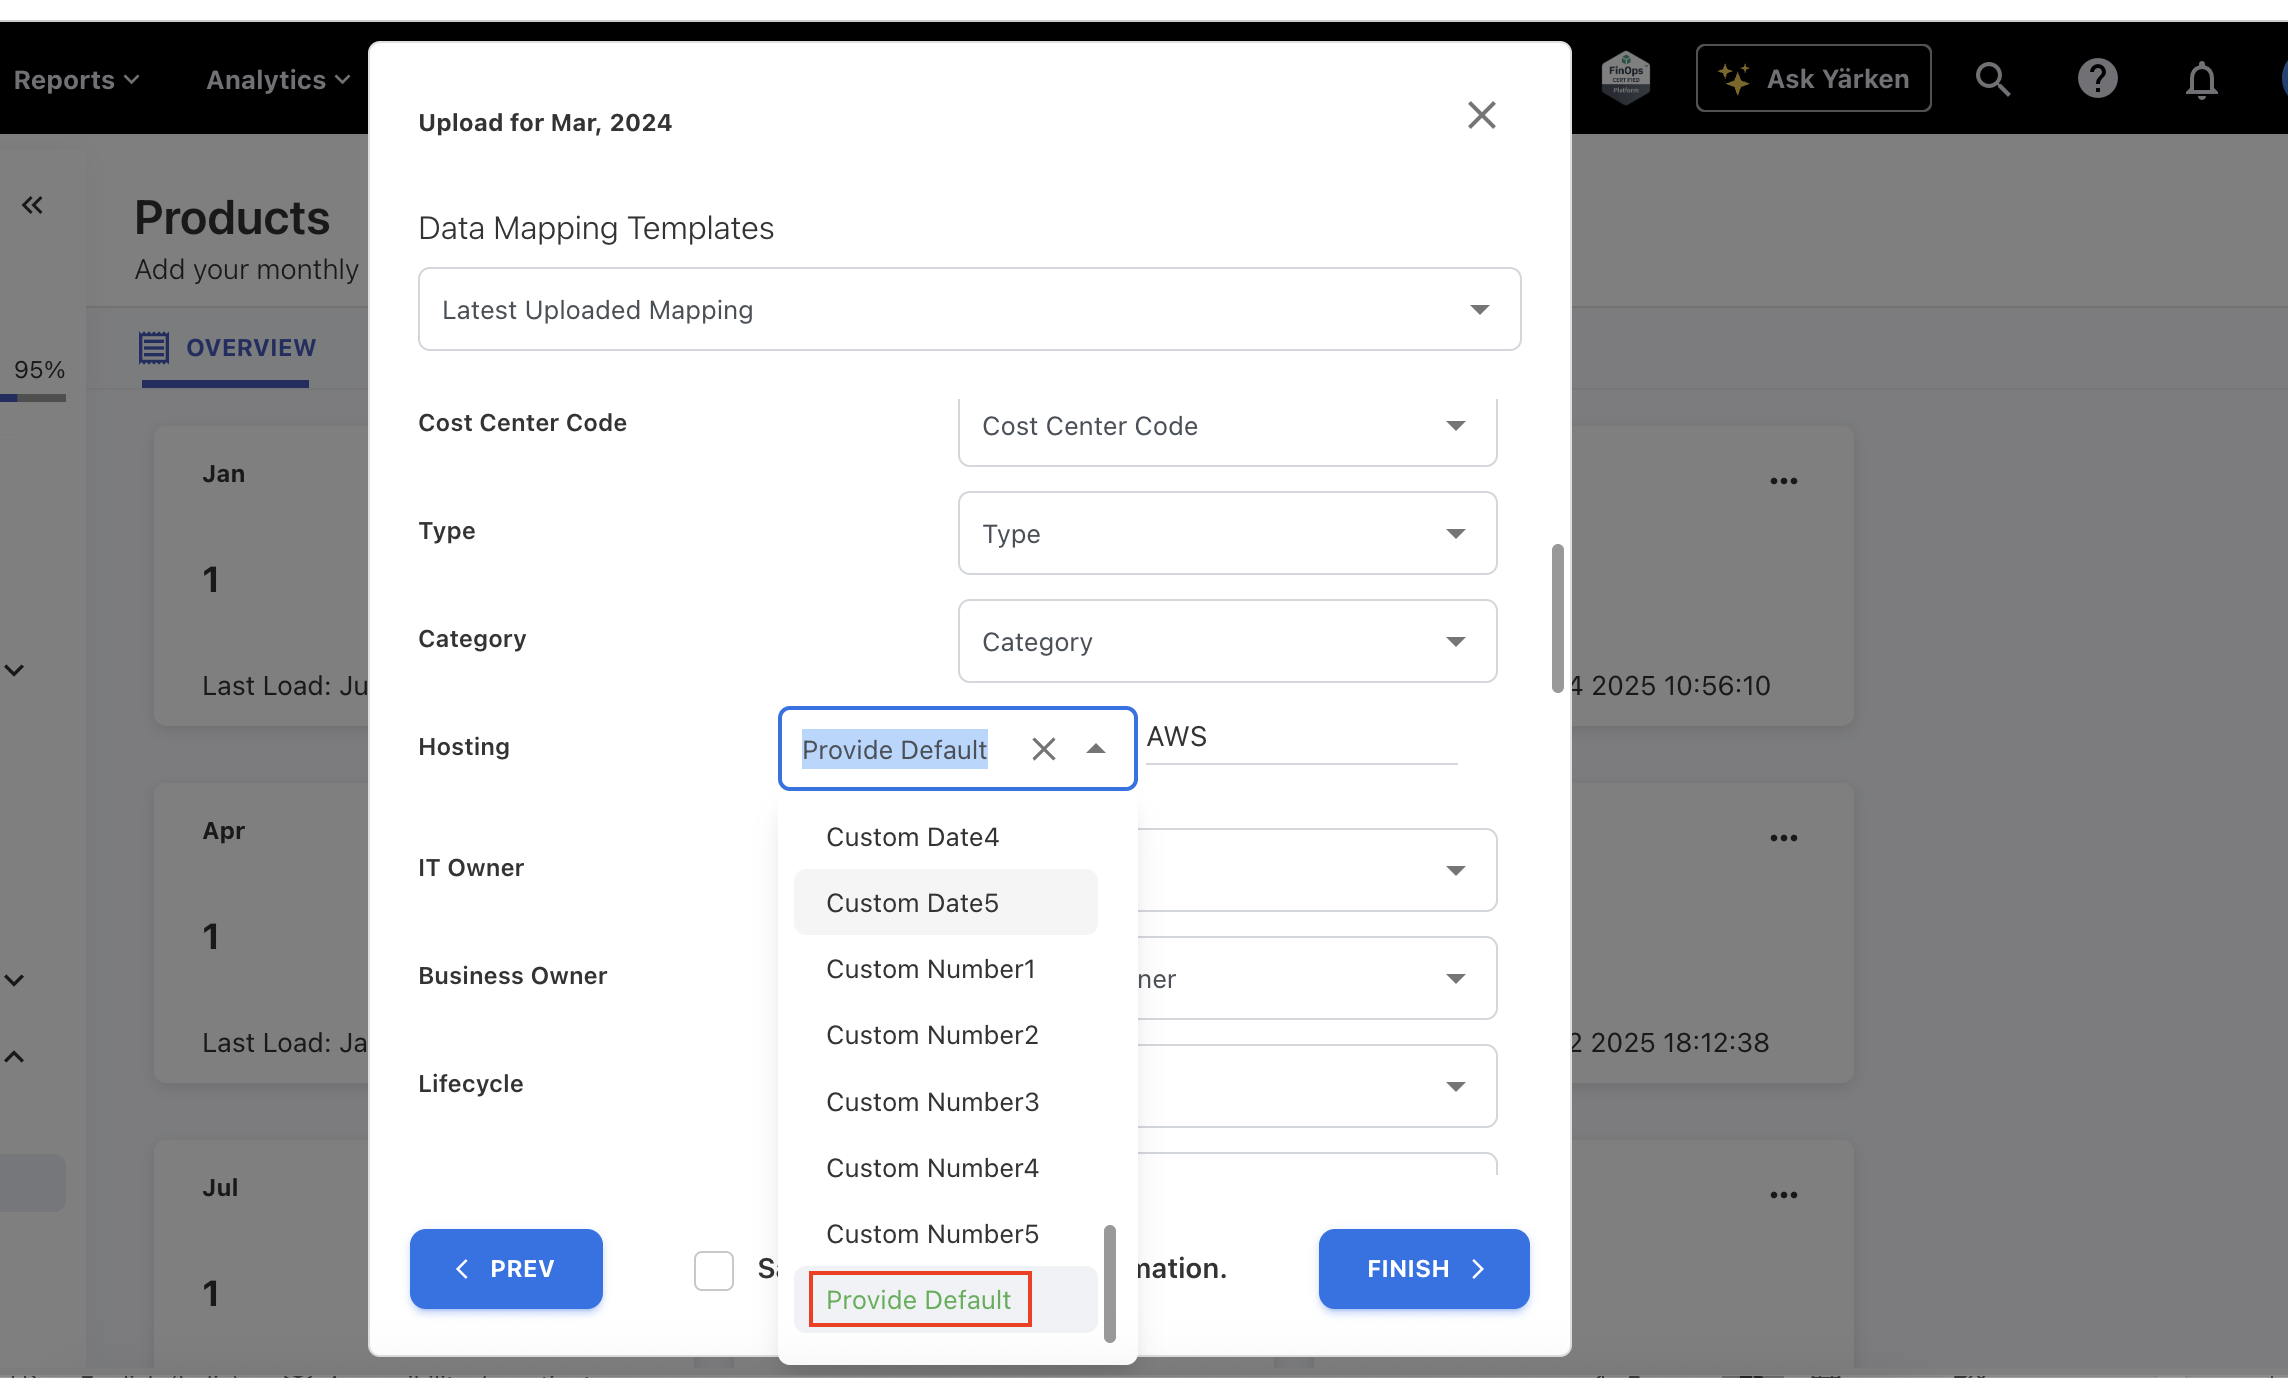
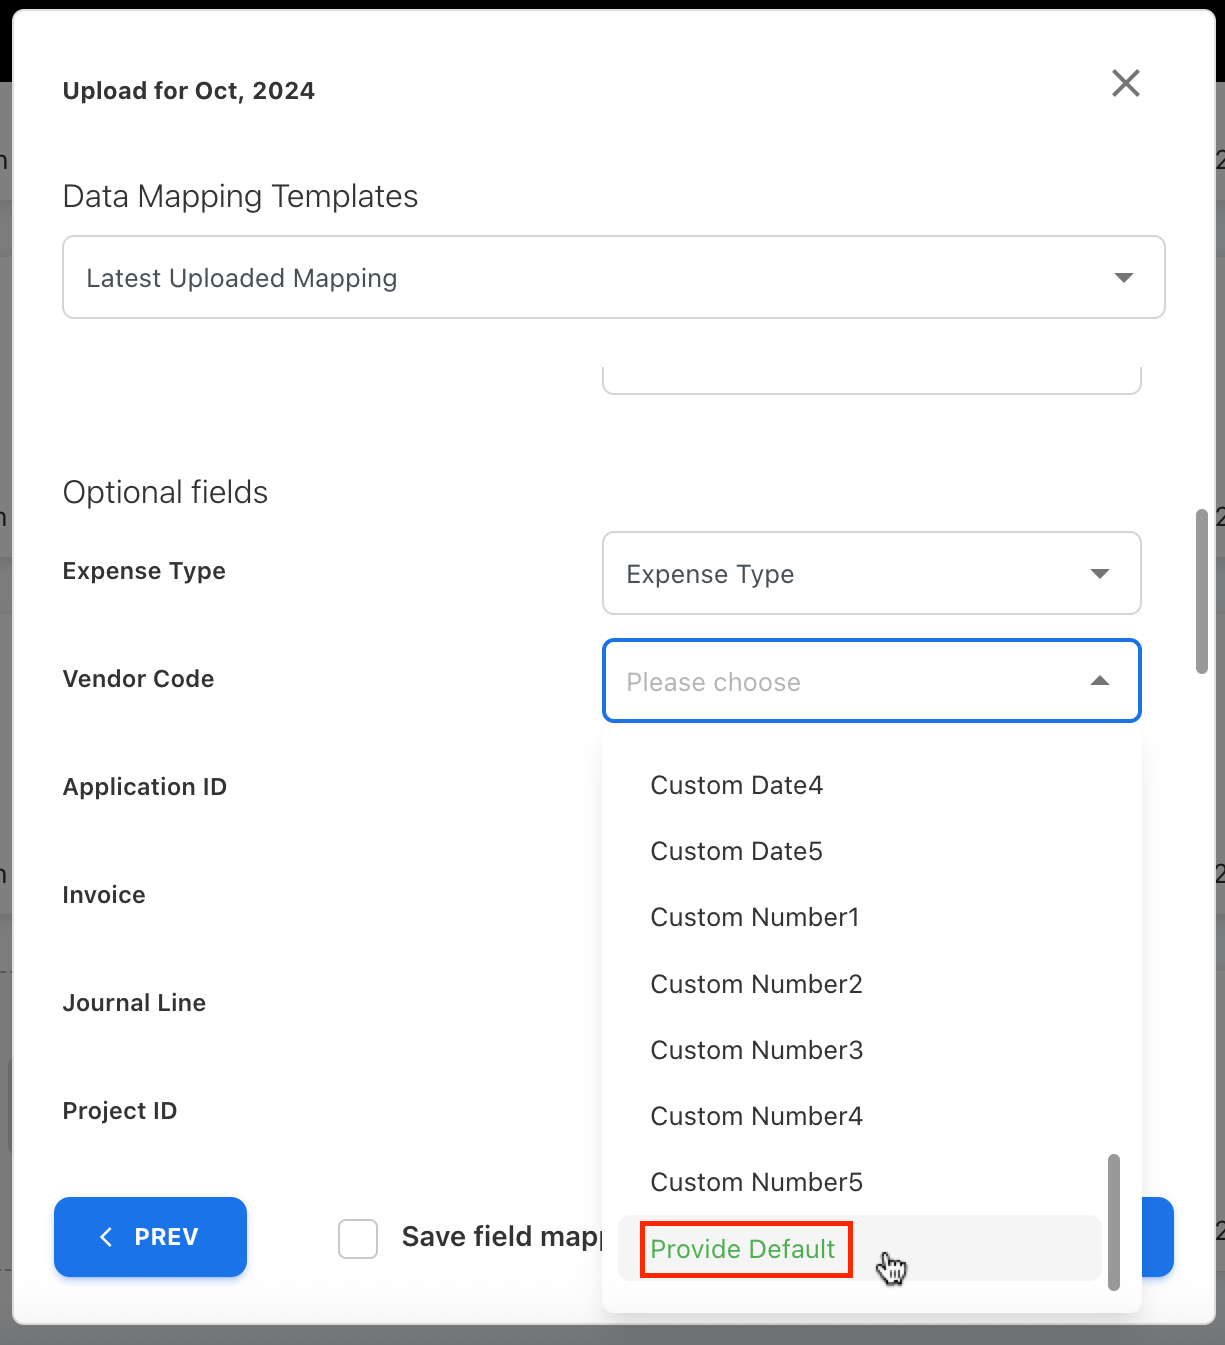
Default Field Values During Mapping
We have added a new ability to set default values for any field types during the field mapping. A new dropdown option called Provide Default is included in every field, and the user can select and enter a default value next to the corresponding field. This default is applied only during the first upload. For subsequent uploads, the default must be set again if required.
Set Any Dashboard as Homepage
We’ve expanded the capability of setting the Default Dashboard to users. Previously, only custom dashboards could be set as the homepage. With this update, any standard dashboard can now be set as the home screen.
The existing capability of the Dashboard Only user role also extended to have access to the standard dashboard on the home page. The admin can set the existing standard dashboard as a home page in addition to the custom dashboards.
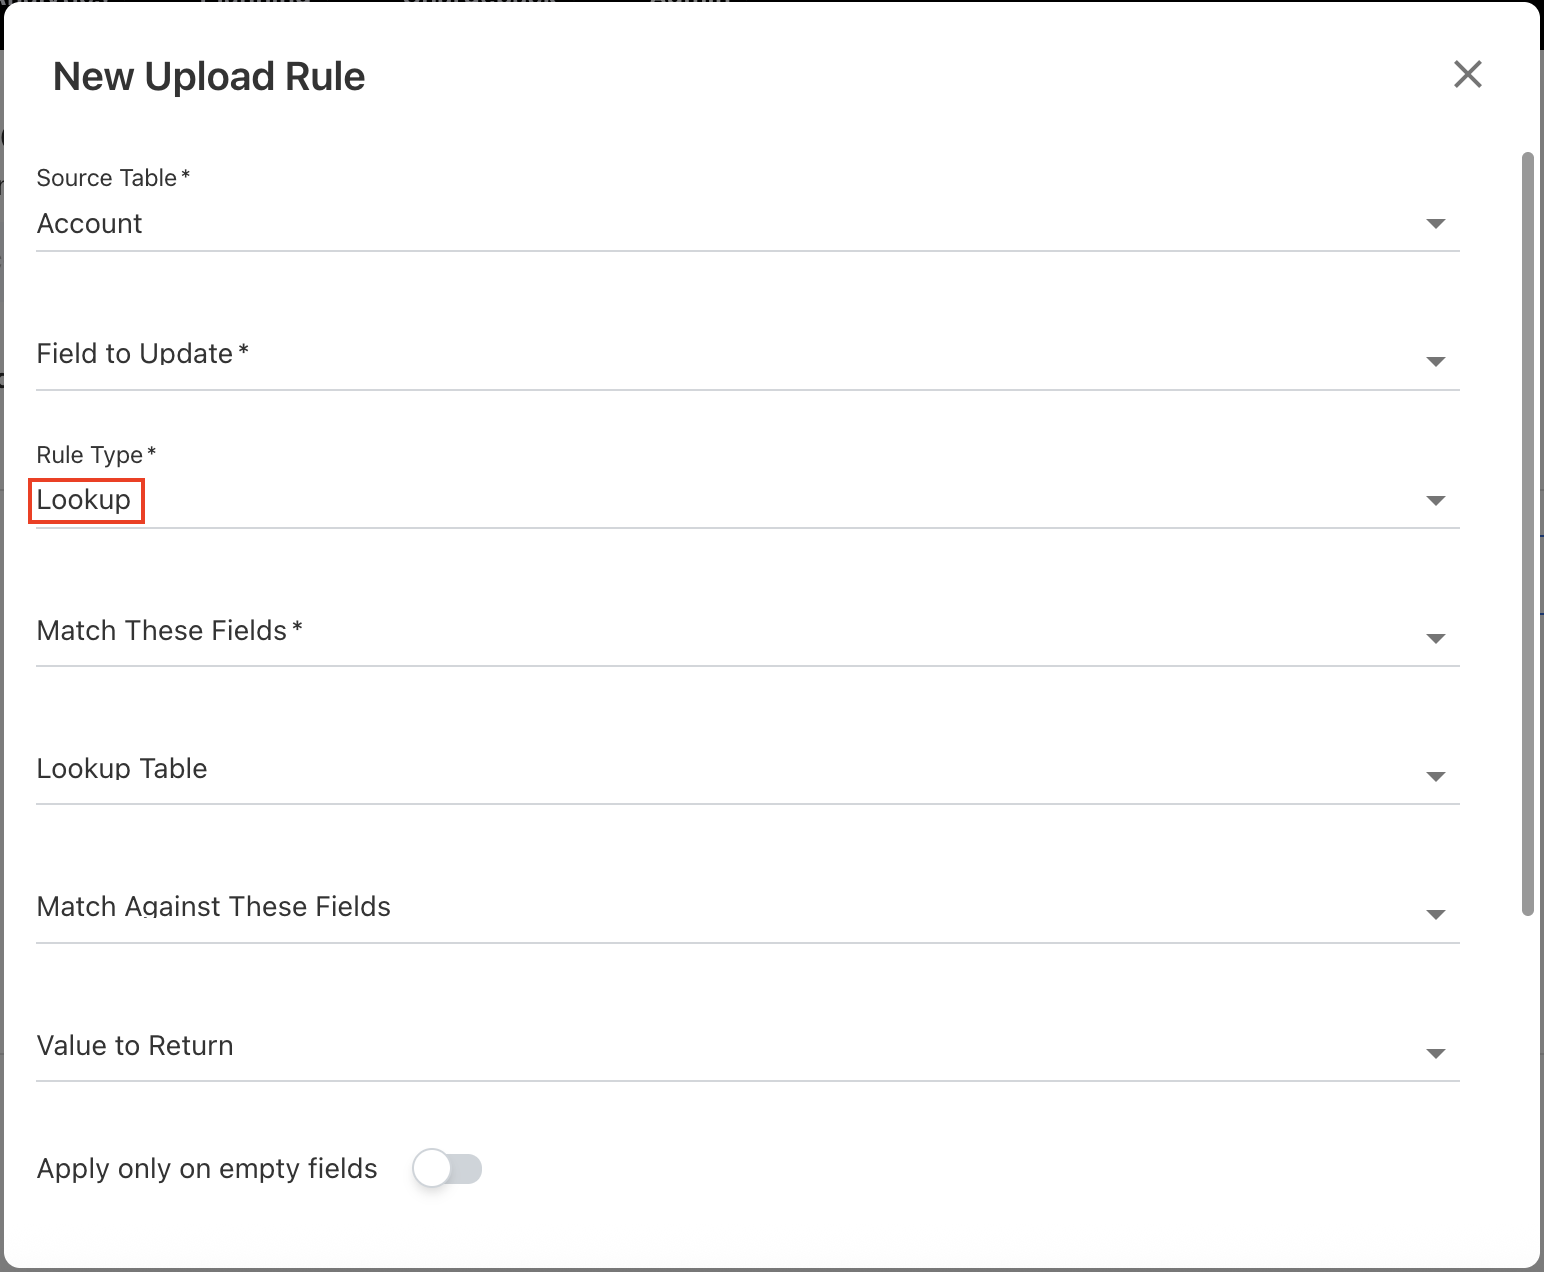
Upload Rule - Lookup Rule Type Modification
The previous Lookup and Lookup Table rule types have been merged into a single Lookup rule type. The field names within the Lookup rule have been updated for clarity:
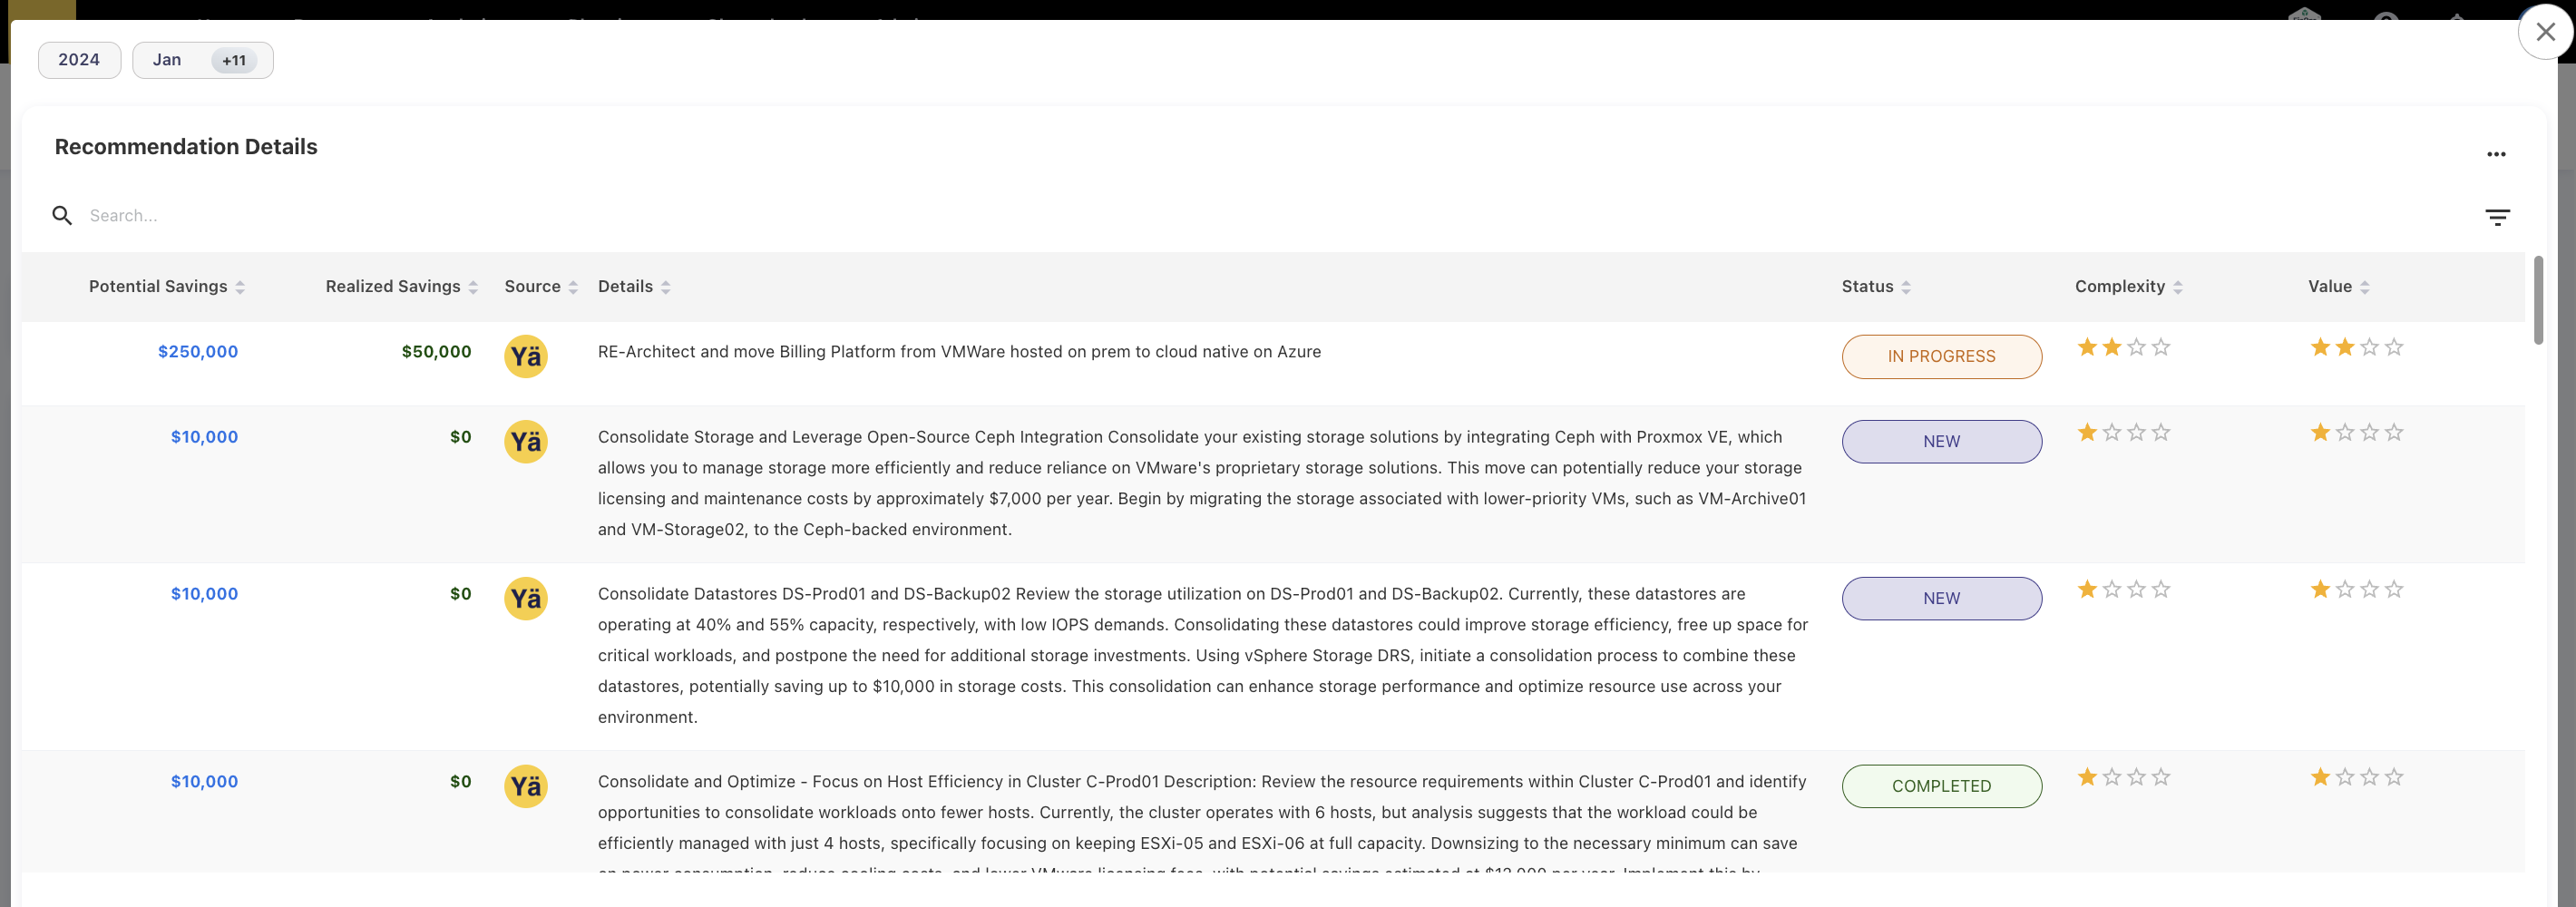
Recommendation Details UX Change
The Recommendation Details popup UI changes:
-
Potential and Realized savings: rearrange the sequence.
-
Source: icons are added.
-
Details: wrapped text inside the container.
-
Status column: color-coded.
-
Complexity & Value: Added the start rating.
Fix for Tower Rules Equally Distribution
The existing tower rules for spend distribution to assets based on the Asset ID field (GL) were not being applied correctly during asset file uploads. Instead, the spend was being distributed equally across all assets. This issue has now been fixed, and the tower rules are applied properly during asset file uploads.
August 04, 2025
Enhancements
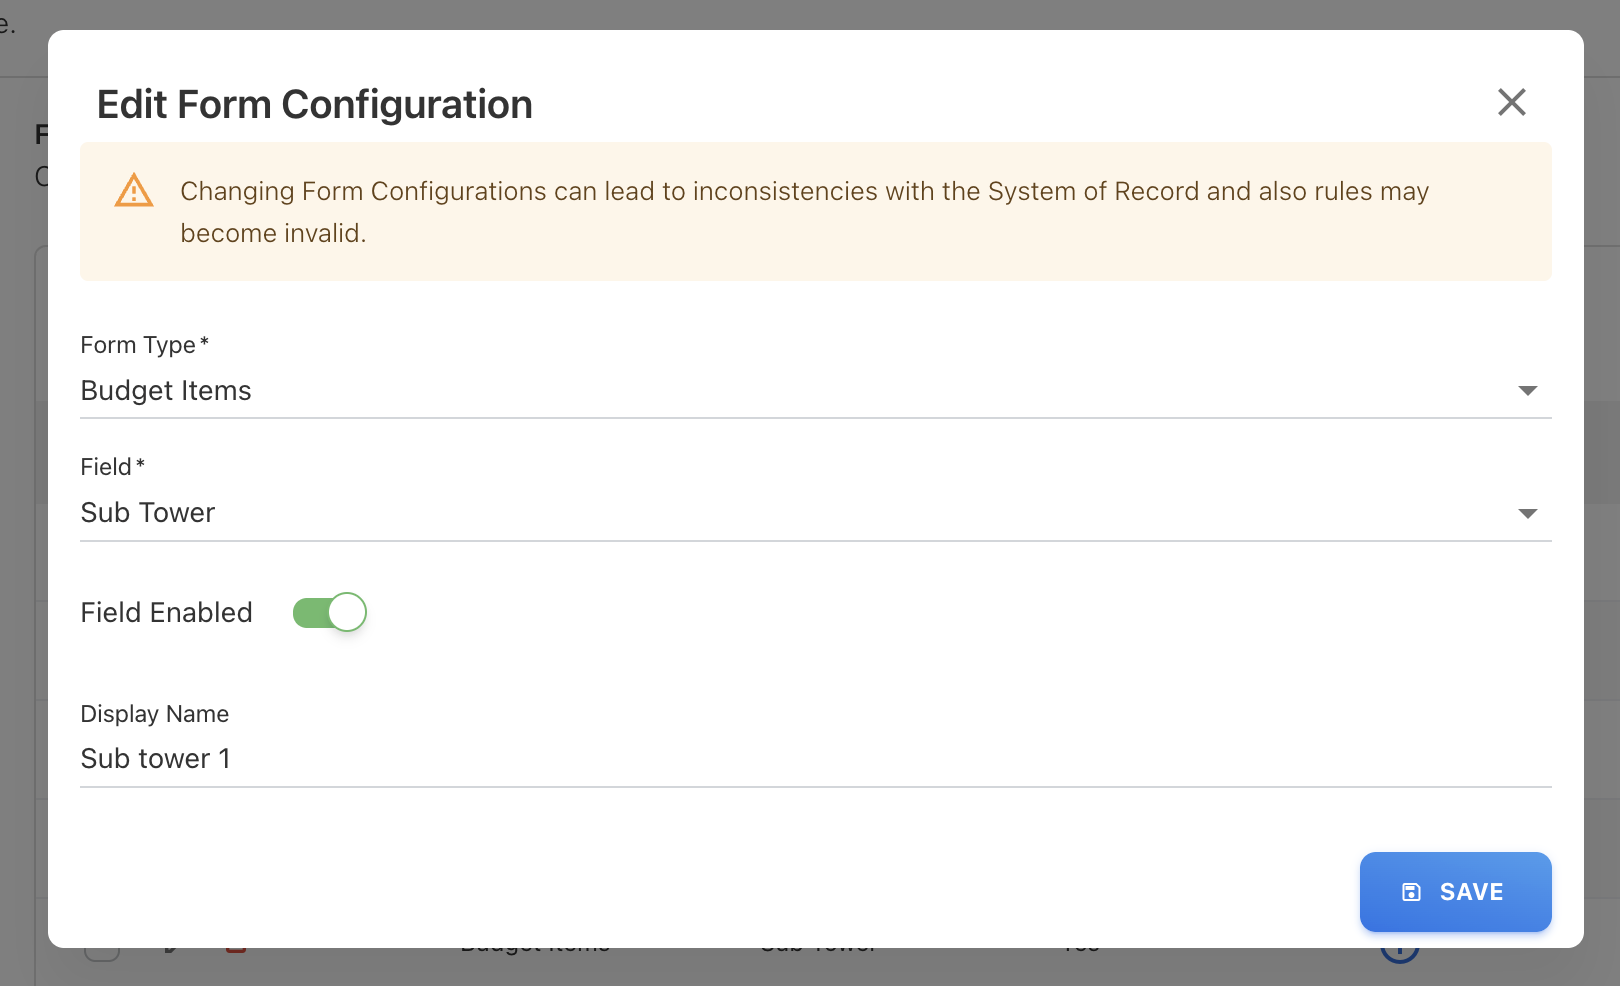
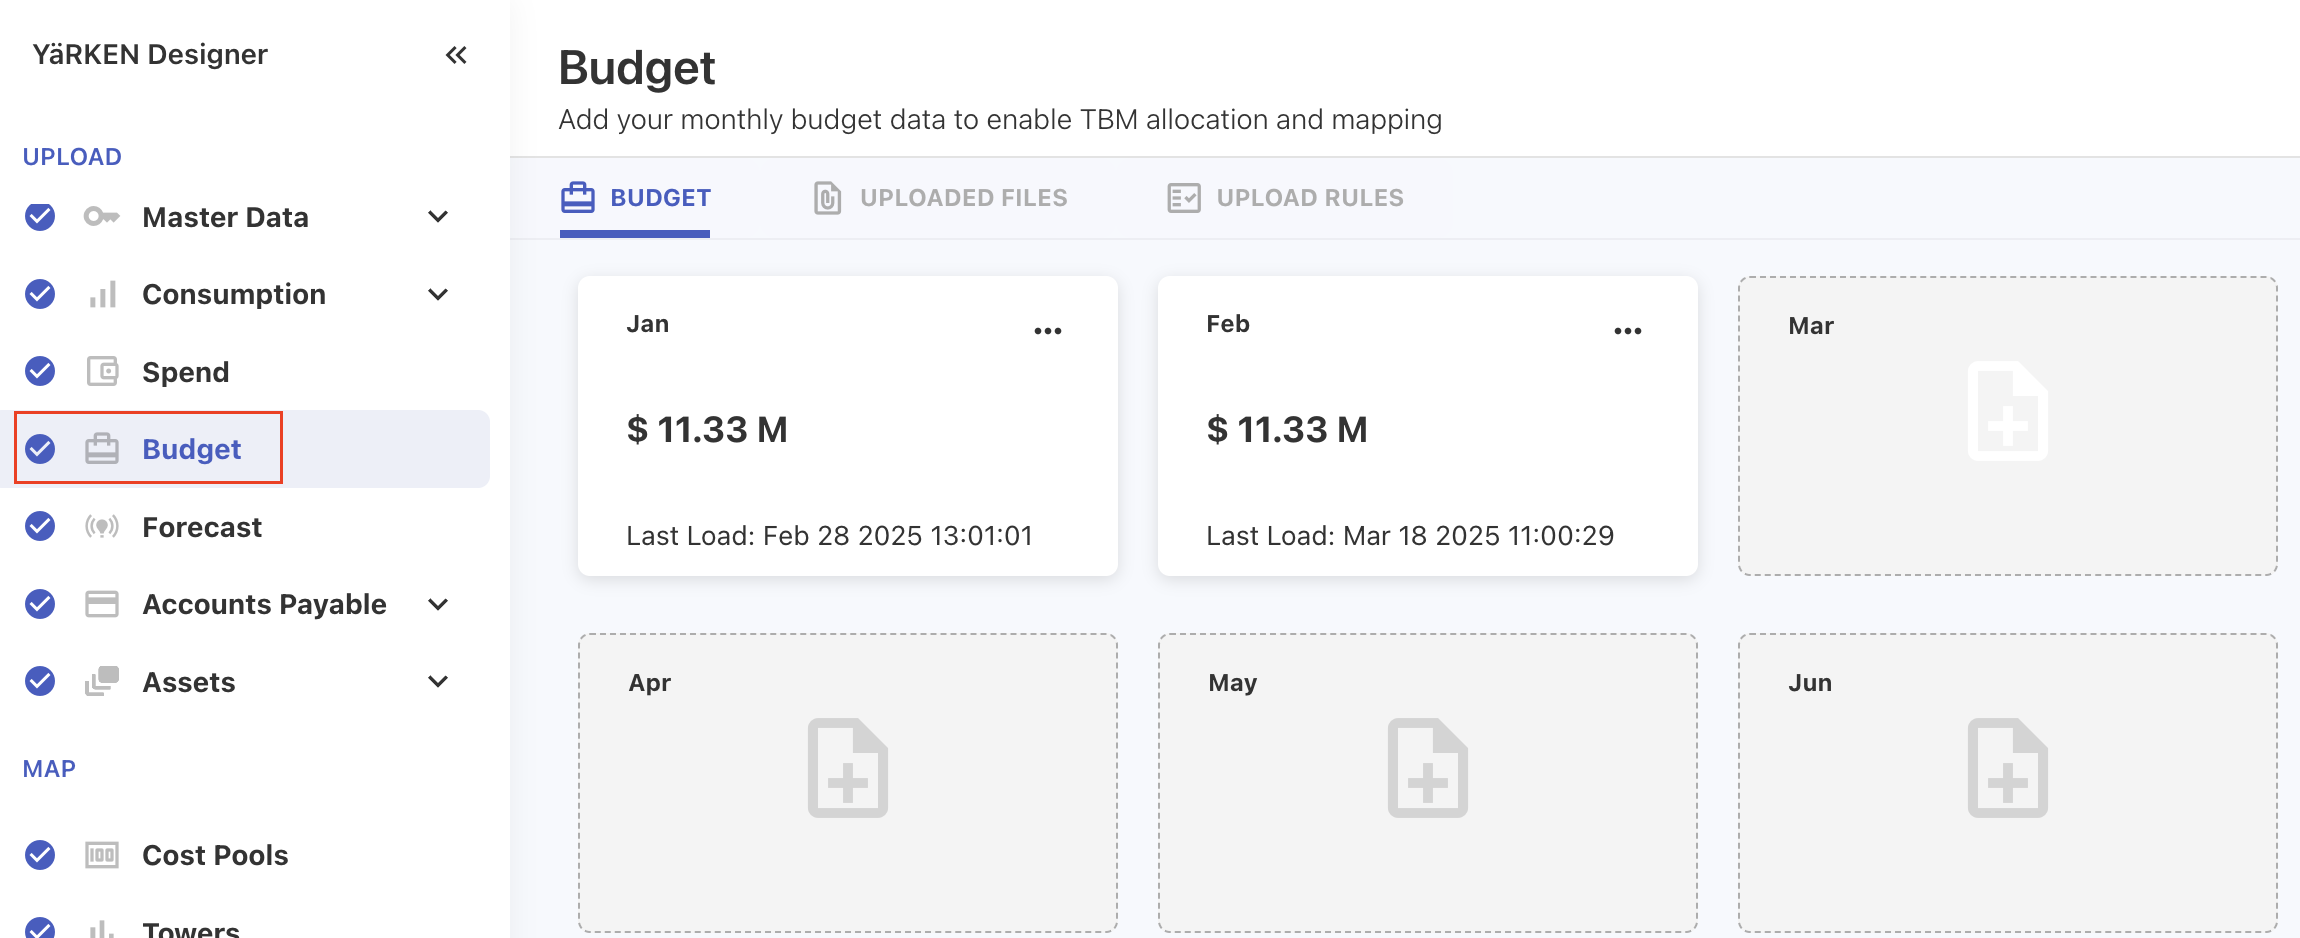
Budget Module – Field Configuration via Form Configuration
We have added a new capability to enable or disable the data items on the budget module. Users can now manually configure budget-related fields using the newly added Form Configuration option under Settings, allowing to utilize only specific data fields that are required during the budget process.
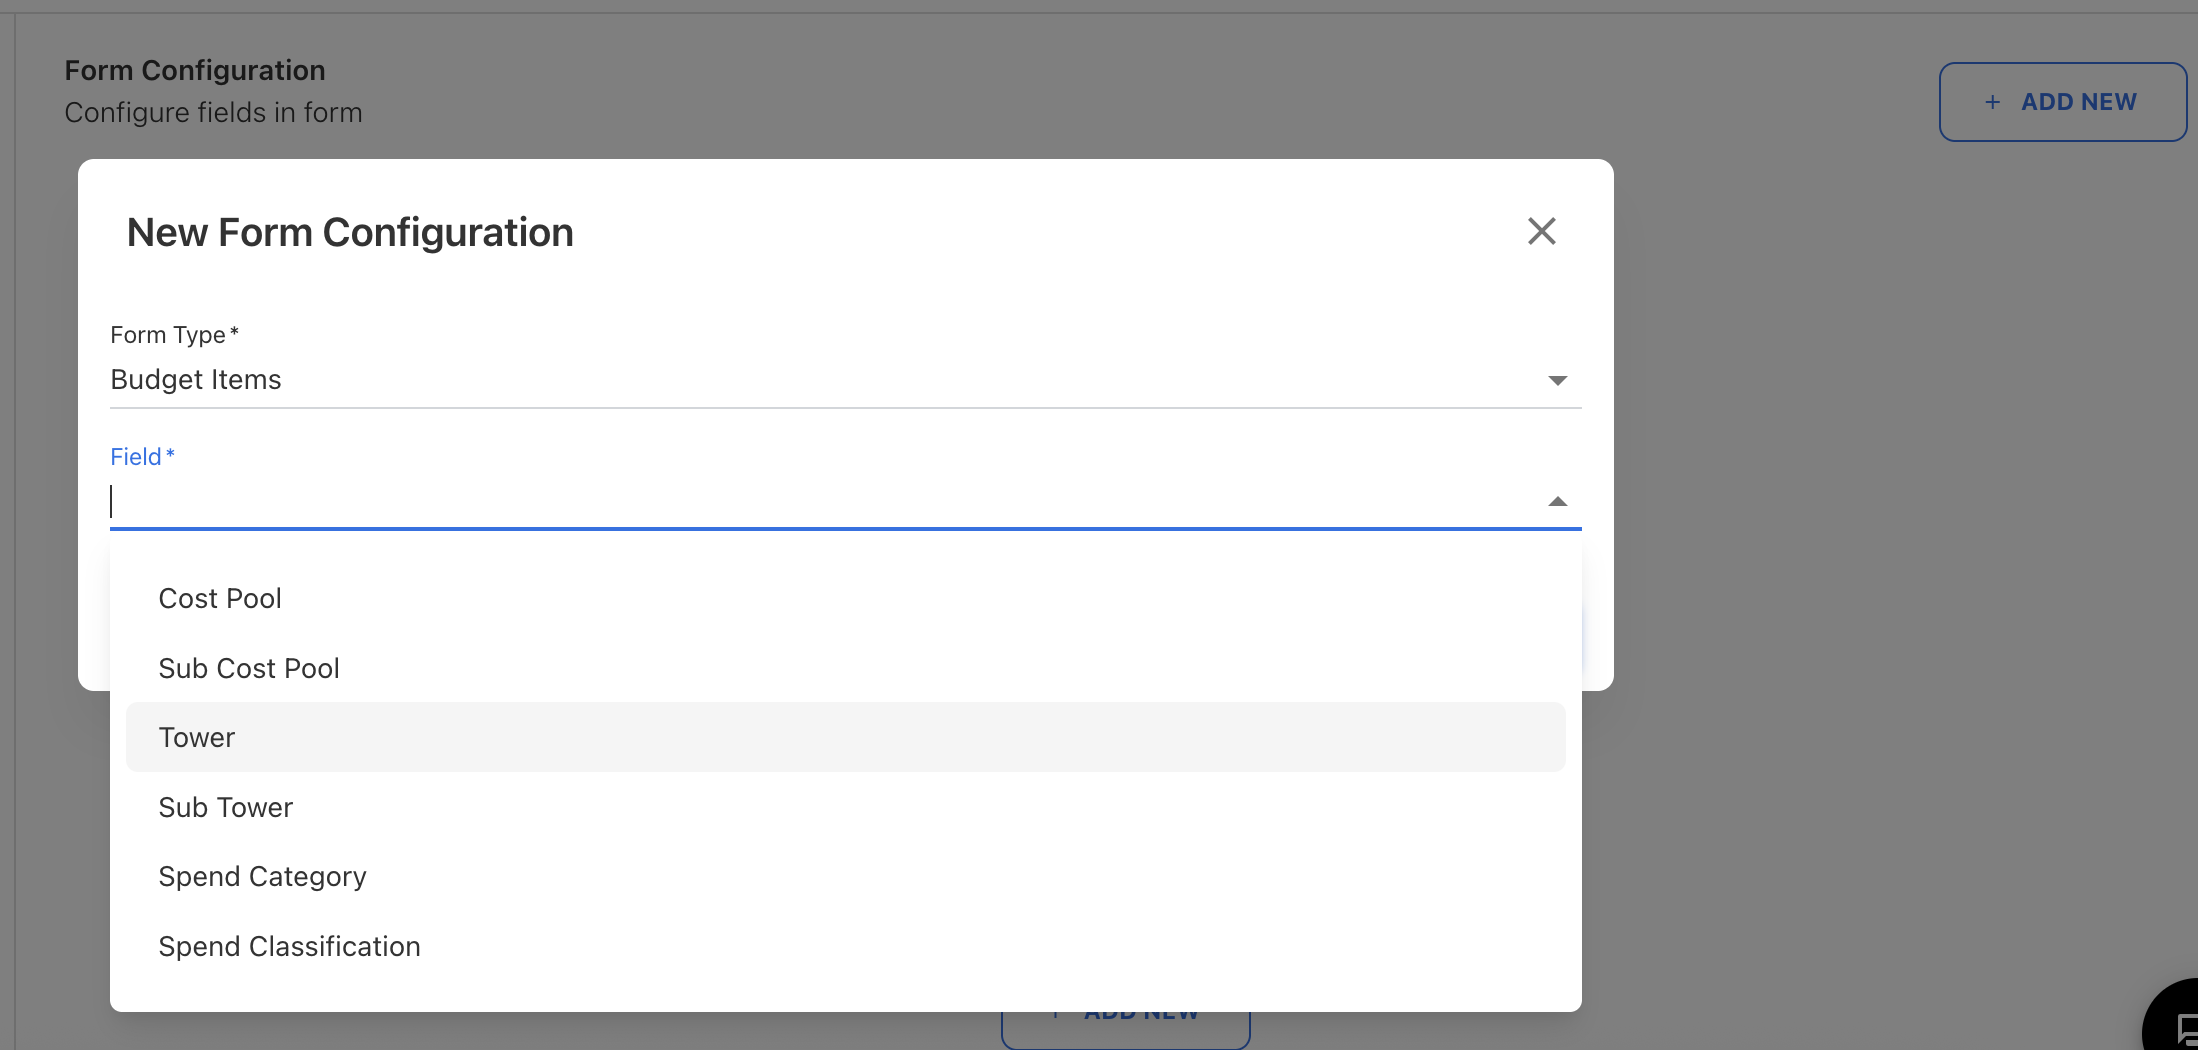
The form is provided with the dropdown option to select the configurable fields for budgets, such as Cost Pools, Sub Cost Pools, Tower, Sub Tower, Spend Category, and Spend Categorization. Users may use the original field names or rename them as needed. For non-TBM fields, the user can define the custom field values and set a default if no value is selected. These fields can also be disabled when not required. The form ensures that the TBM taxonomy fields for the budget are handled properly to maintain consistency.
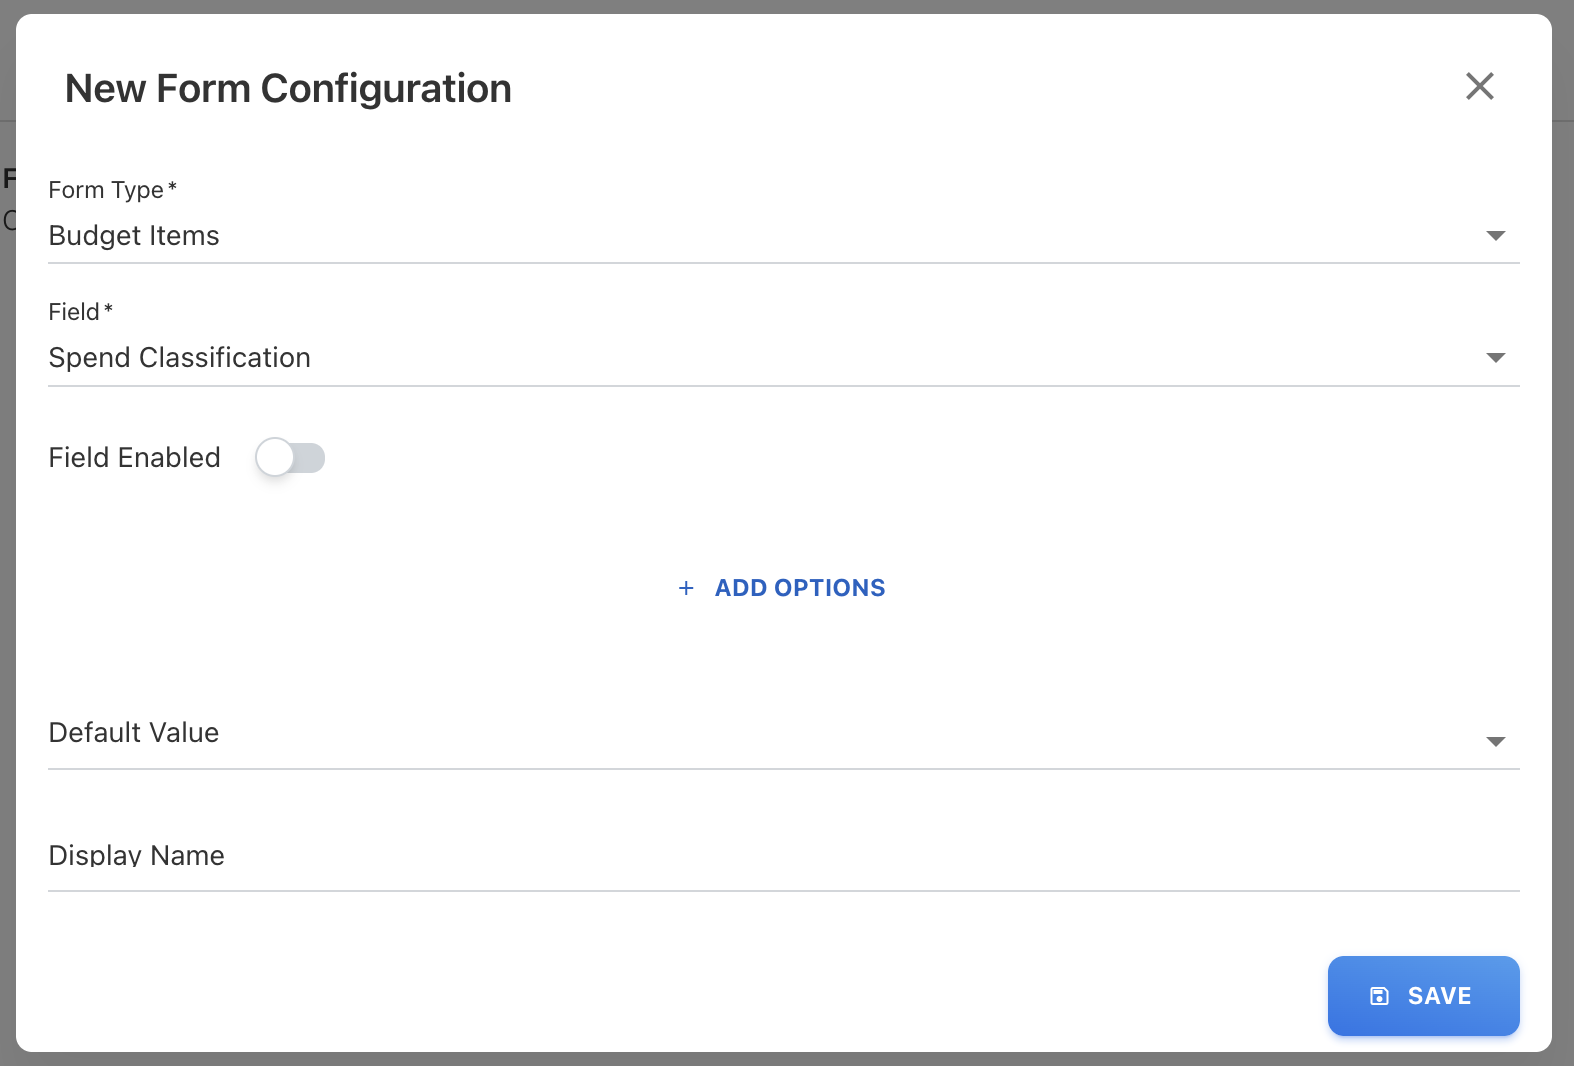
When configured, the chosen fields appear across all areas (uploads, downloads, edit, view, push to CT, load from CT, etc.). This functionality is currently limited to the Budget module, with plans to extend it to other modules in the future.
July 28, 2025
Enhancements and bug fixes
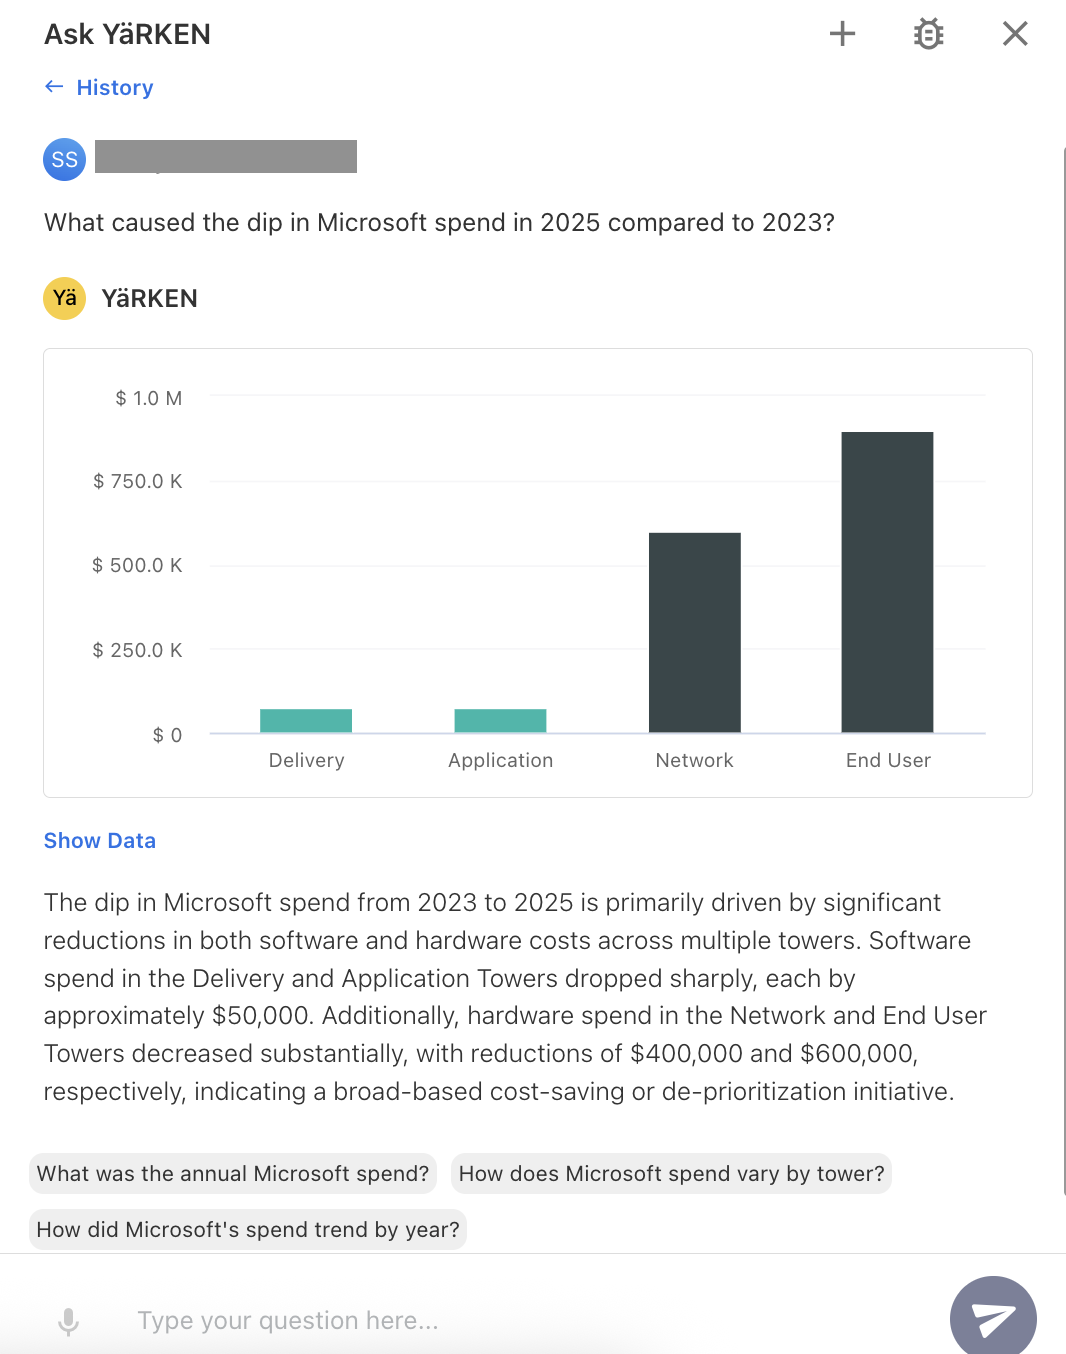
Ask YäRKEN Enhancements
Ask YäRKEN is now enhanced to better recognize and respond to domain-related and how-to questions. Additionally, the model can now explain changes in spend across parent dimensions. For example, when asked, “What caused the dip in Microsoft spend in 2025 compared to 2023?”, the model analyzes underlying drivers such as cost pools and towers to provide a clear explanation of the spend variance.
New Filter Values in Custom Dashboard and Analytics
-
The custom dashboard’s new filter values:
-
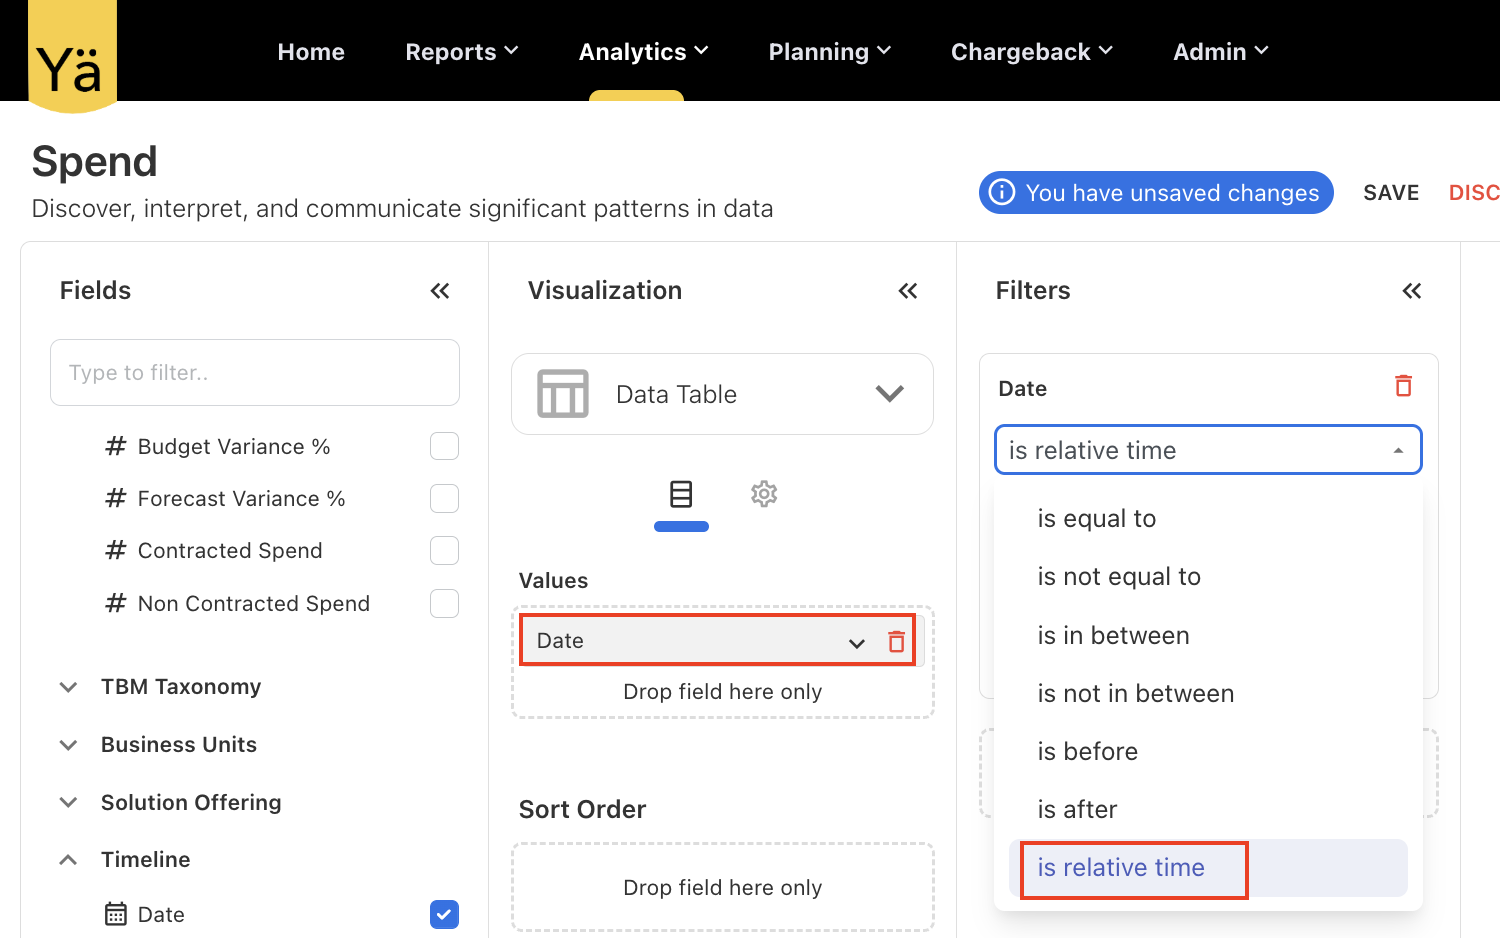
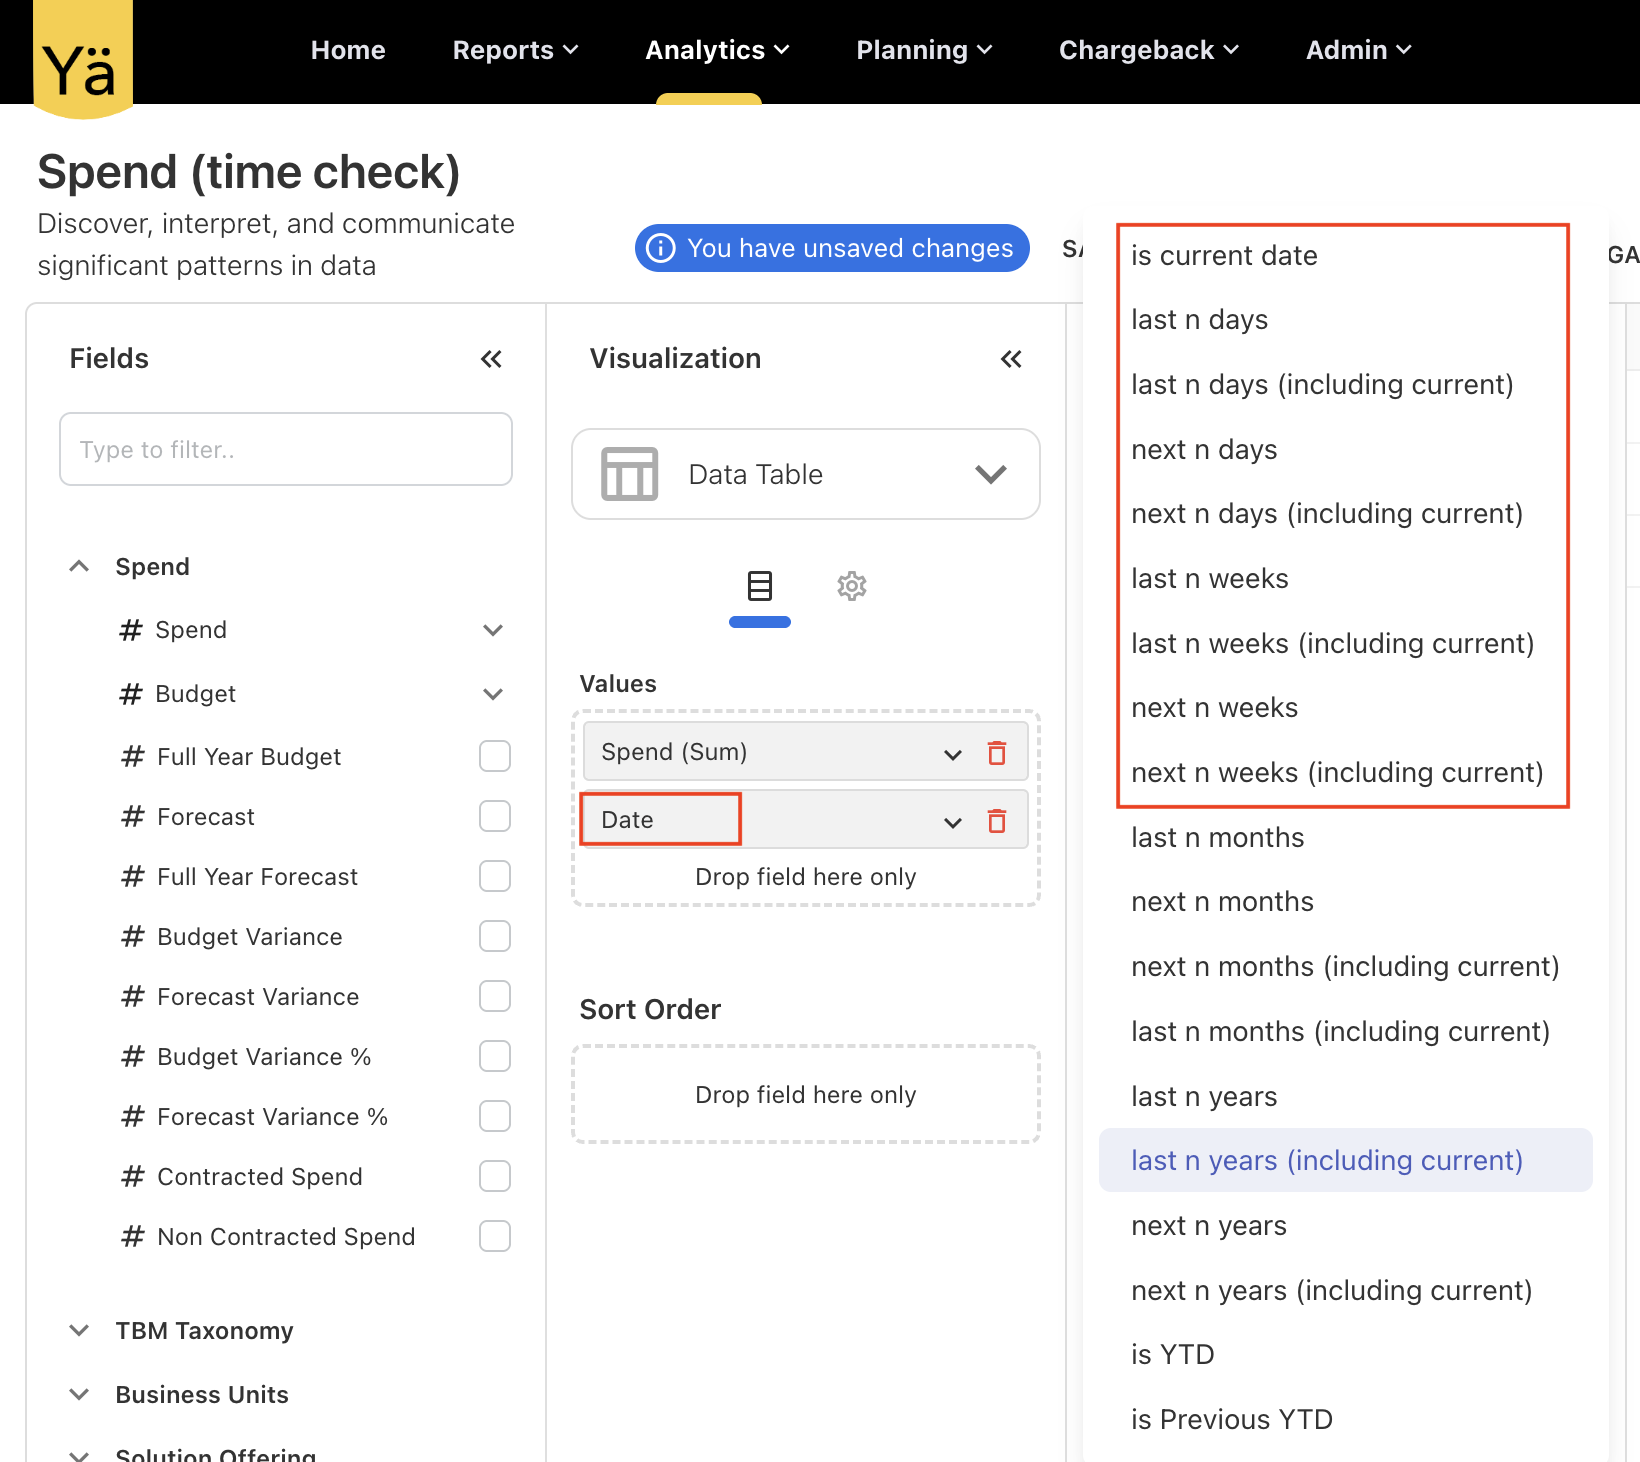
The new filter values in Analytics to refine the specific date, is relative time:
Bug Fixes
This release version includes the below bug fixes:
-
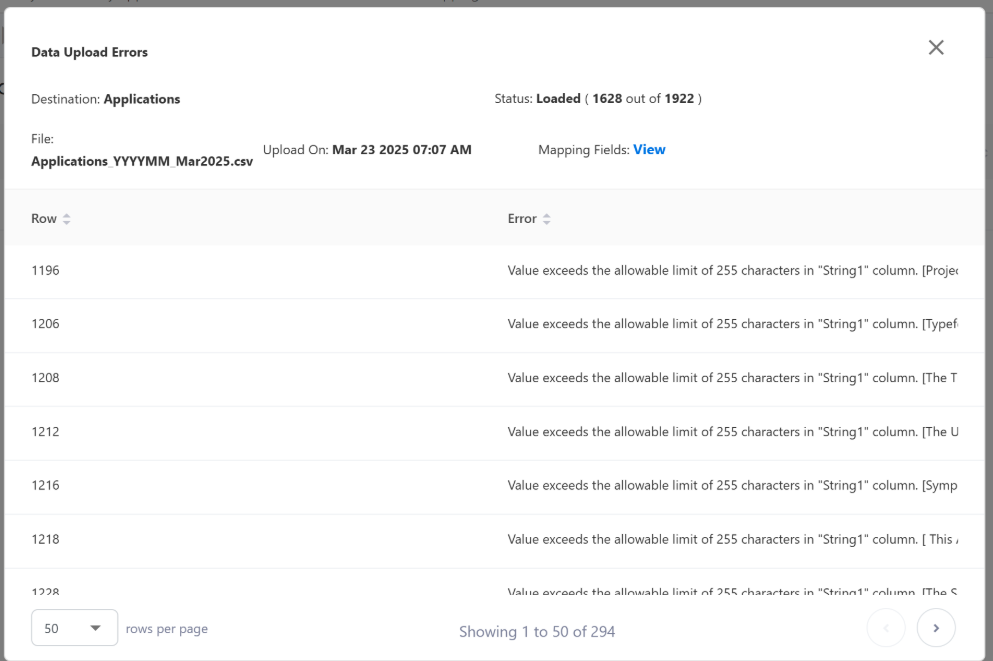
The error message for character limit exceeds shown during data upload—such as “Value exceeds the allowable limit of 255 characters in ‘String 1’ column”—did not reflect the actual column name. This has now been corrected. The error message is updated to display the real column name and allowable characters limit. Additionally the limited characters message enabled for manual loading.
-
An issue was identified in the Combination Chart type on custom dashboards, where sorting applied to the chart was getting removed from the customized widget panel after clicking on the chart. The applied sorting is retained correctly even after interacting with the combination chart.
-
A partial data loading issue was found in the upload rules, where certain rows were not loading and were silently dropped without any error indication. This occurred due to the asynchronous execution of record deletion and creation in the backend, resulting in data loss. This has now been resolved. The upload process is updated to ensure that deletions are complete before new records are created.
July 21, 2025
Bug fixes and enhancements
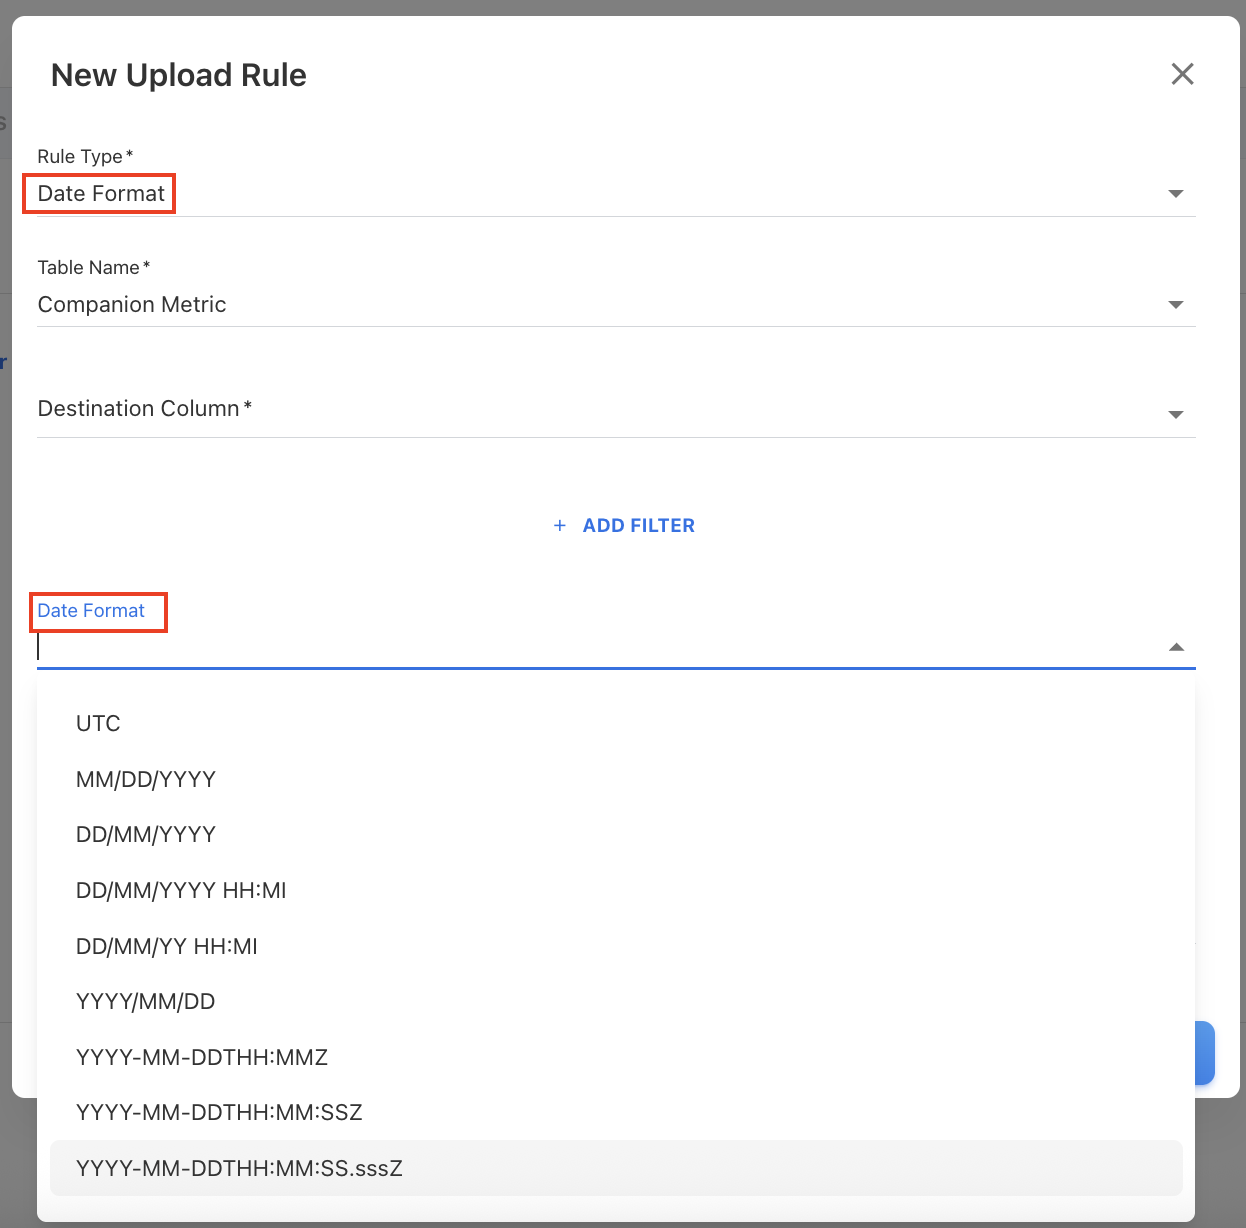
New Upload Rule Type: Date Format
A new upload rule type called Date Format has been introduced. This new rule type allows users to create the upload rules for mapping the date columns with specific format during the data upload. This is particularly useful when the upload file contains dates in a format different from the system default. If not specified, the system will apply its default date format, which may vary depending on the environment.
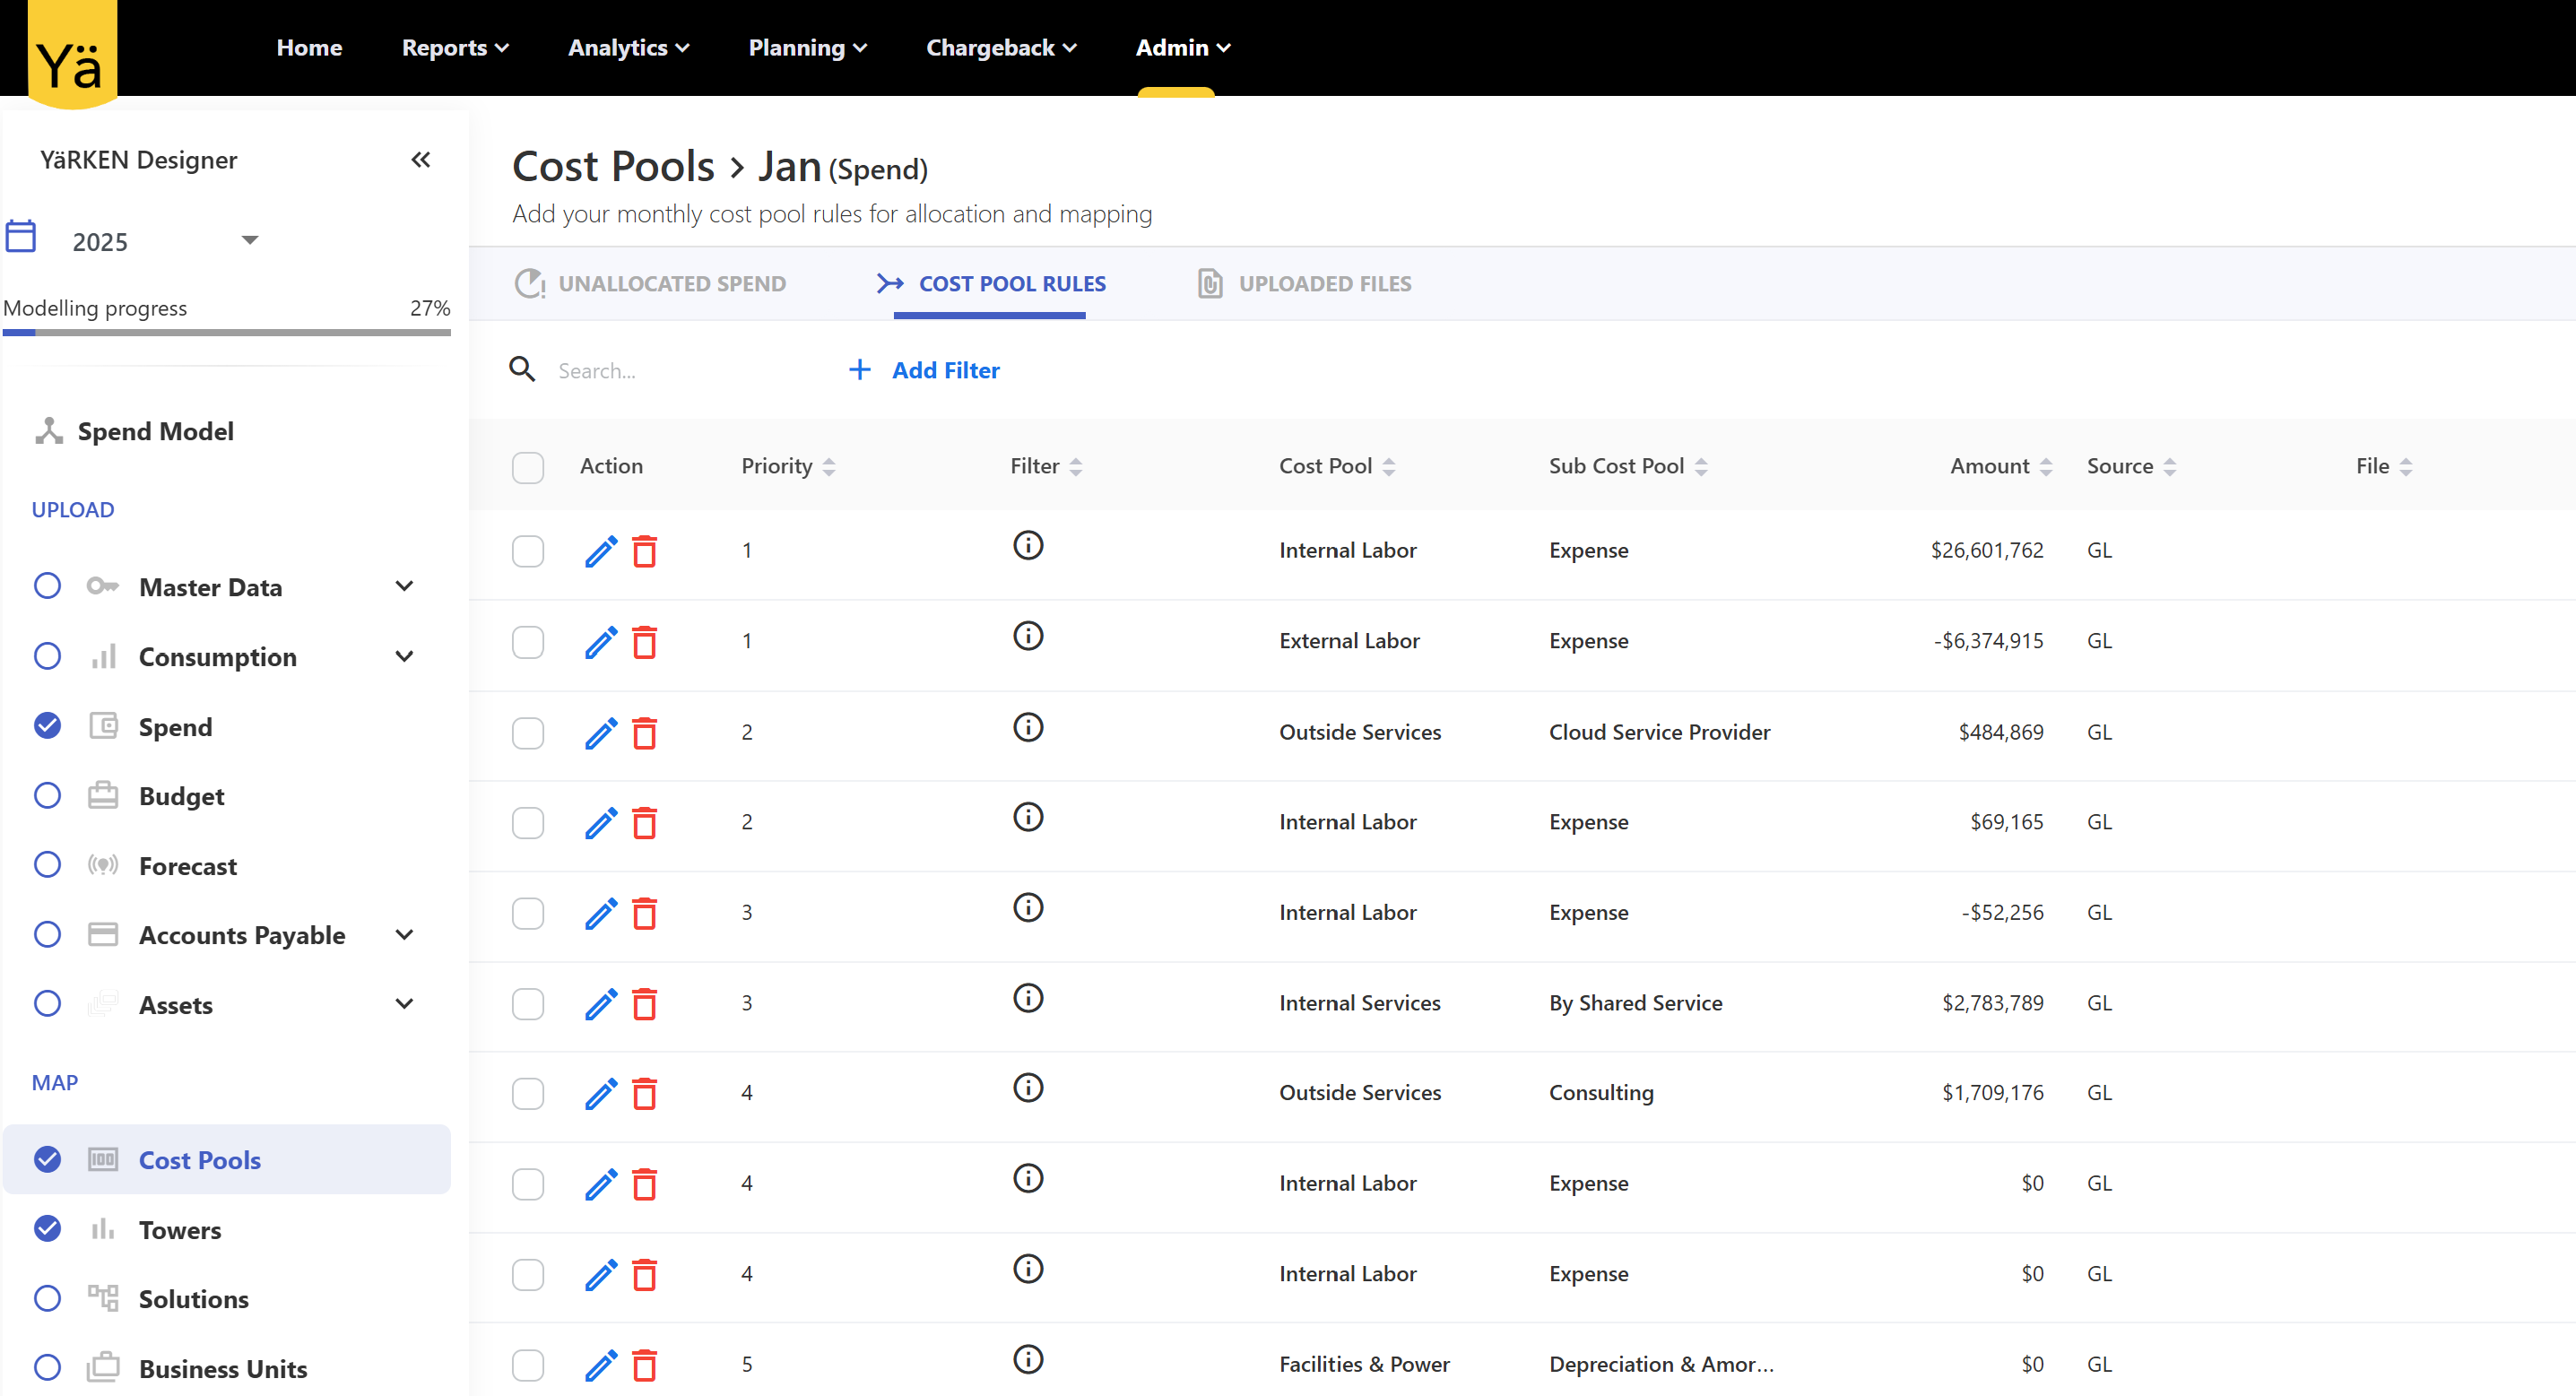
Fix for Duplicate Priorities in Cost Pool and Tower Rules Due to Deletion Failure
An issue was identified in the Tower Rules and Cost Pool rules where duplicate priority values appeared after copying rules from another month. This occurred because the deletion of existing tower expenditures (performed in the backend) failed under heavy load, while the rule copying process still proceeded—resulting in duplicated priorities in a month. The deletion process has now been optimized to handle higher loads more efficiently.
July 14, 2025
Bug fixes and enhancements
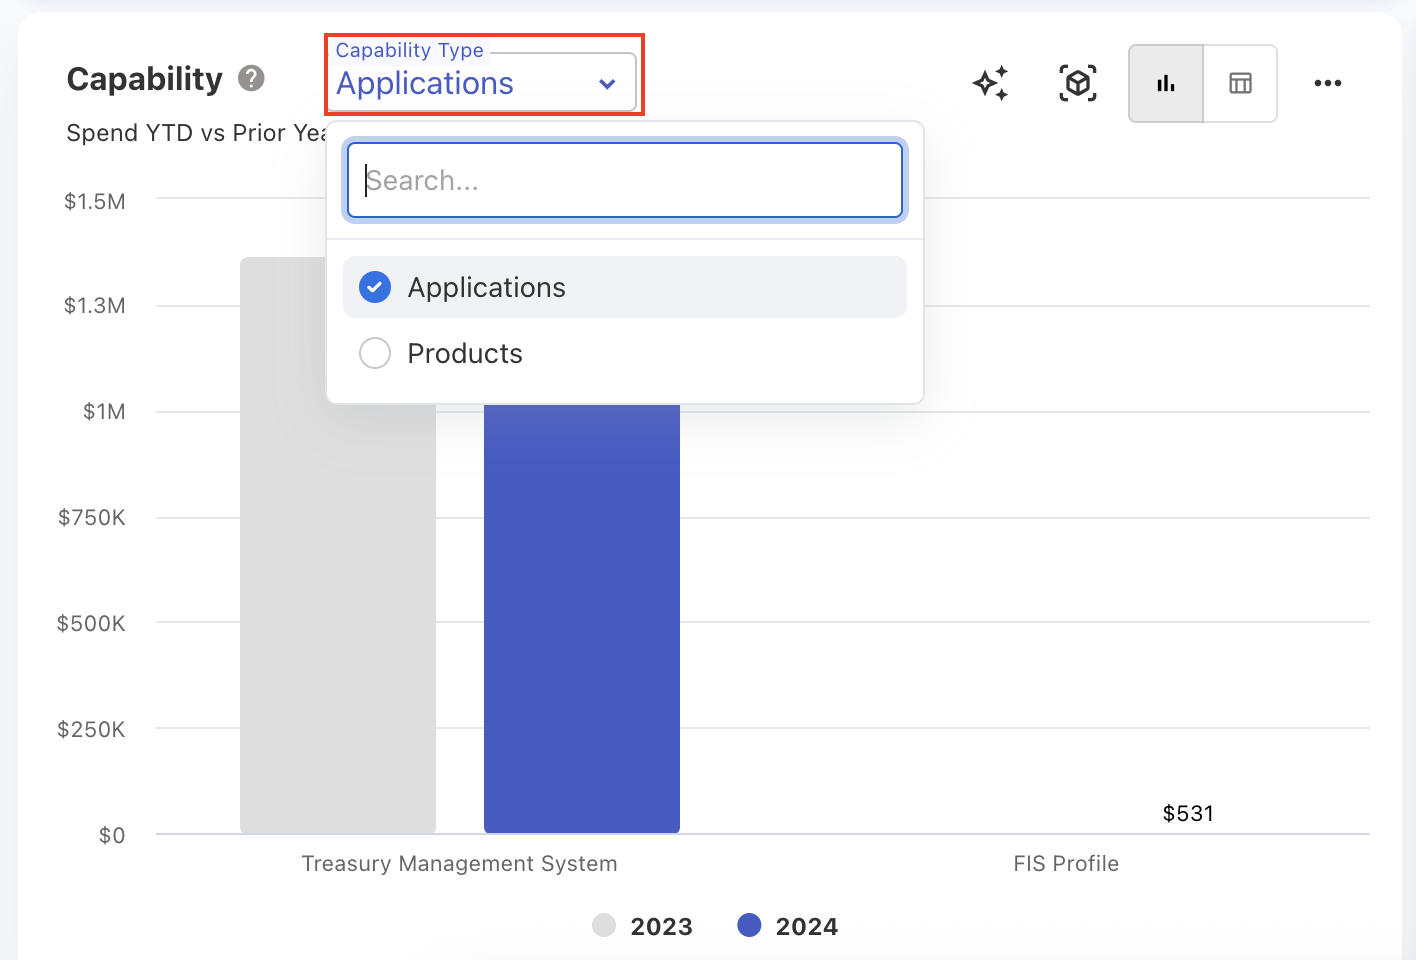
Enhanced Applications Chart in Solution TCO Dashboard
The Applications chart on the Solution TCO dashboard is enhanced to provide detailed spend visibility. It now displays spend coming not only from Applications but also from Products and Services. A new filter called Capability Type is added to distinguish spend sources contributing to a particular solution. This filter is applied specifically to the chart itself and does not affect the rest of the dashboard.
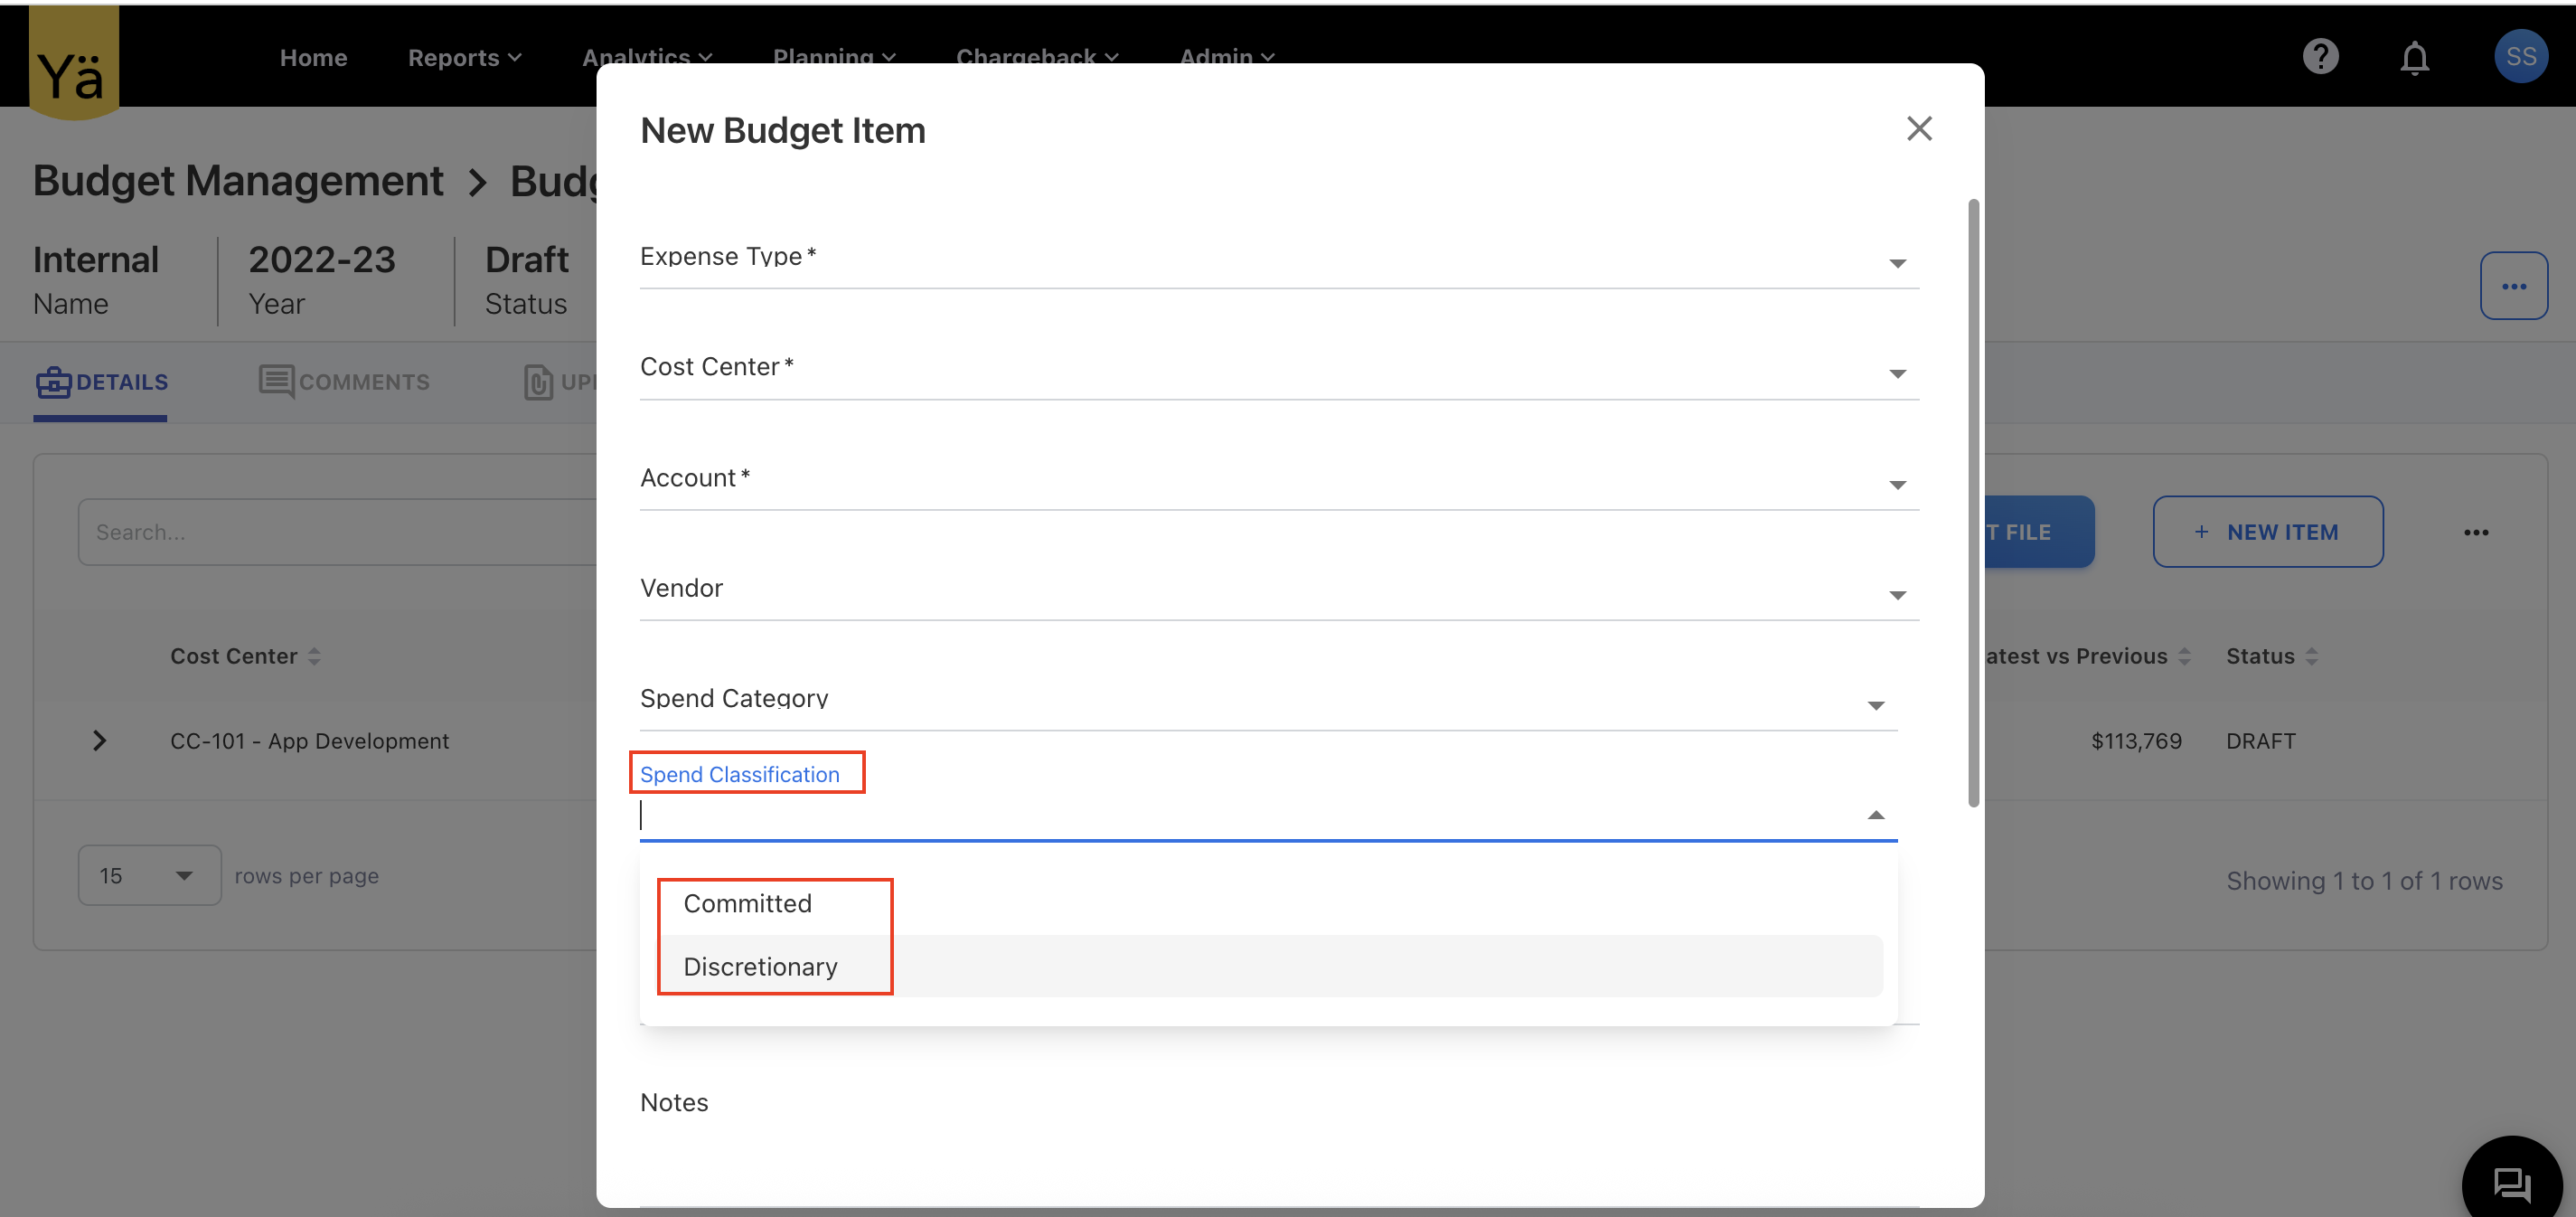
New Spend Classification Column in Budget Items
A new optional column named Spend Classification is added to budget items. This column provides a dropdown selection with values such as Committed and Discretionary. If no selection is made, the default value is set to Discretionary.
Cost Center Charts Limited to Top 20 Records
The cost center charts across all dashboards and reports have been updated to display only the top 20 cost centers, improving chart loading speed and ensuring efficient rendering. Along with this change, the chart titles have been updated to Top 20 Cost Centers to reflect this improvement.
Fix for Reuploading Upload Rules File
When users downloaded and reuploaded the upload rules file, the Ignore Rows rule type would fail to upload because the Destination field was incorrectly enforced as mandatory. This field is actually not required for Ignore Rows rules. This issue has now been fixed, and users can reupload the file without needing to include the Destination column for Ignore Rows.
Lookup Type Fixes
An issue occurred during the upload of the lookup types file when a user selected the option to save a field mapping for automation. The file upload process failed when the user opted to store the mapping. This bug has been resolved, and field mappings for automation are saved without errors.
July 07, 2025
Bug fixes and enhancements
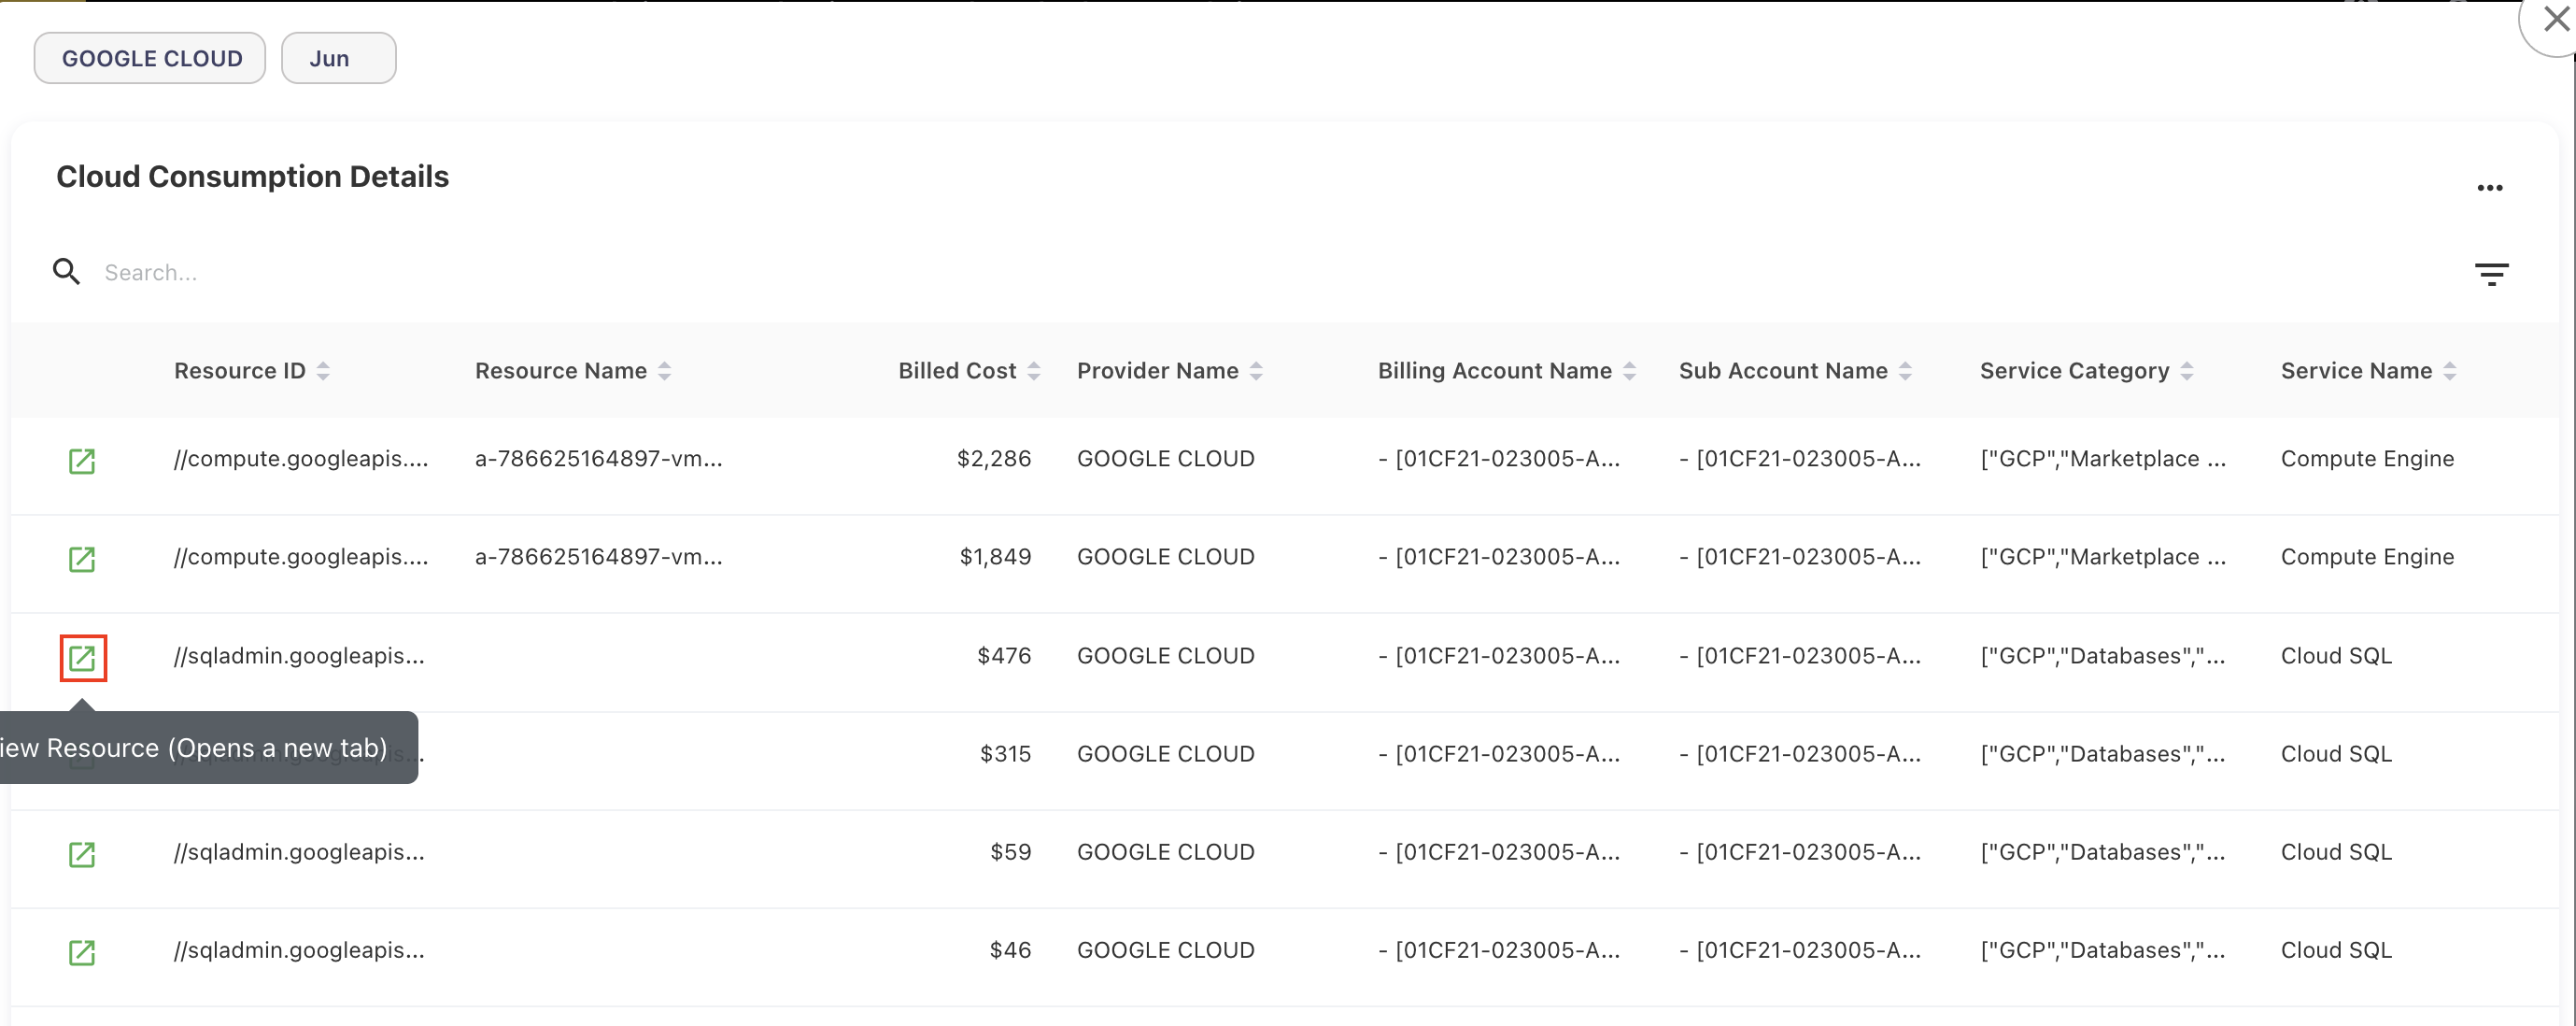
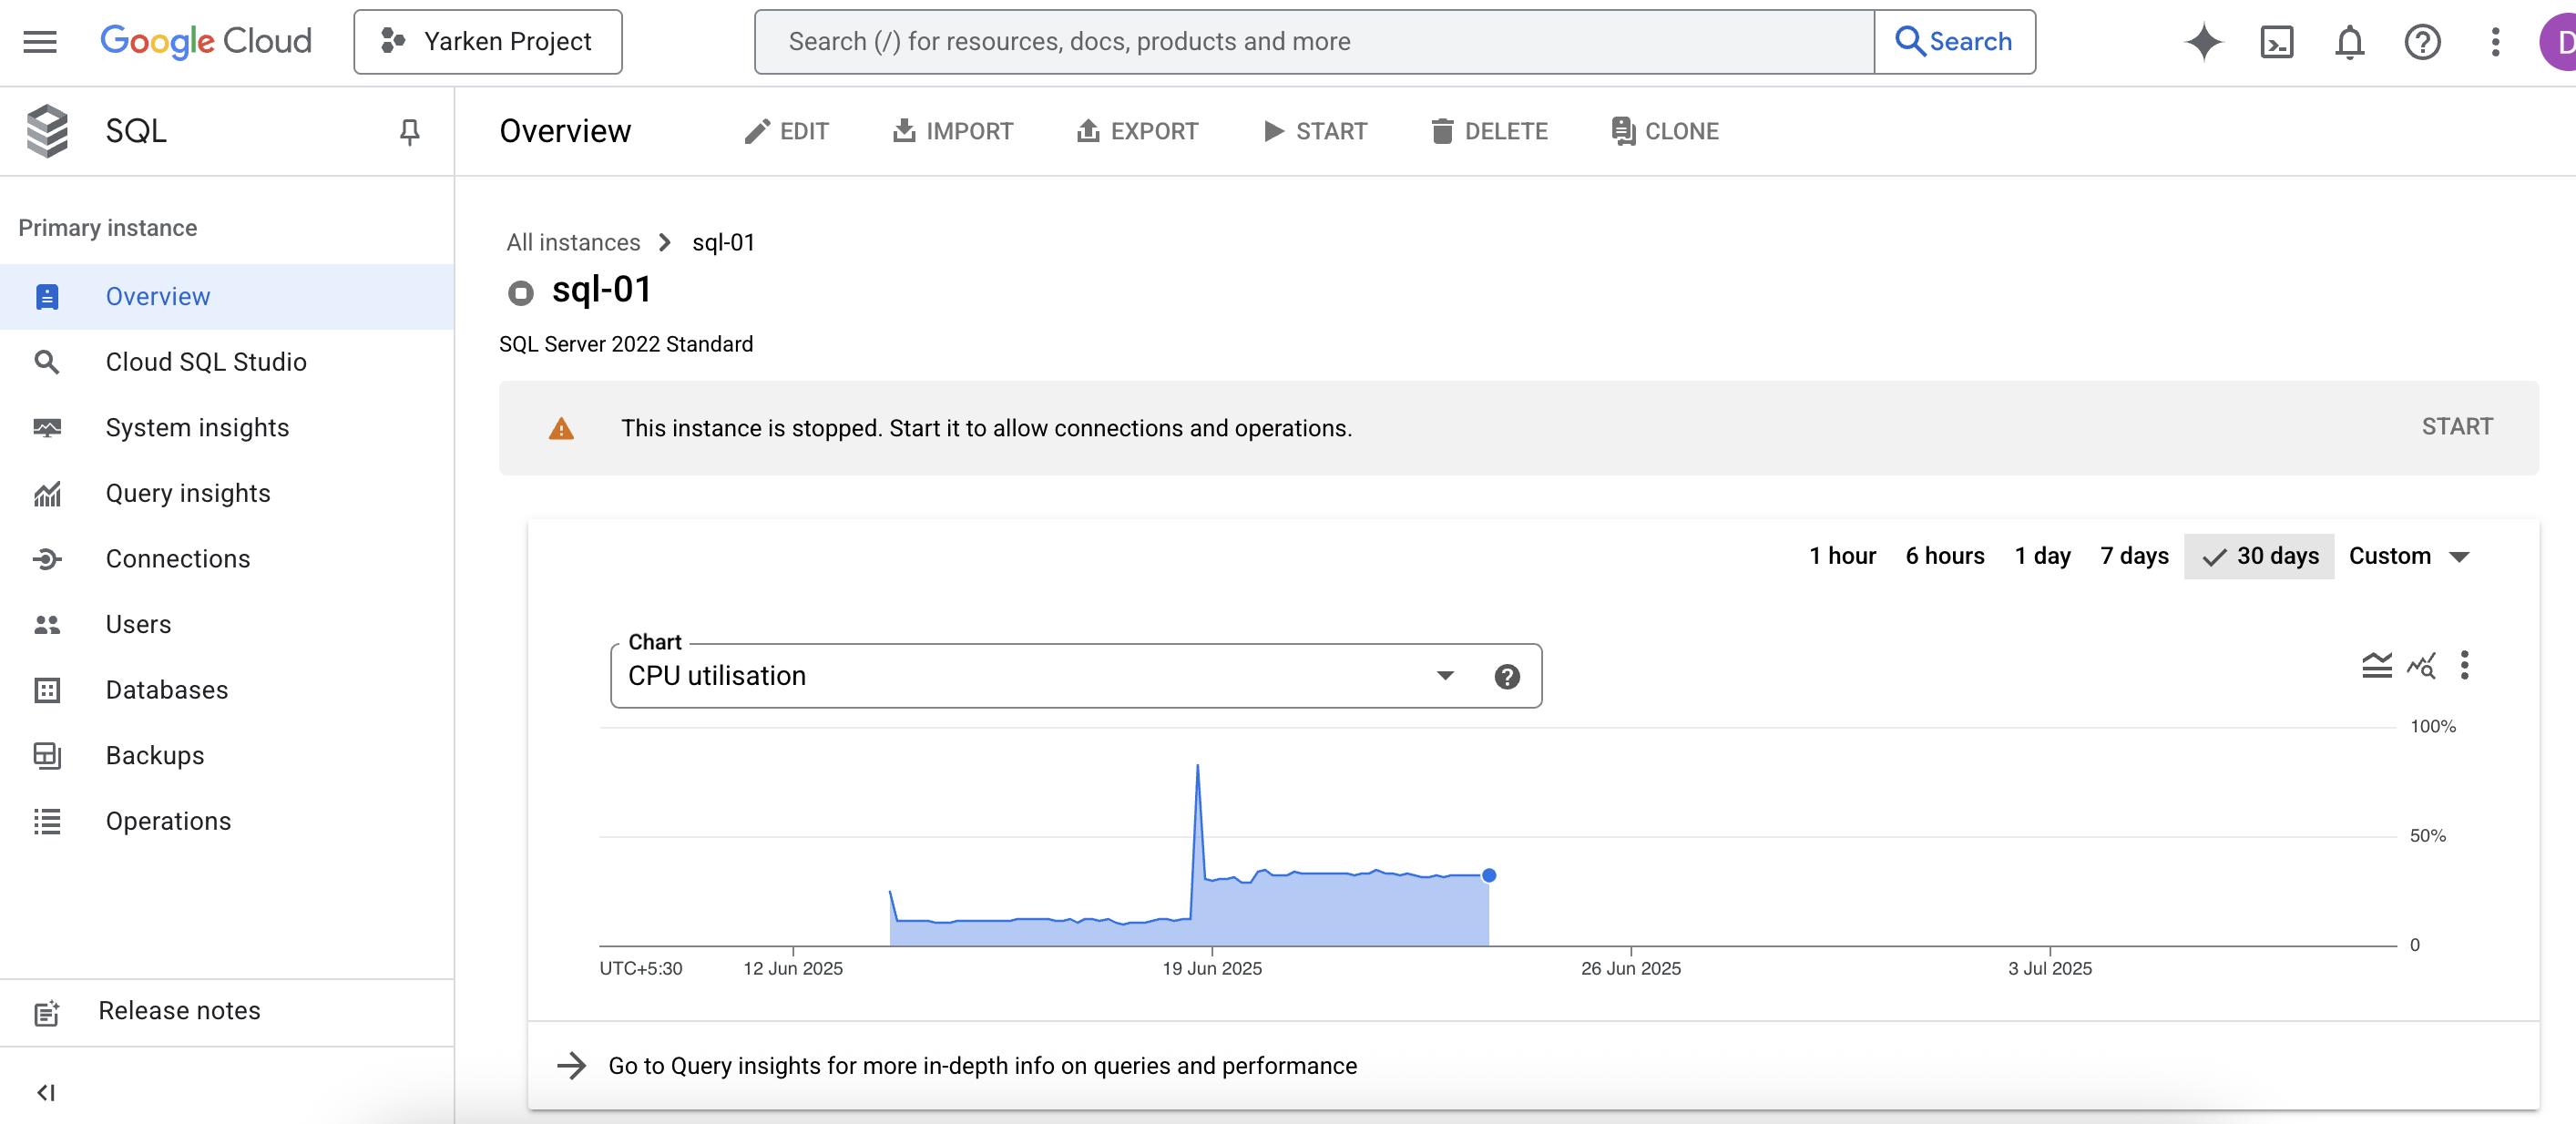
Deep Links for GCP Cloud Data
We have added a new deep link capability for Google Cloud data. Users can now navigate from a Google Cloud resource ID available in the GL popup directly to the corresponding resource page in the Google Cloud Console. This allows you to analyze specific resources in more detail without manually searching for them.
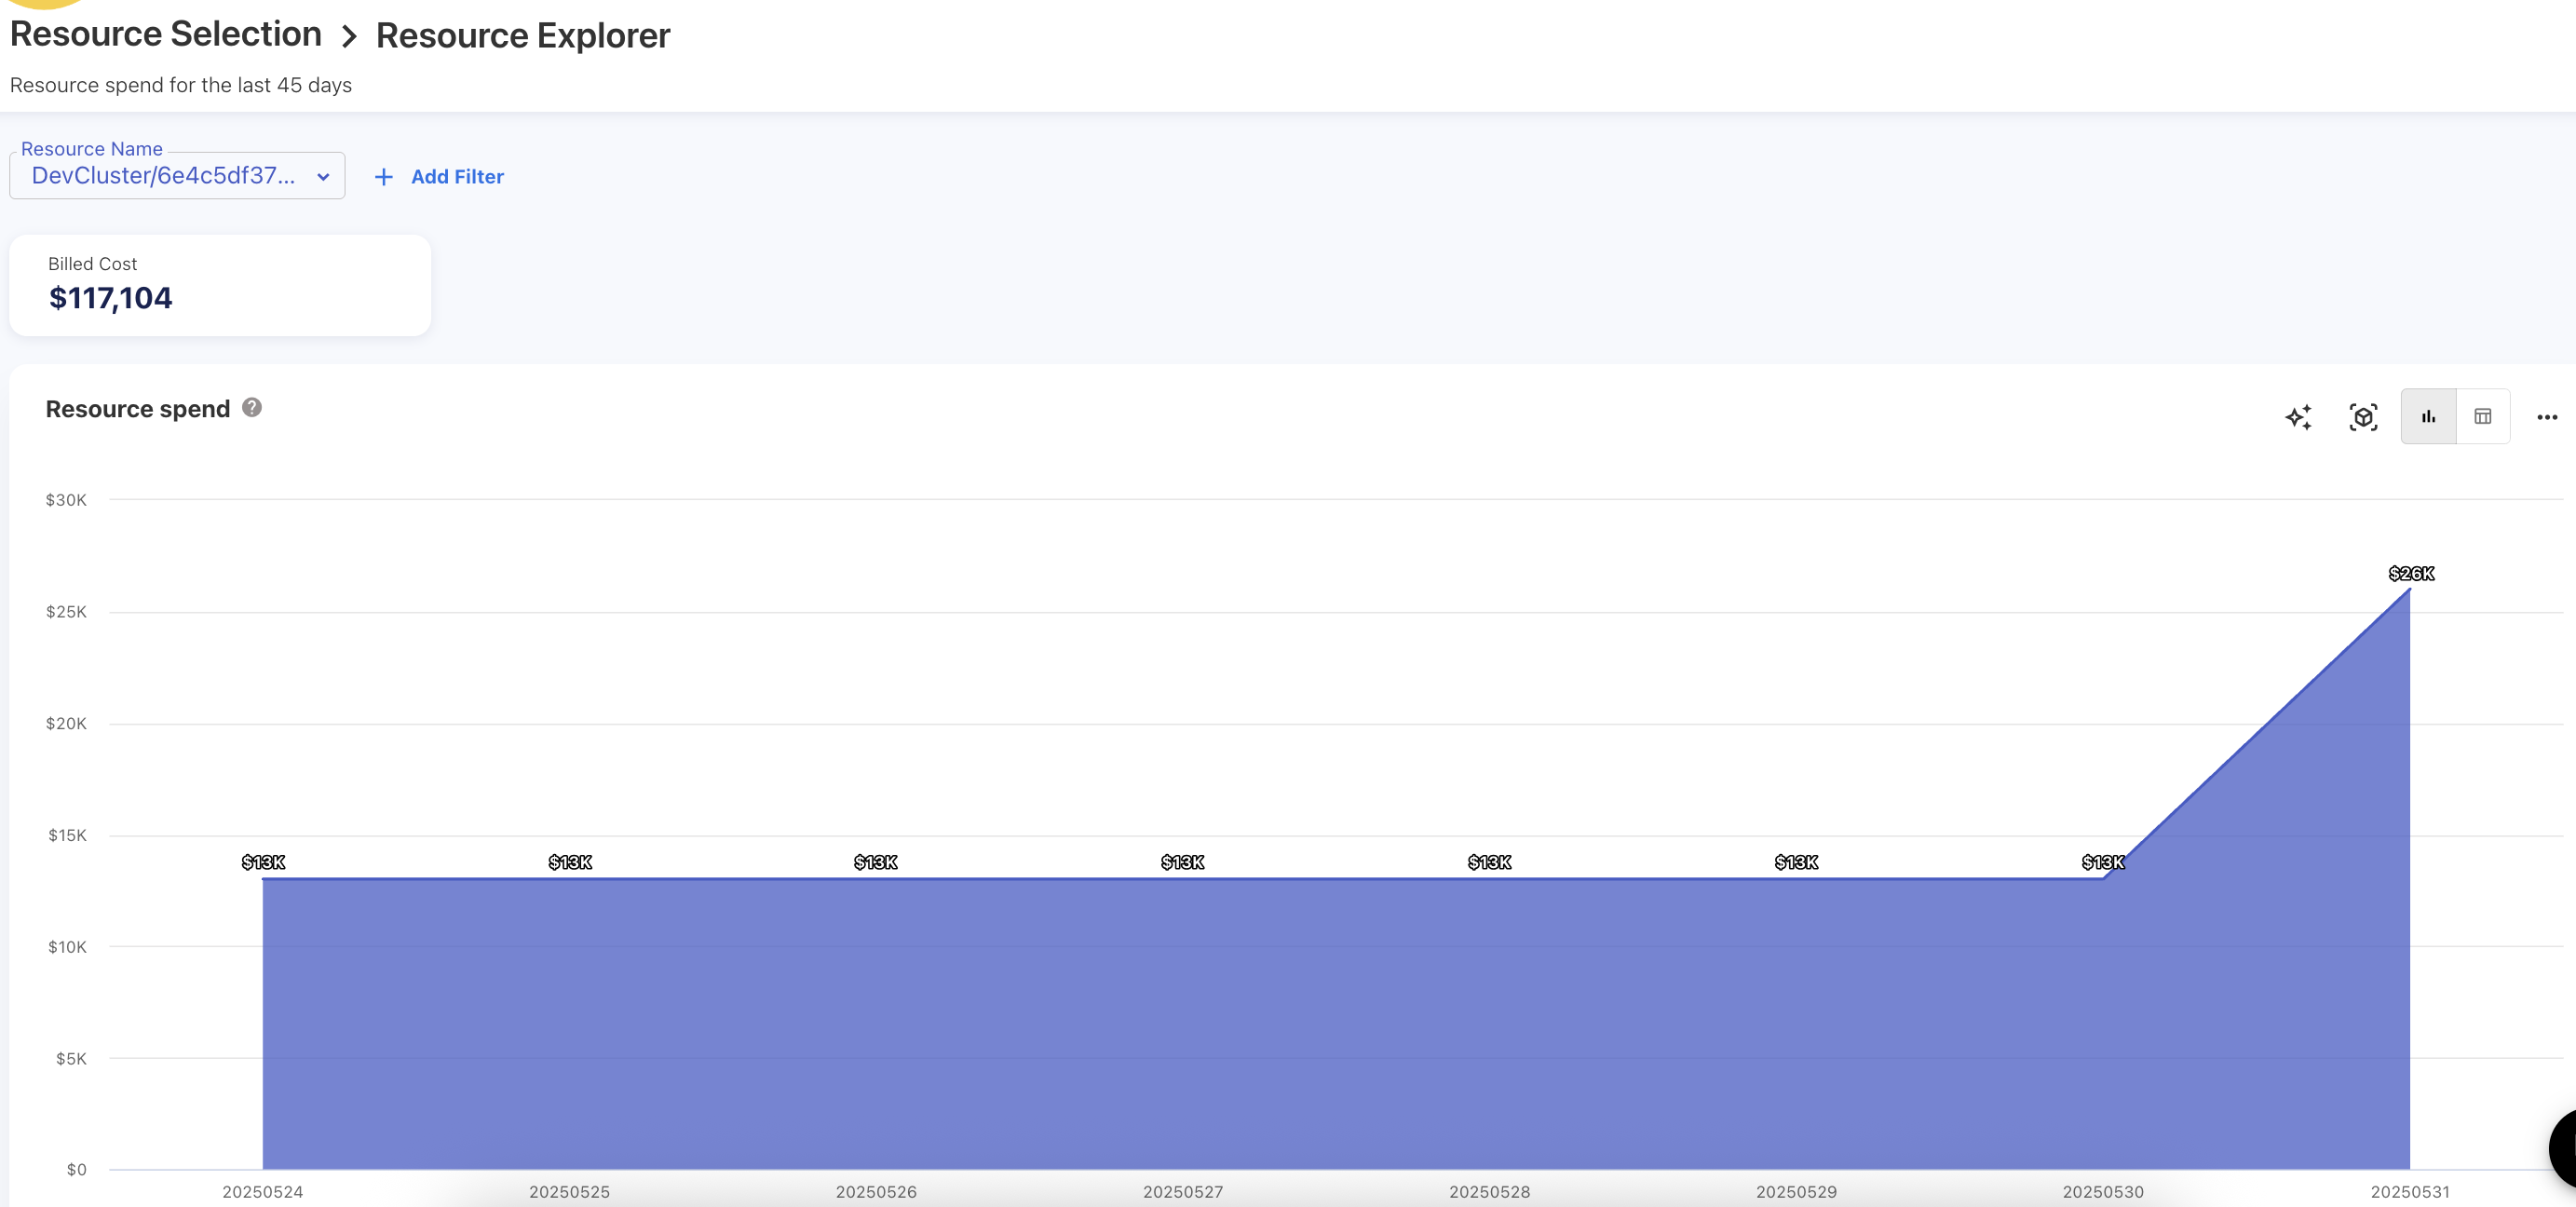
Resource Explorer - A New Dashboard
We've introduced a new Resource Explorer dashboard that analyzes daily spend trends for individual cloud resources over the past 45 days. It provides a detailed daily spend analysis for each cloud resource and helps you to track resource-level cost patterns. You can easily drill into individual resources to identify the billing account, service category, and service name to which the resource belongs. The dashboard uses an area chart to clearly illustrate resource spending trends over time.
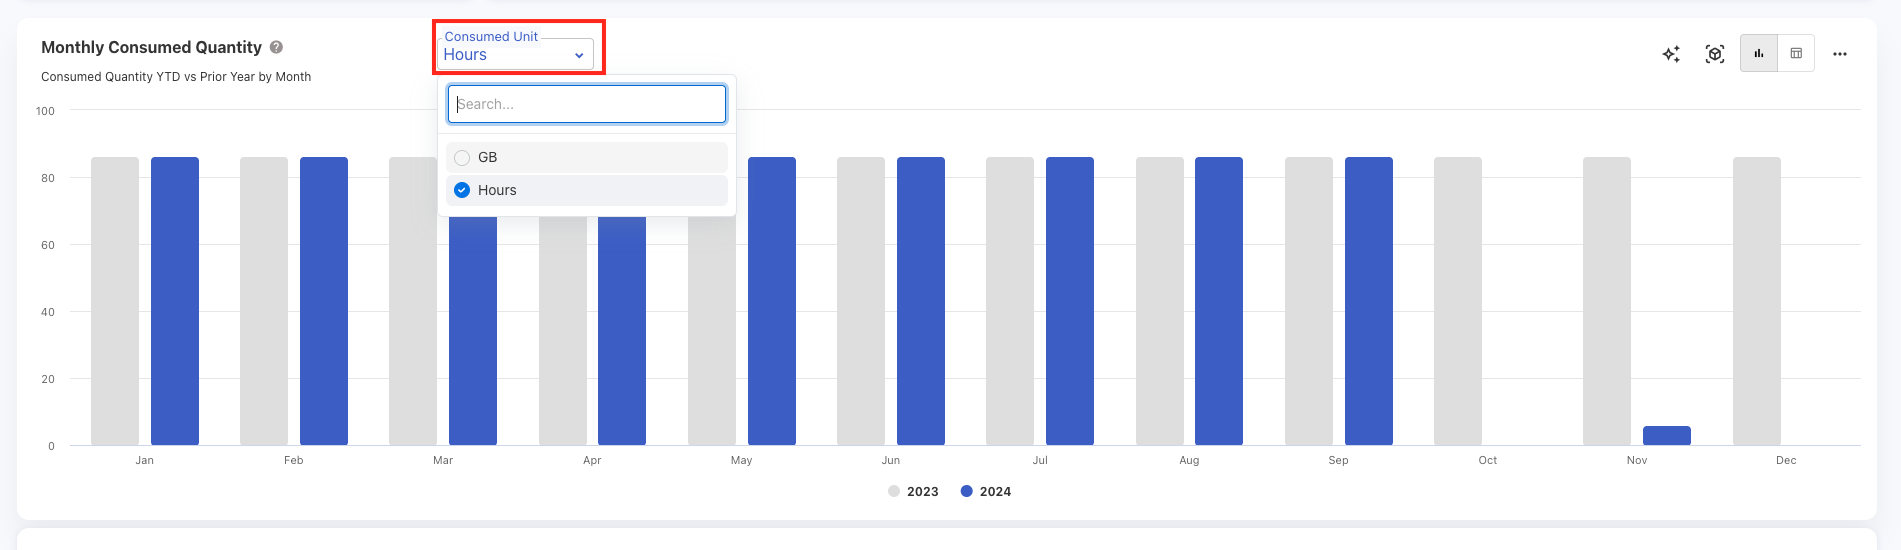
New Filter: Consumed Unit on Monthly Consumed Quantity
A new filter called Consumed Unit has been added to the Resource Spend > Monthly Consumed Quantity chart. This filter allows you to track and analyze resource usage more precisely based on the unit of consumption (for example, GB, vCPU hours, etc.). With this filter, you can better understand the resource consumption pattern by selecting the specific consumed unit.
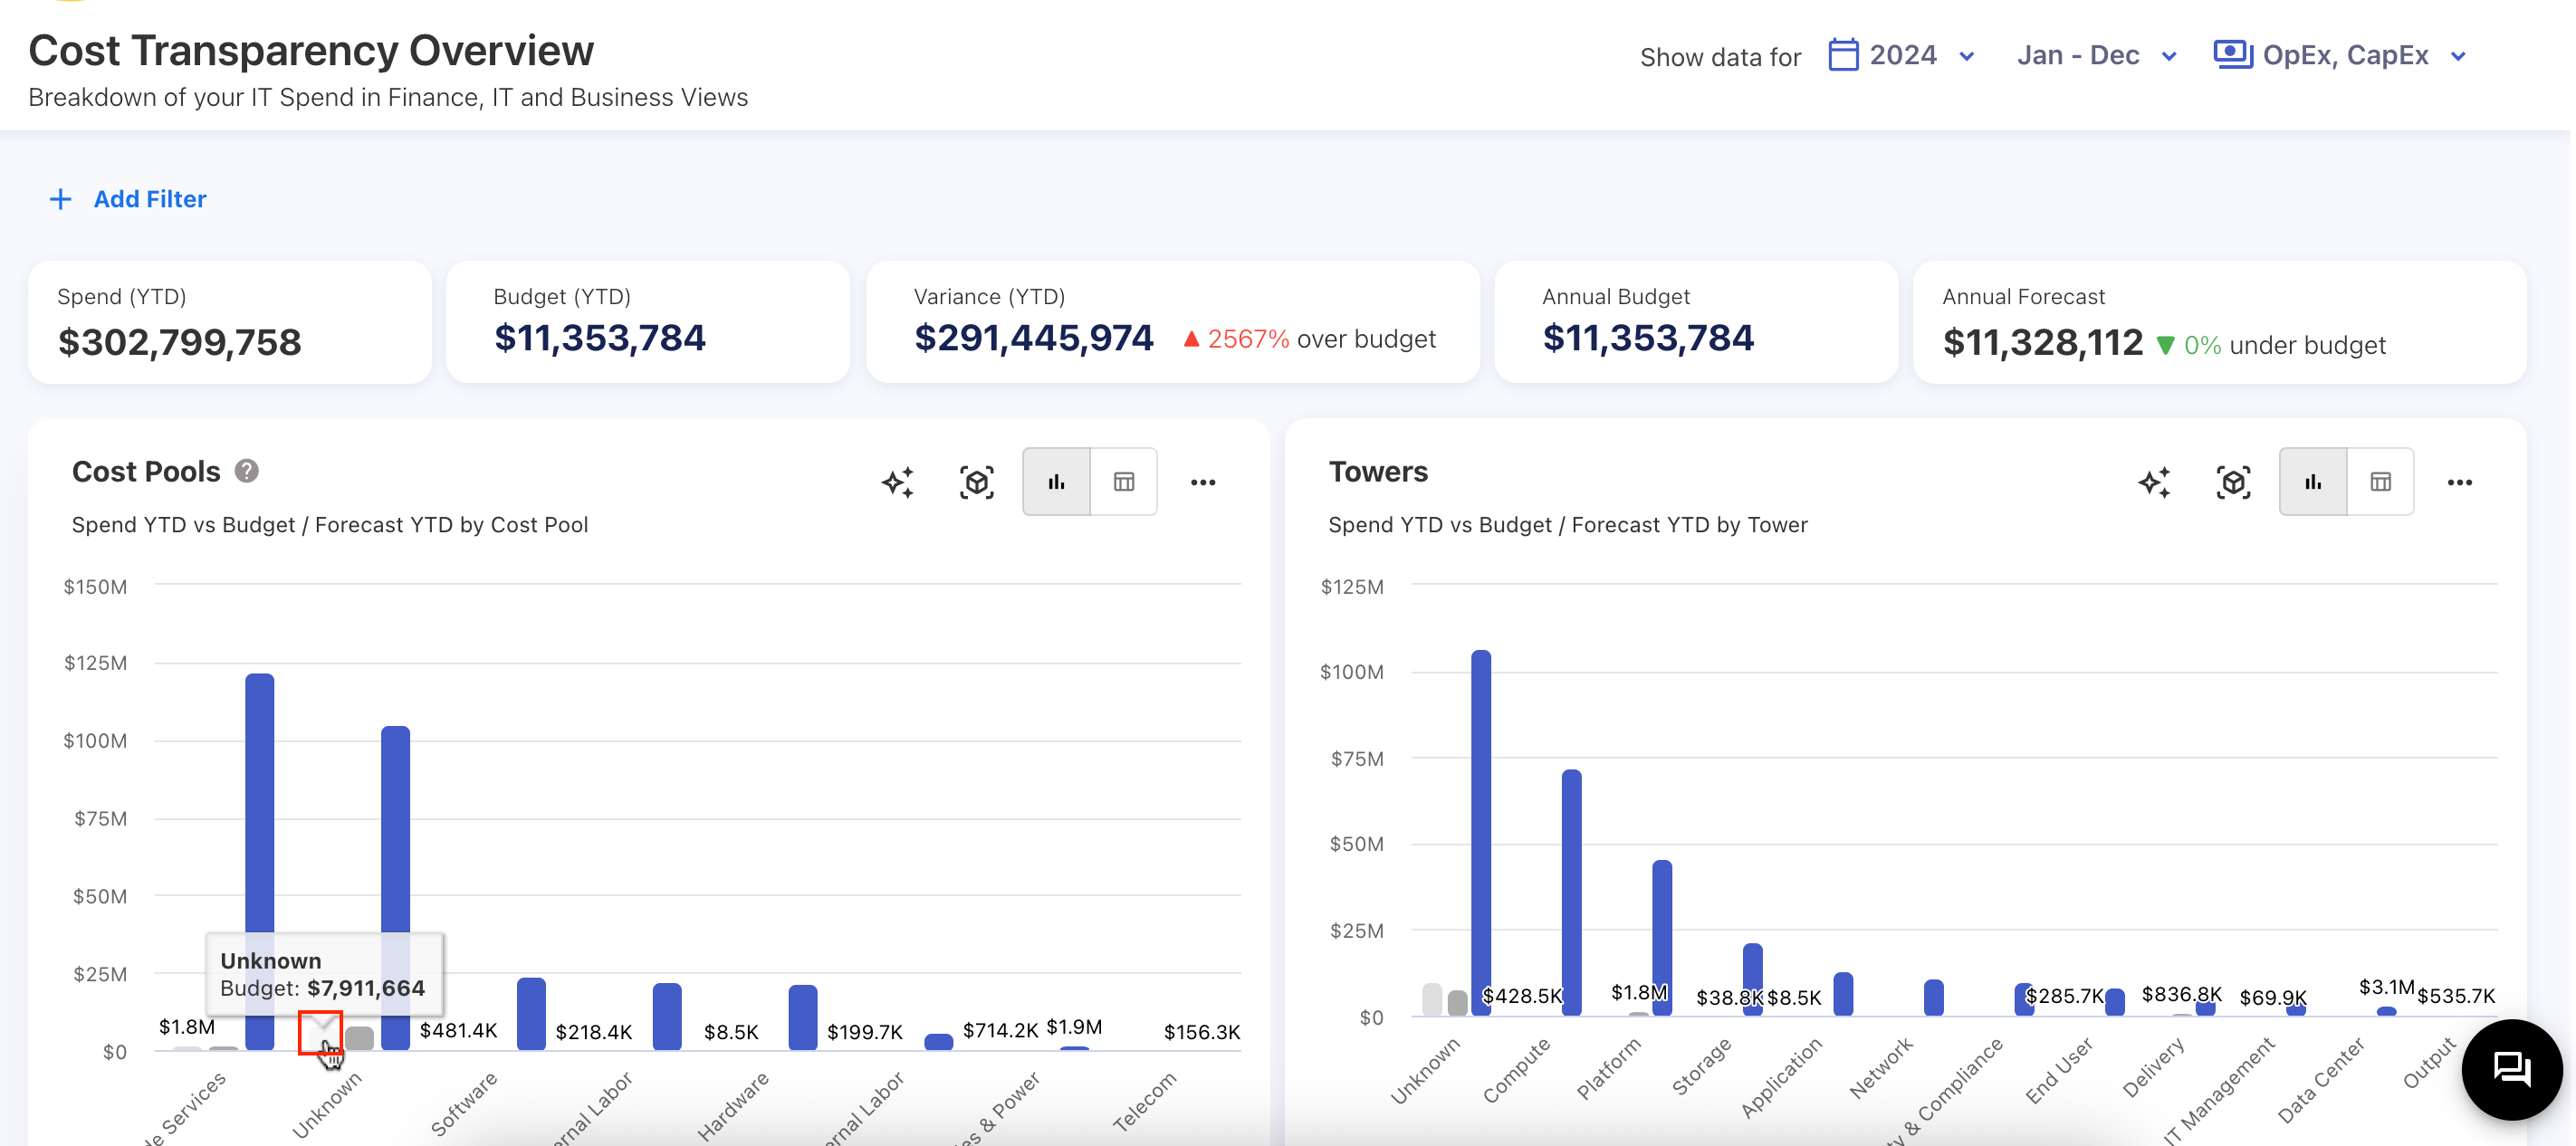
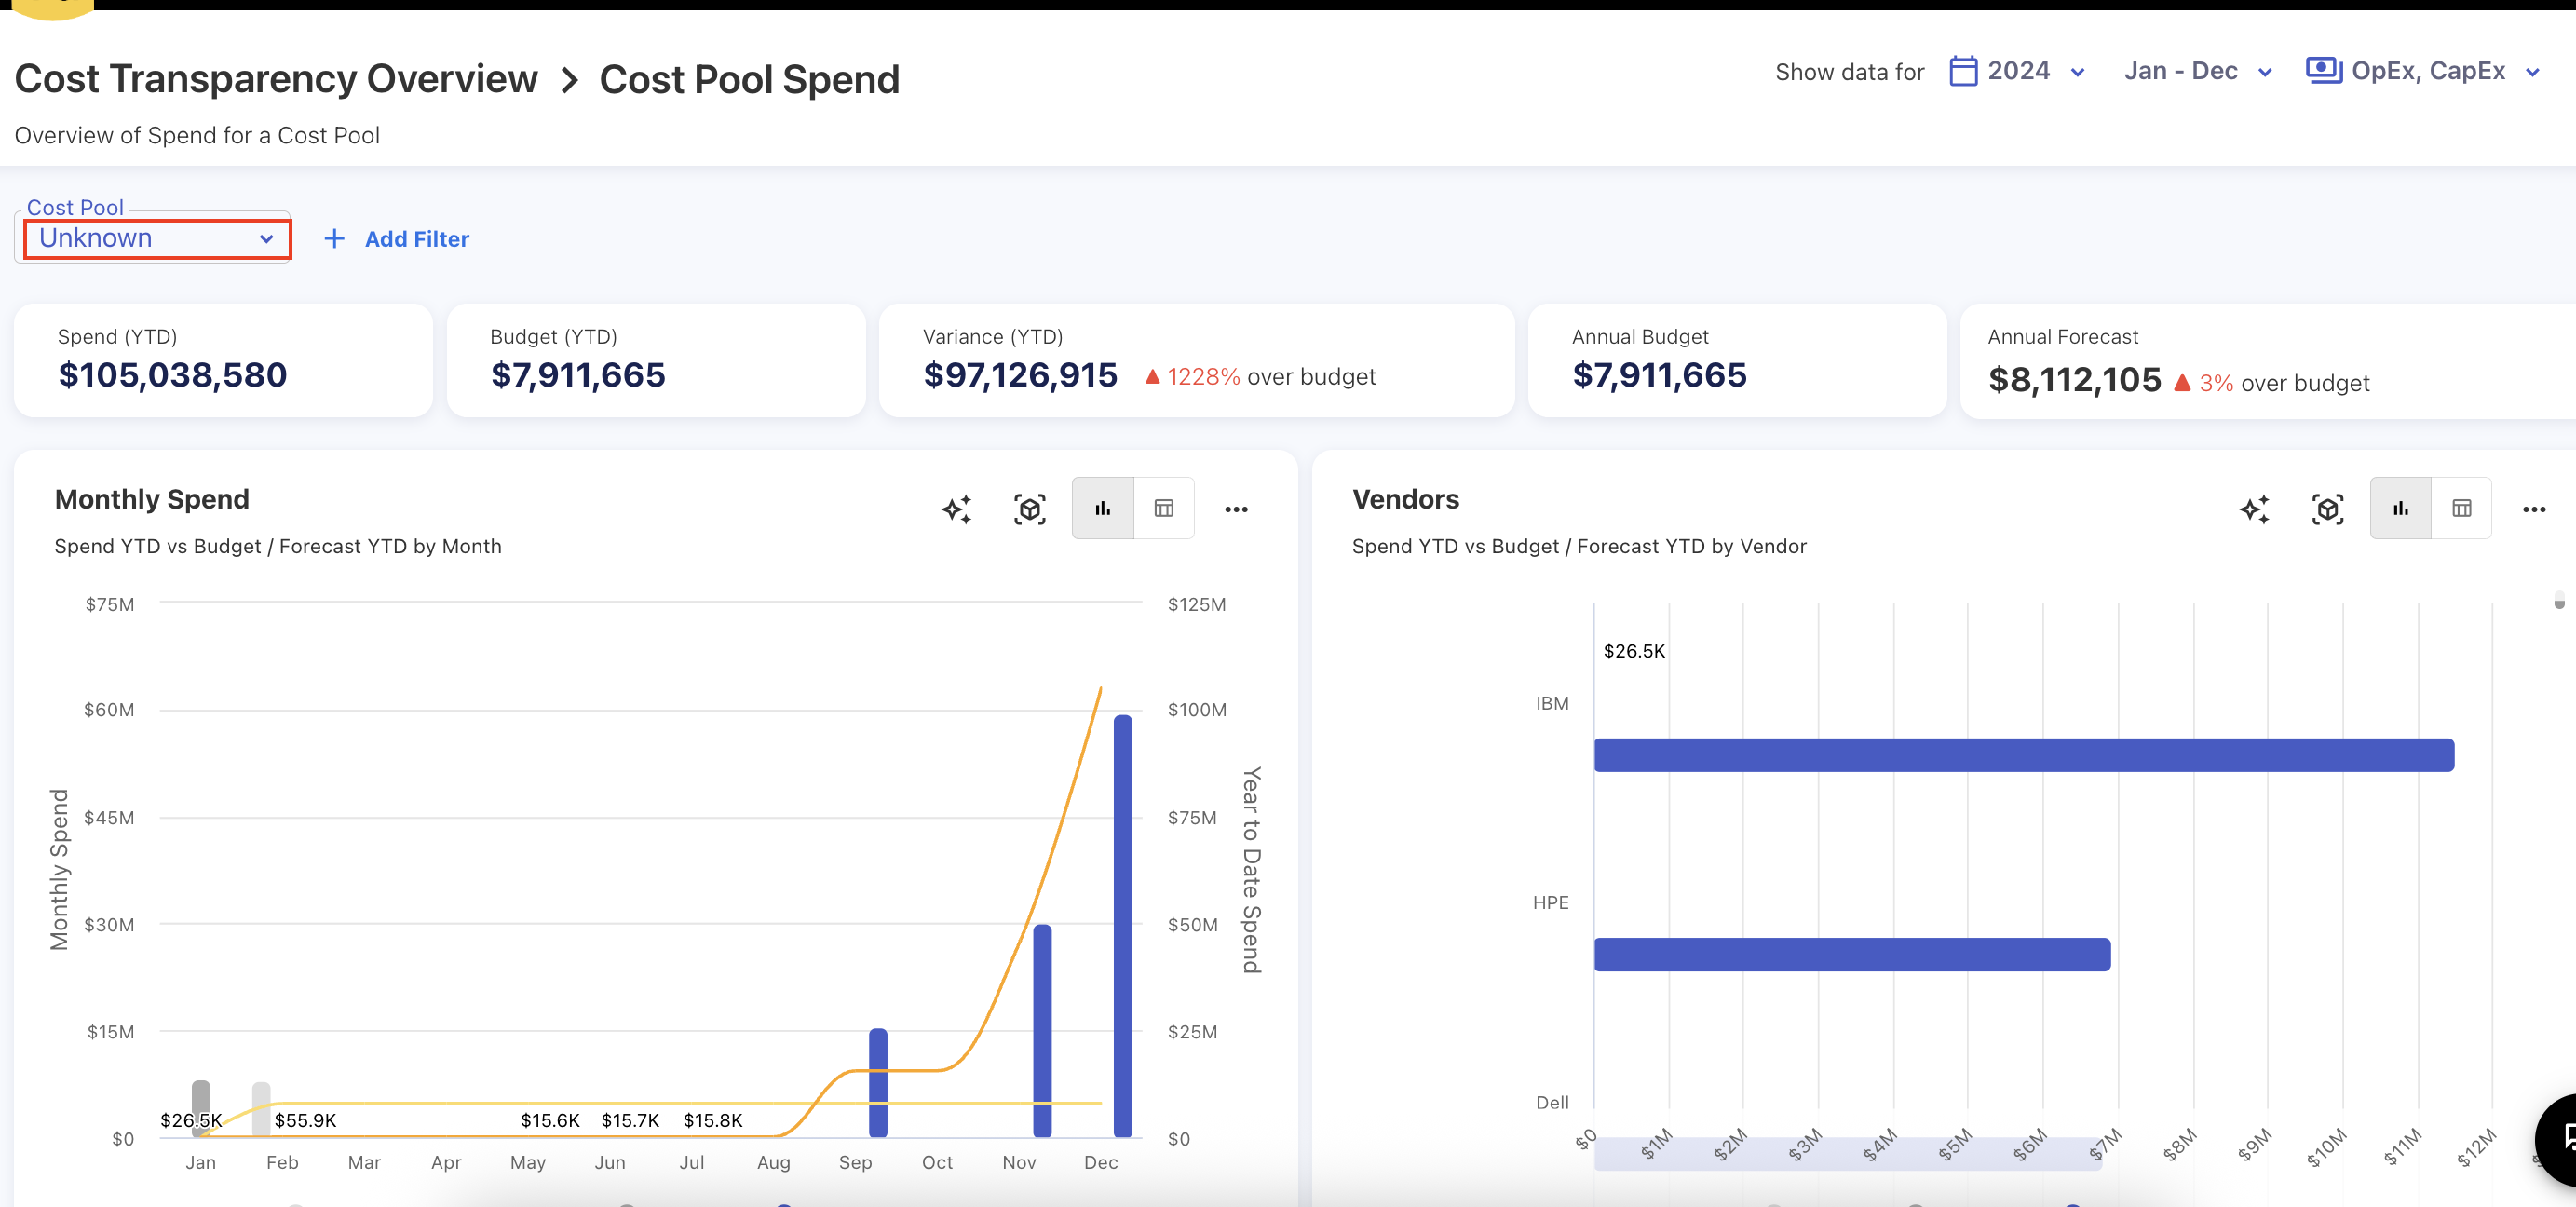
Fix for Drill Down on Unknown Values
Previously, when drilling down on Unknown values in charts or filters, the system was passing the value as Unknown instead of null. This caused charts, reports, and pop-ups to show No Data and fail to render properly. This issue has now been fixed. Charts, reports, and popups all work correctly for Unknown values.
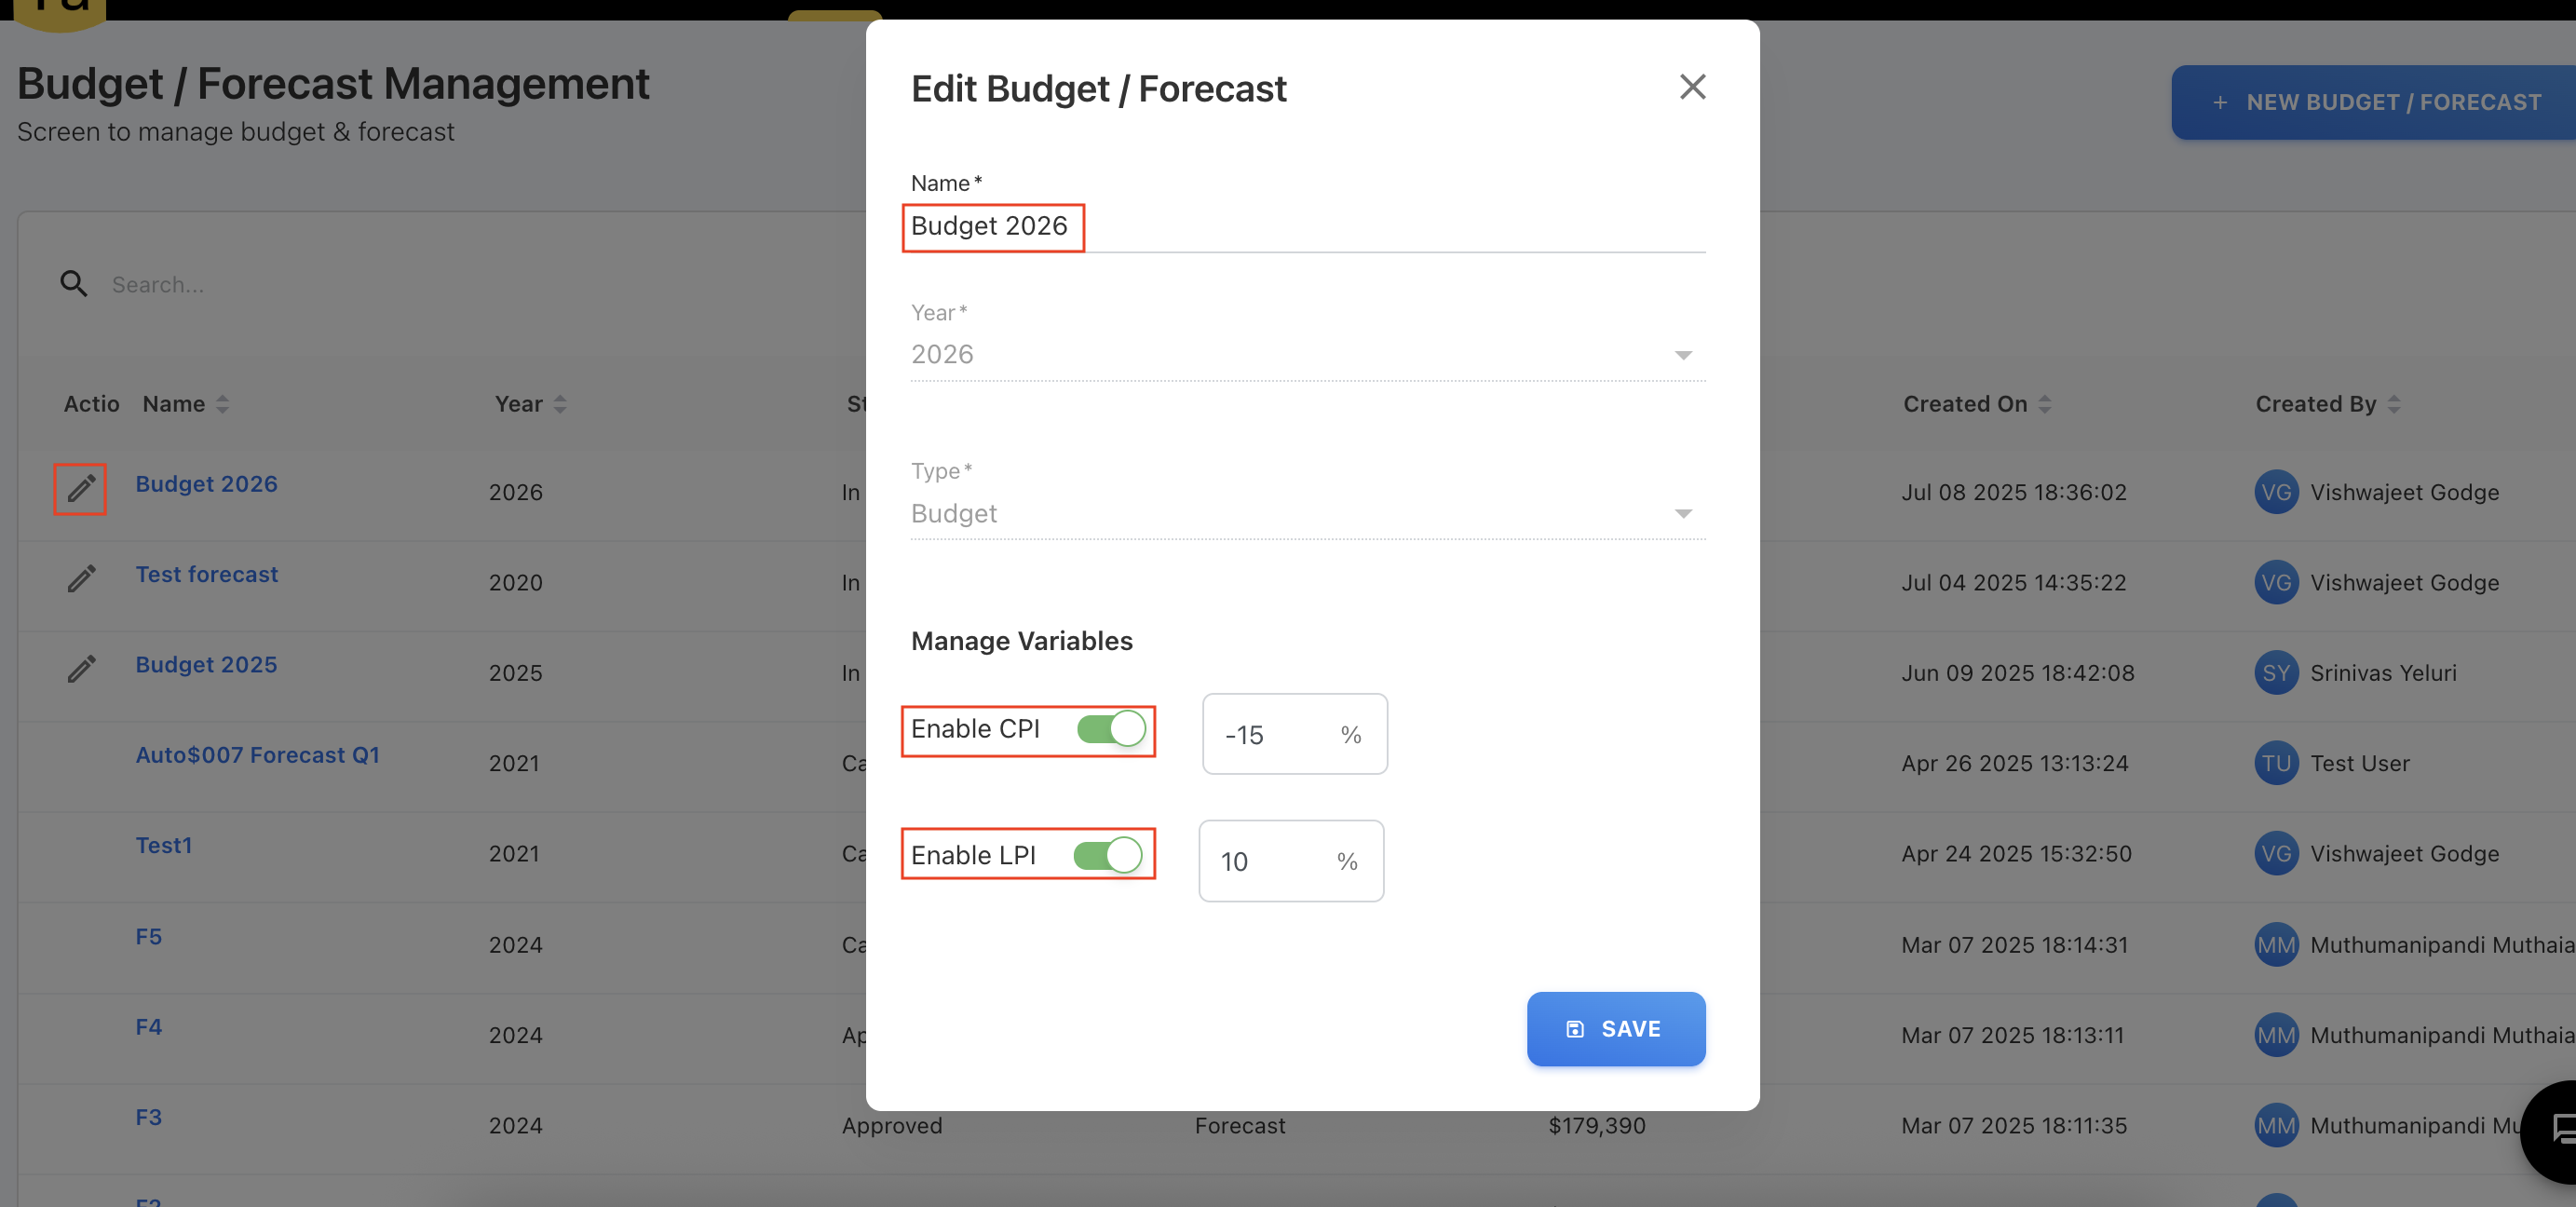
CPI and LPI Edits
In the Budgets and Forecast modules, LPI and CPI values are now editable when the budget or forecast is in Draft, In-Progress, or Completed status. Additionally, users can now update the budget or forecast name while in these statuses. The CPI and LPI variables can also include negative values.
Jun 30, 2025
Enhancements
FOCUS 1.0 Aligned GCP File Integration
We’ve added support for loading FOCUS 1.0 aligned GCP billing files directly into the application. With this enhancement, users can now seamlessly upload and analyze GCP cost and usage data in alignment with FOCUS 1.0 standards.
The GCP files can be manually loaded through the application or scheduled using our Pipeline functionality. With the Pipeline feature, users can configure a connection to automatically upload files directly from a bucket storage location. Once defined, the pipeline will automatically fetch and upload the consumption files at scheduled intervals. After successfully loading the GCP usage data, users can access existing cloud dashboards for detailed reporting and analysis.
With this enhancement, we now fully support ingestion and analysis of cloud consumption data in FOCUS format for AWS, Azure, and GCP, providing a unified platform to track the cloud spend for all major cloud providers.
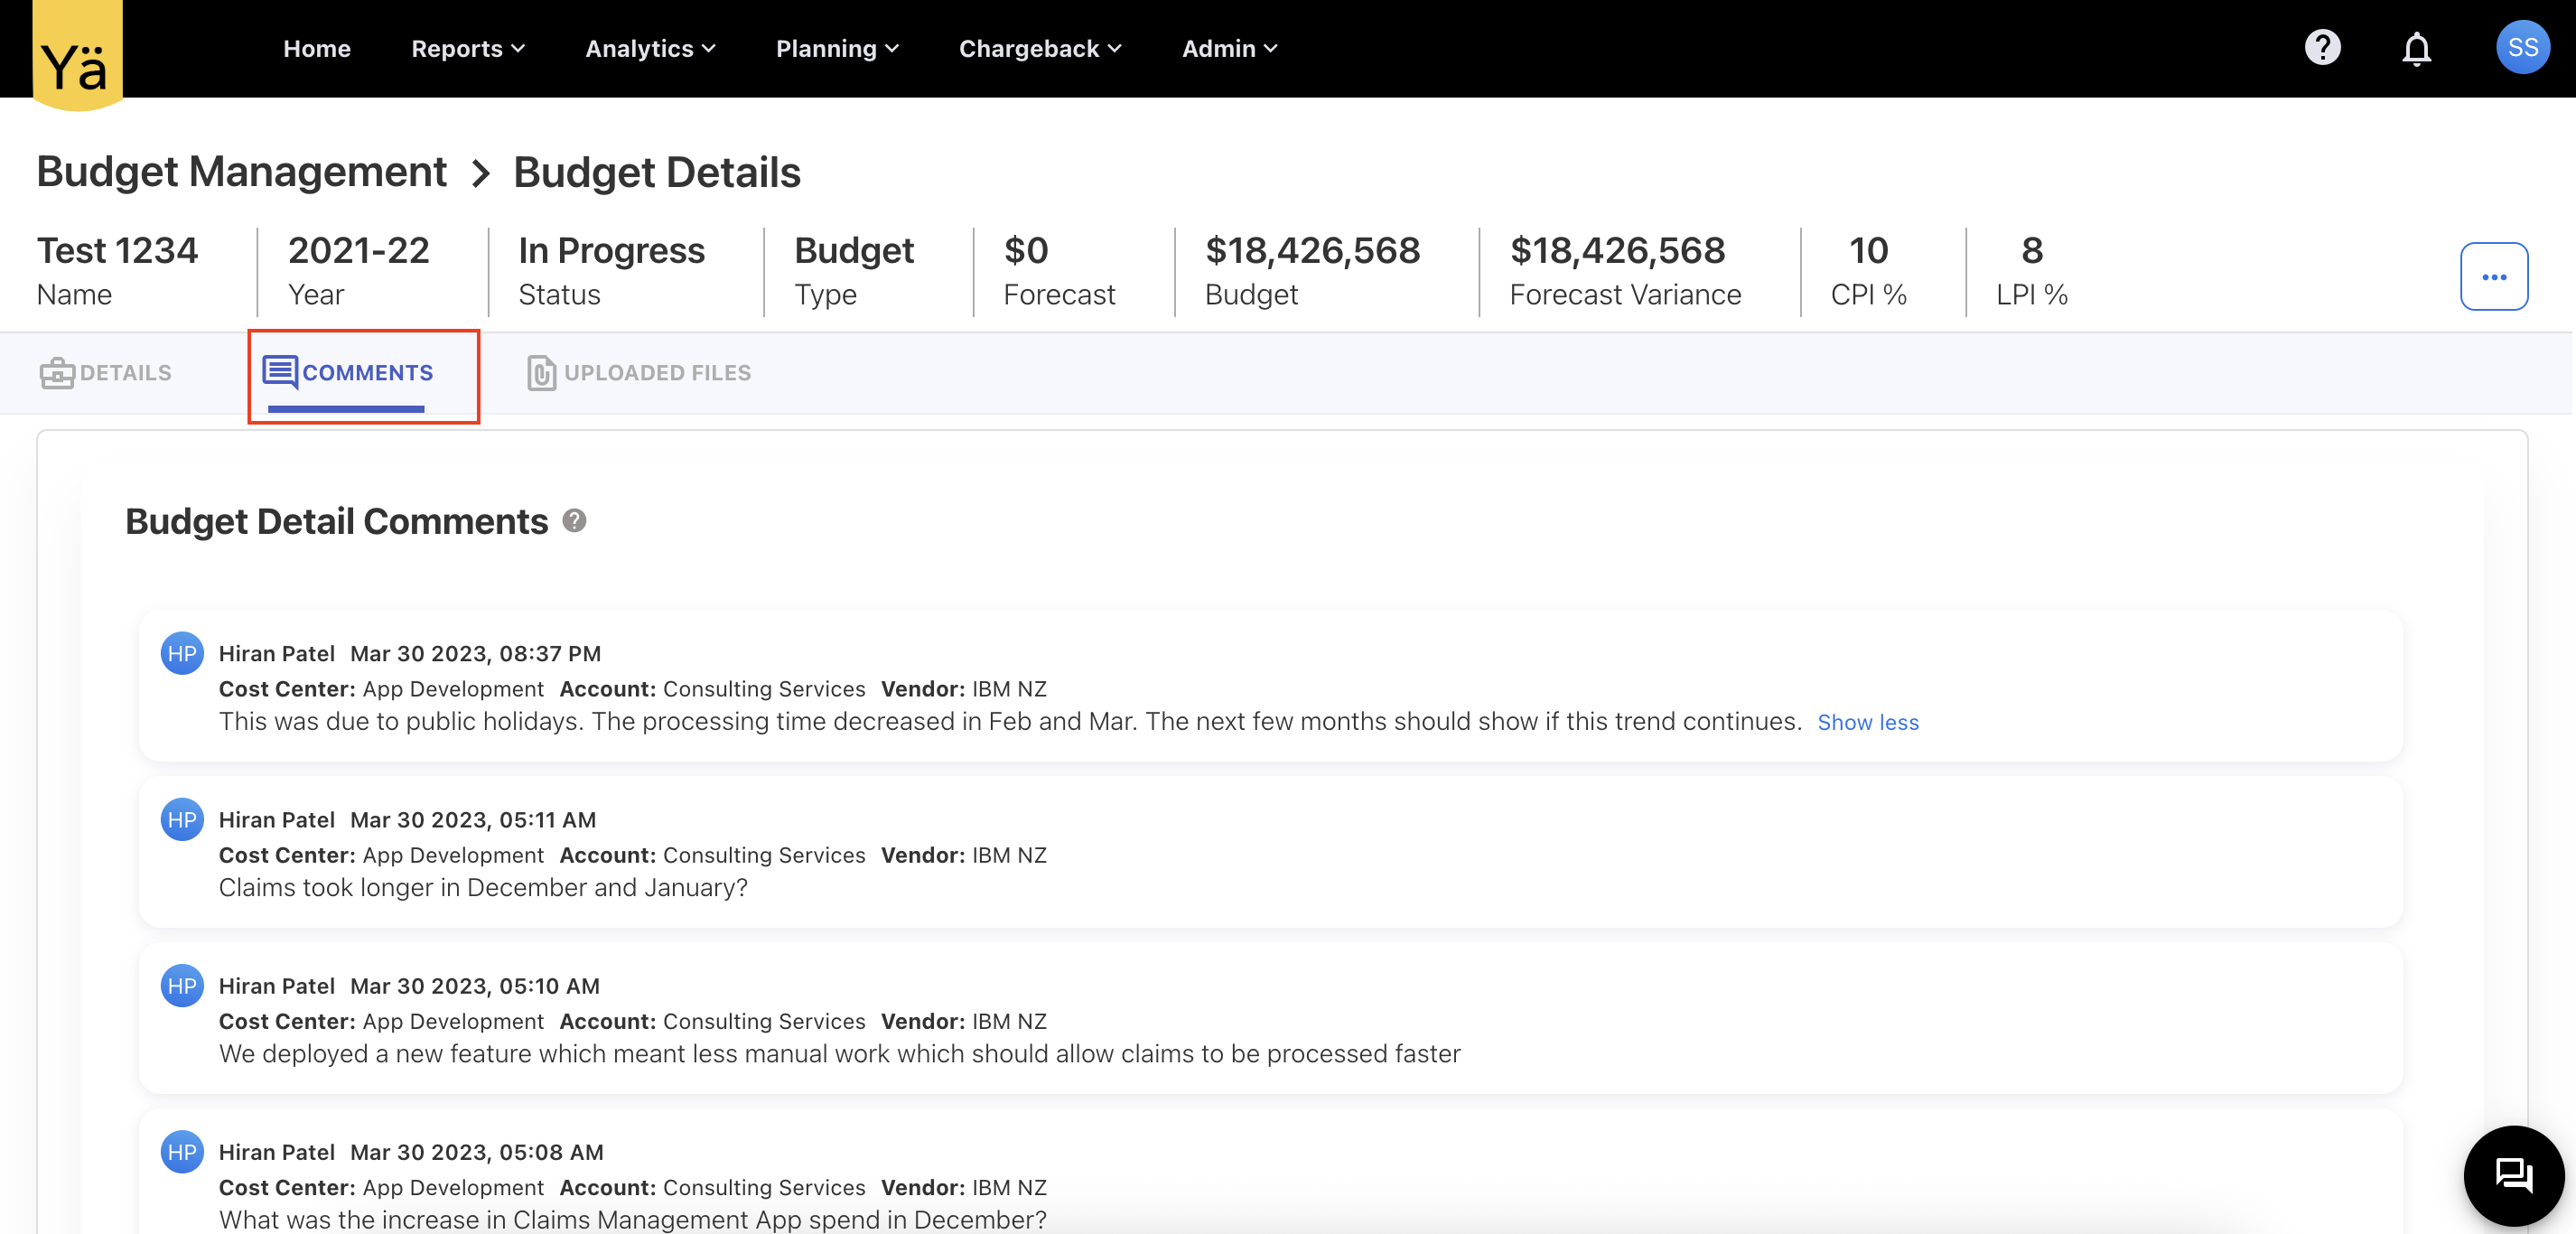
Comments Log in Budget and Forecast
A new Comments tab is added on the Budget and Forecast details pages. This tab consolidates all comments for the respective budget or forecast. It lists comments from every line item along with associated account and cost center details, allowing you to track and review all related feedback in one place.
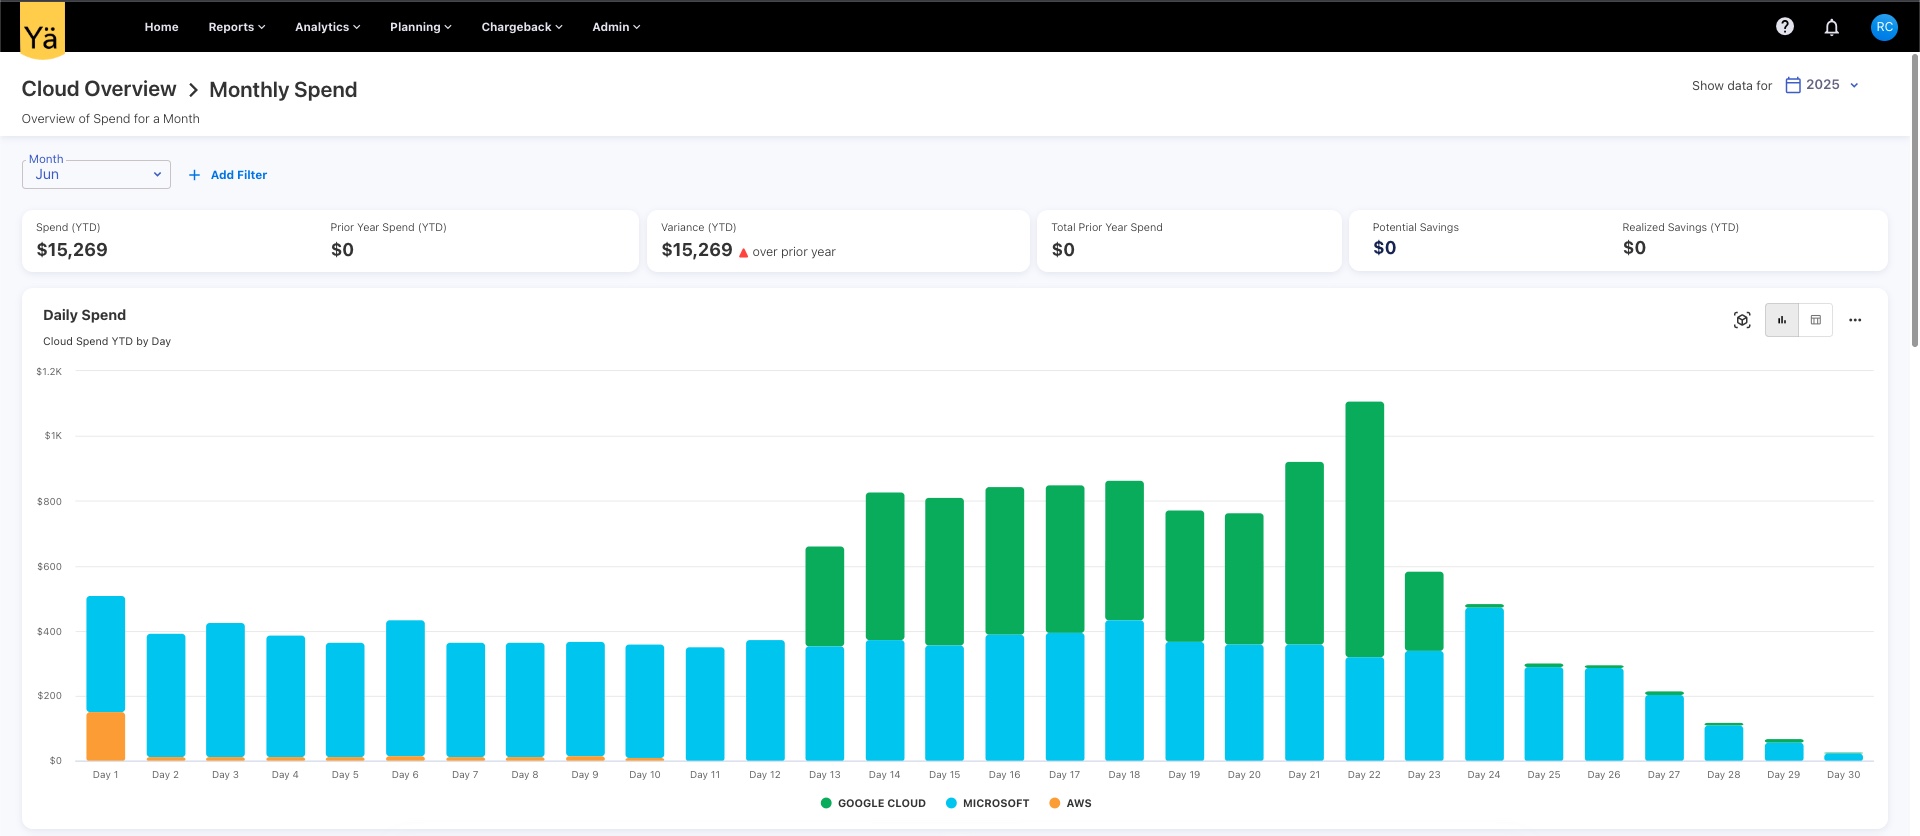
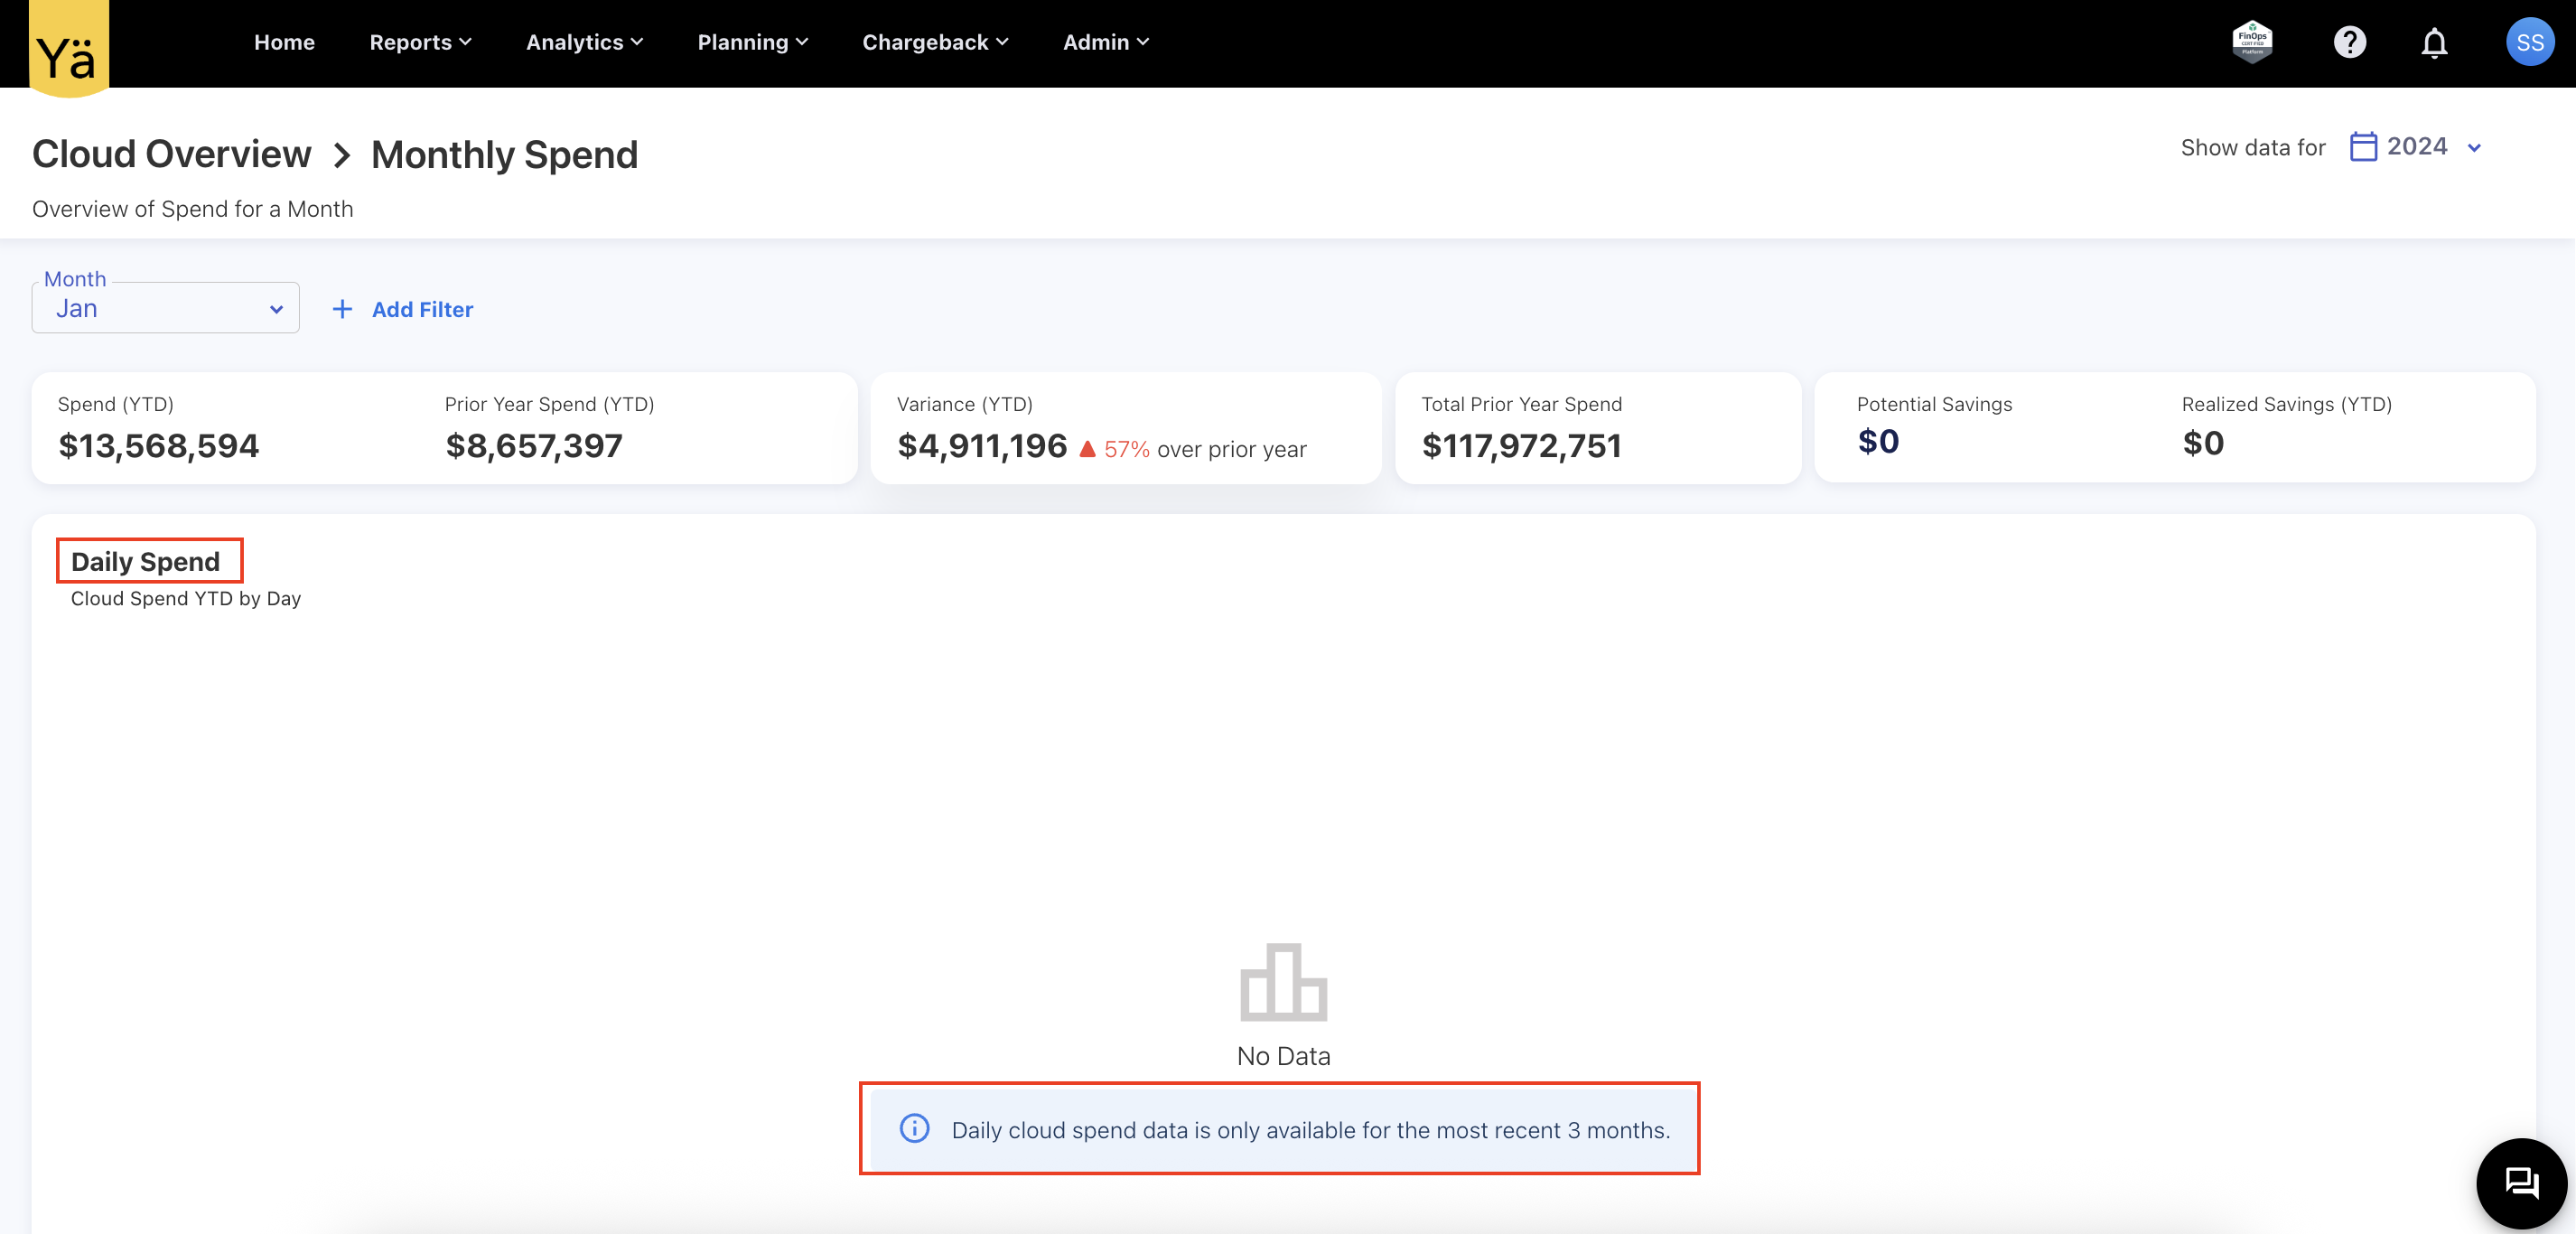
Info Message on Daily Spend Chart in Cloud Overview
The Daily Spend chart in the Cloud Overview dashboard has been updated to include a clear notation when the No Data message appears. The info message is added to inform users that daily cloud spend data is only available for the most recent configured months (depending on environments, this could be 1, 2, 3 or any months).
Jun 23, 2025
Enhancements
Ask YäRKEN Enhancements
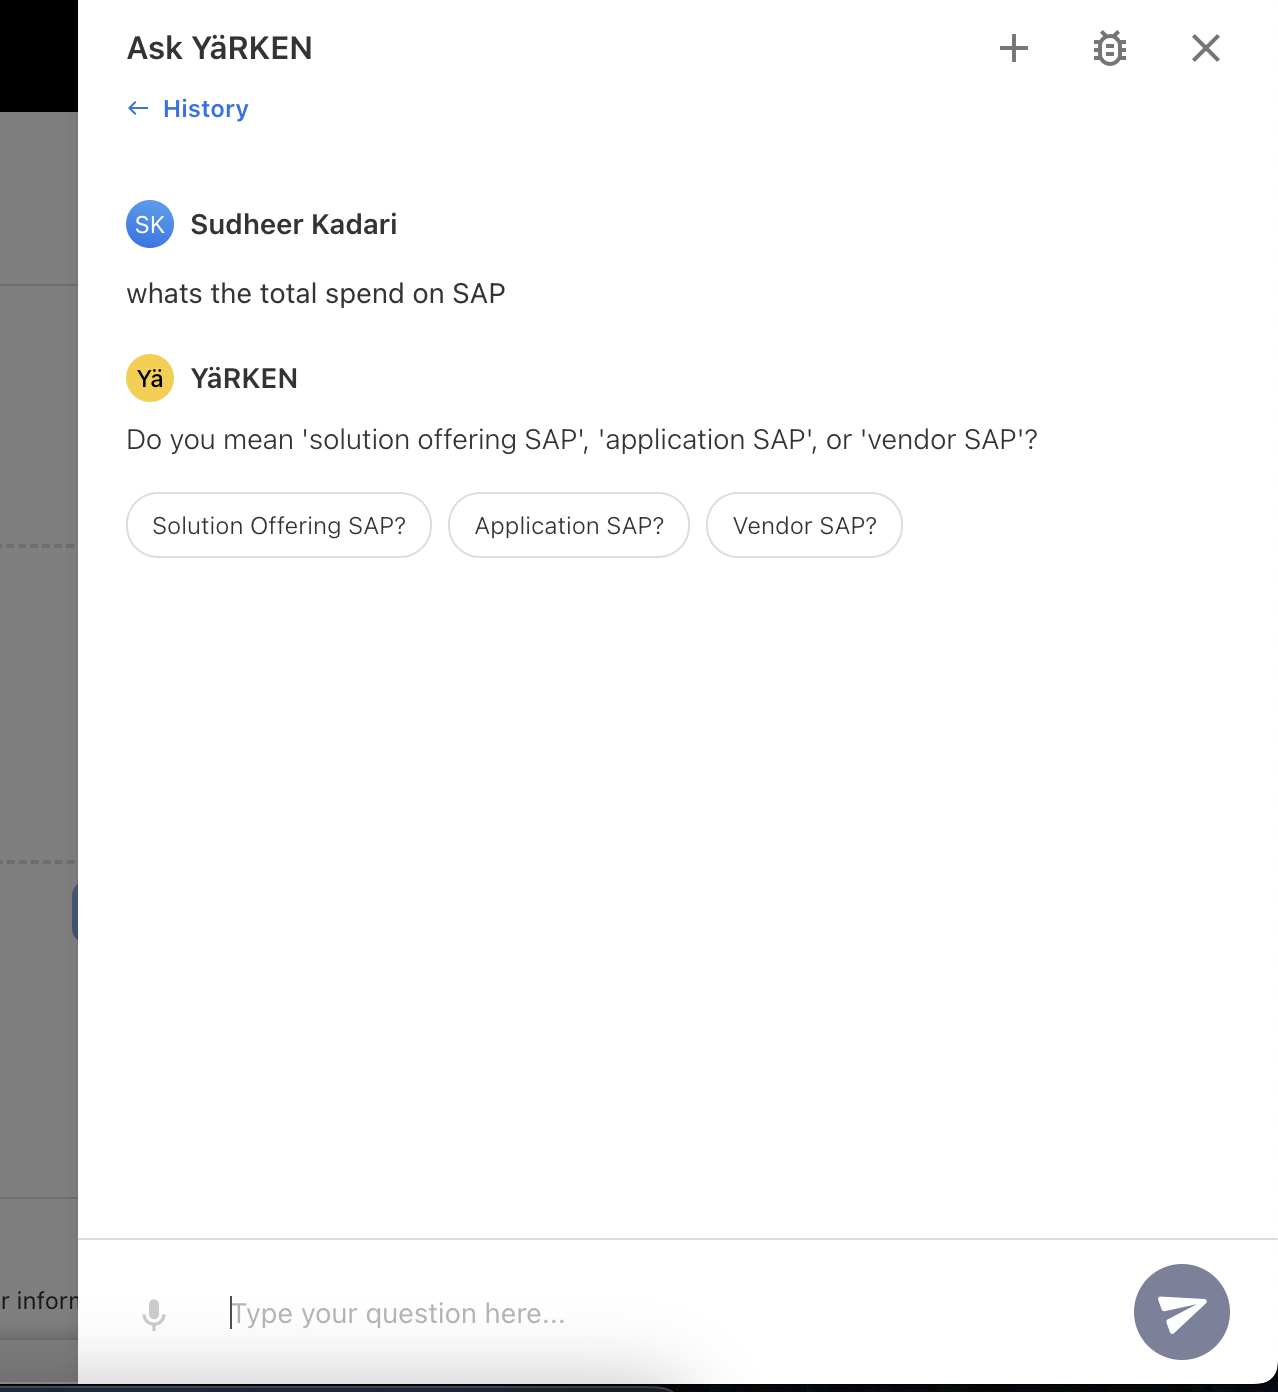
We’ve upgraded Ask YäRKEN to handle unclear or ambiguous questions more effectively by migrating existing framework to LangGraph-based workflow. This new, modular, and agentic framework allows the AI to better manage complex tasks and adapt dynamically to user queries. The model also integrated with Vector stores for better context handling and ambiguity detection.
When any word or term in the question could have multiple meanings, the AI model will proactively suggest possible interpretations to quickly guide you to the right answer.
For example, when asked, “What’s the total spend on SAP?” it will clarify the request by providing the helpful follow-up question like, “Do you mean 'solution offering SAP,' 'application SAP,' or 'vendor SAP'?”.
This upgrade enhances our AI model's contextual understanding by providing accurate responses.
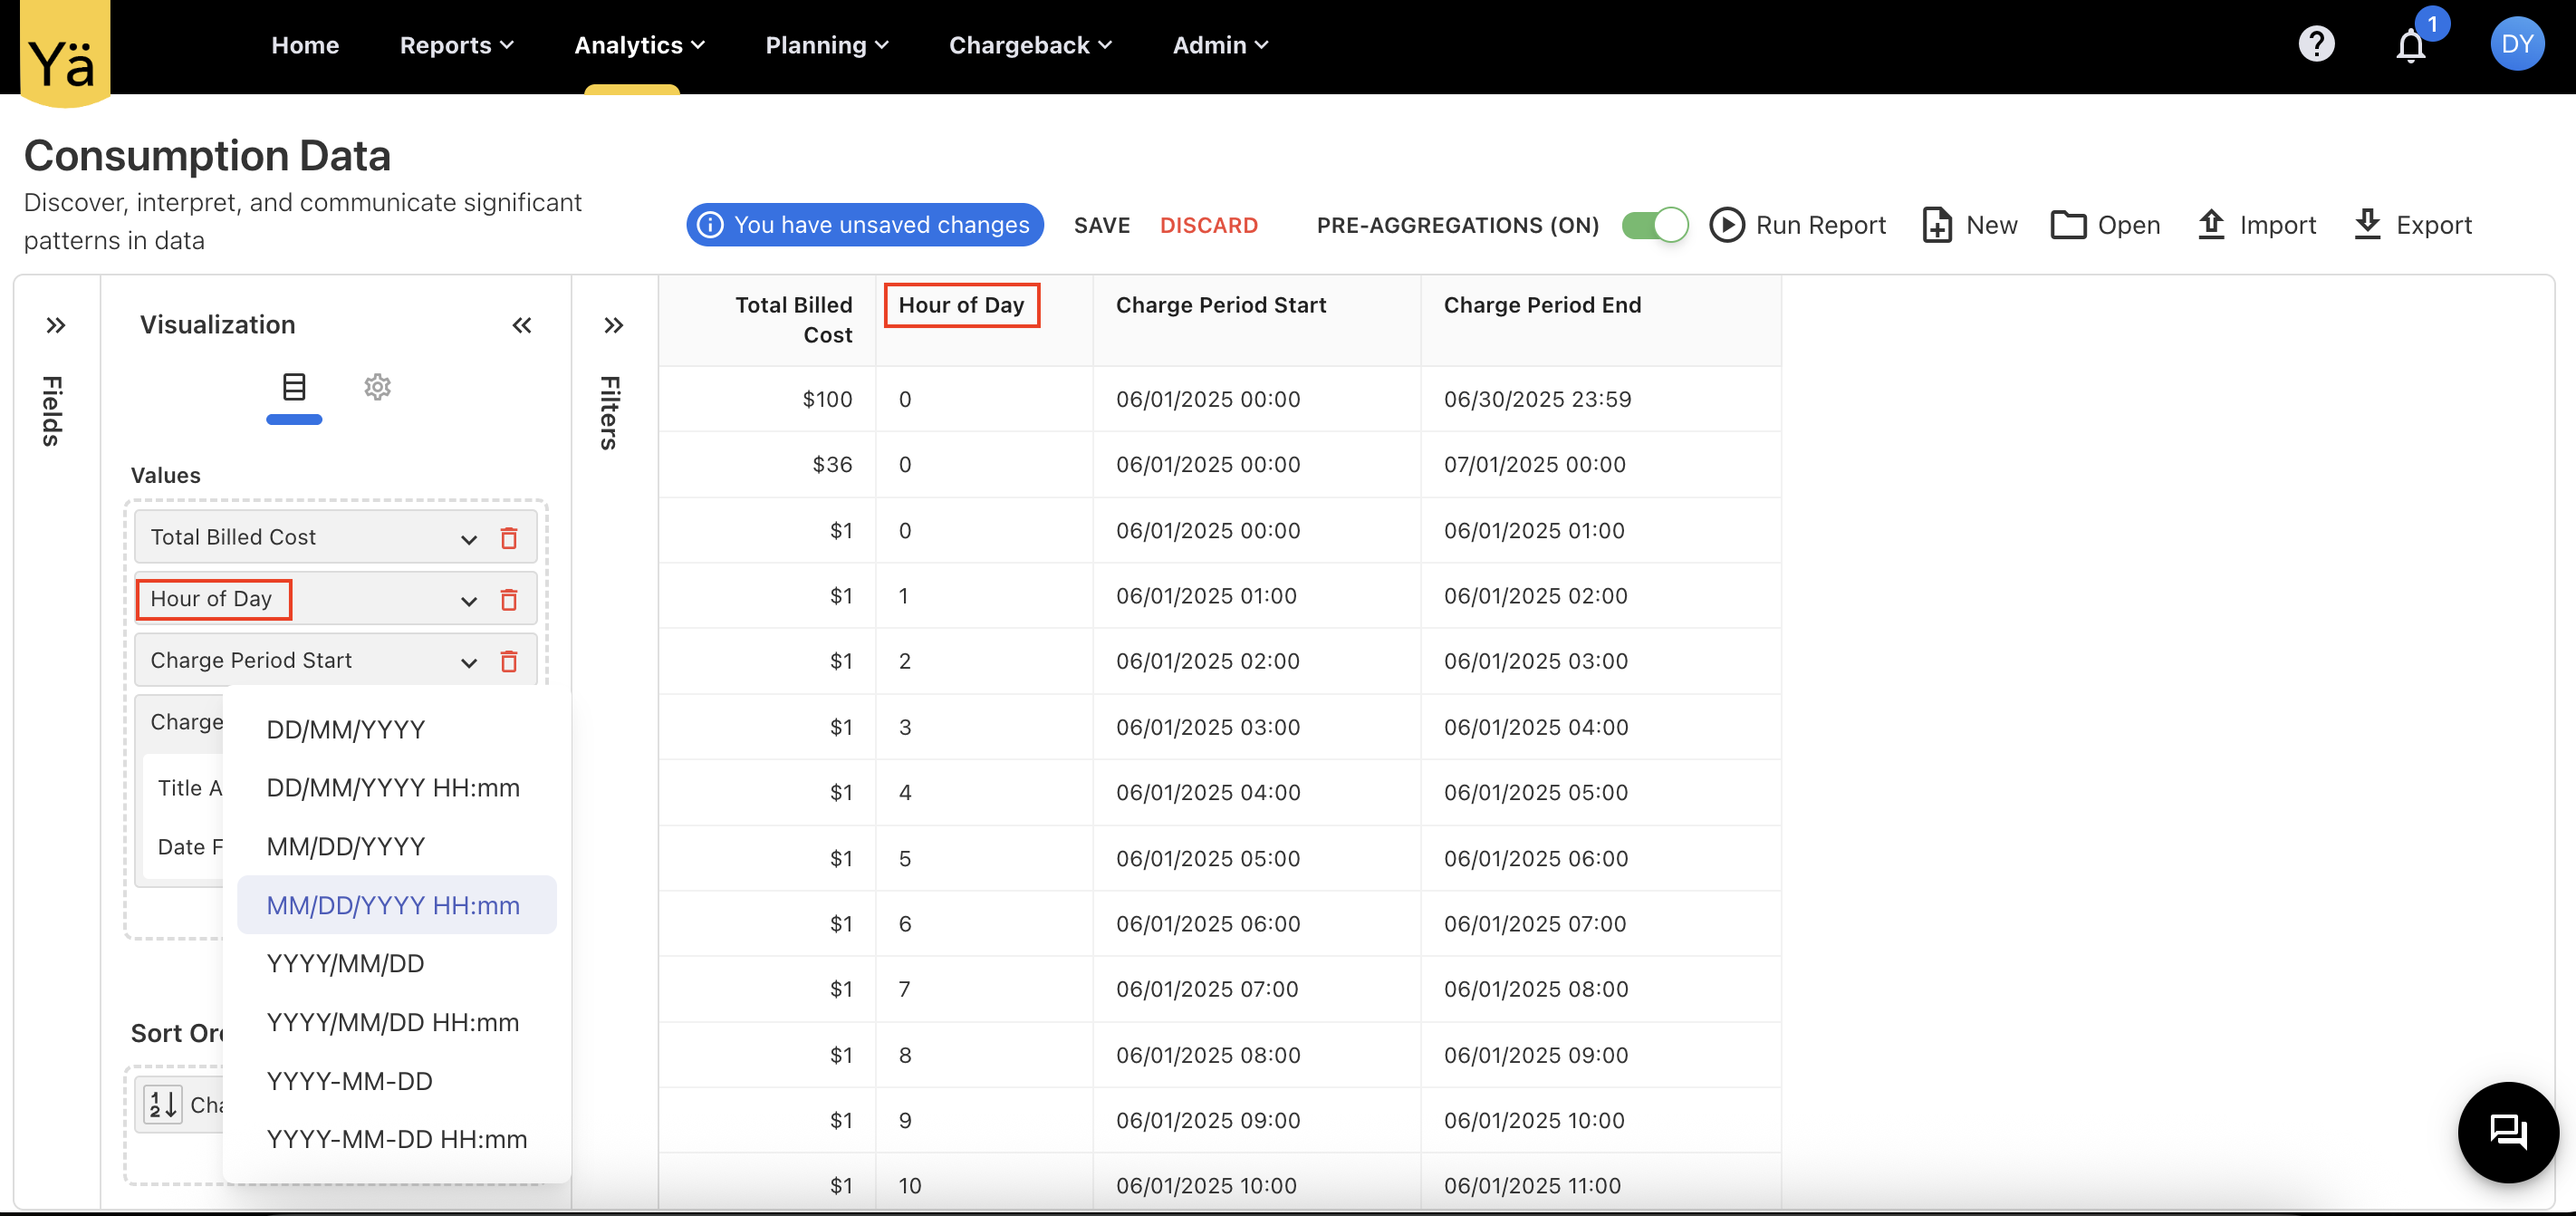
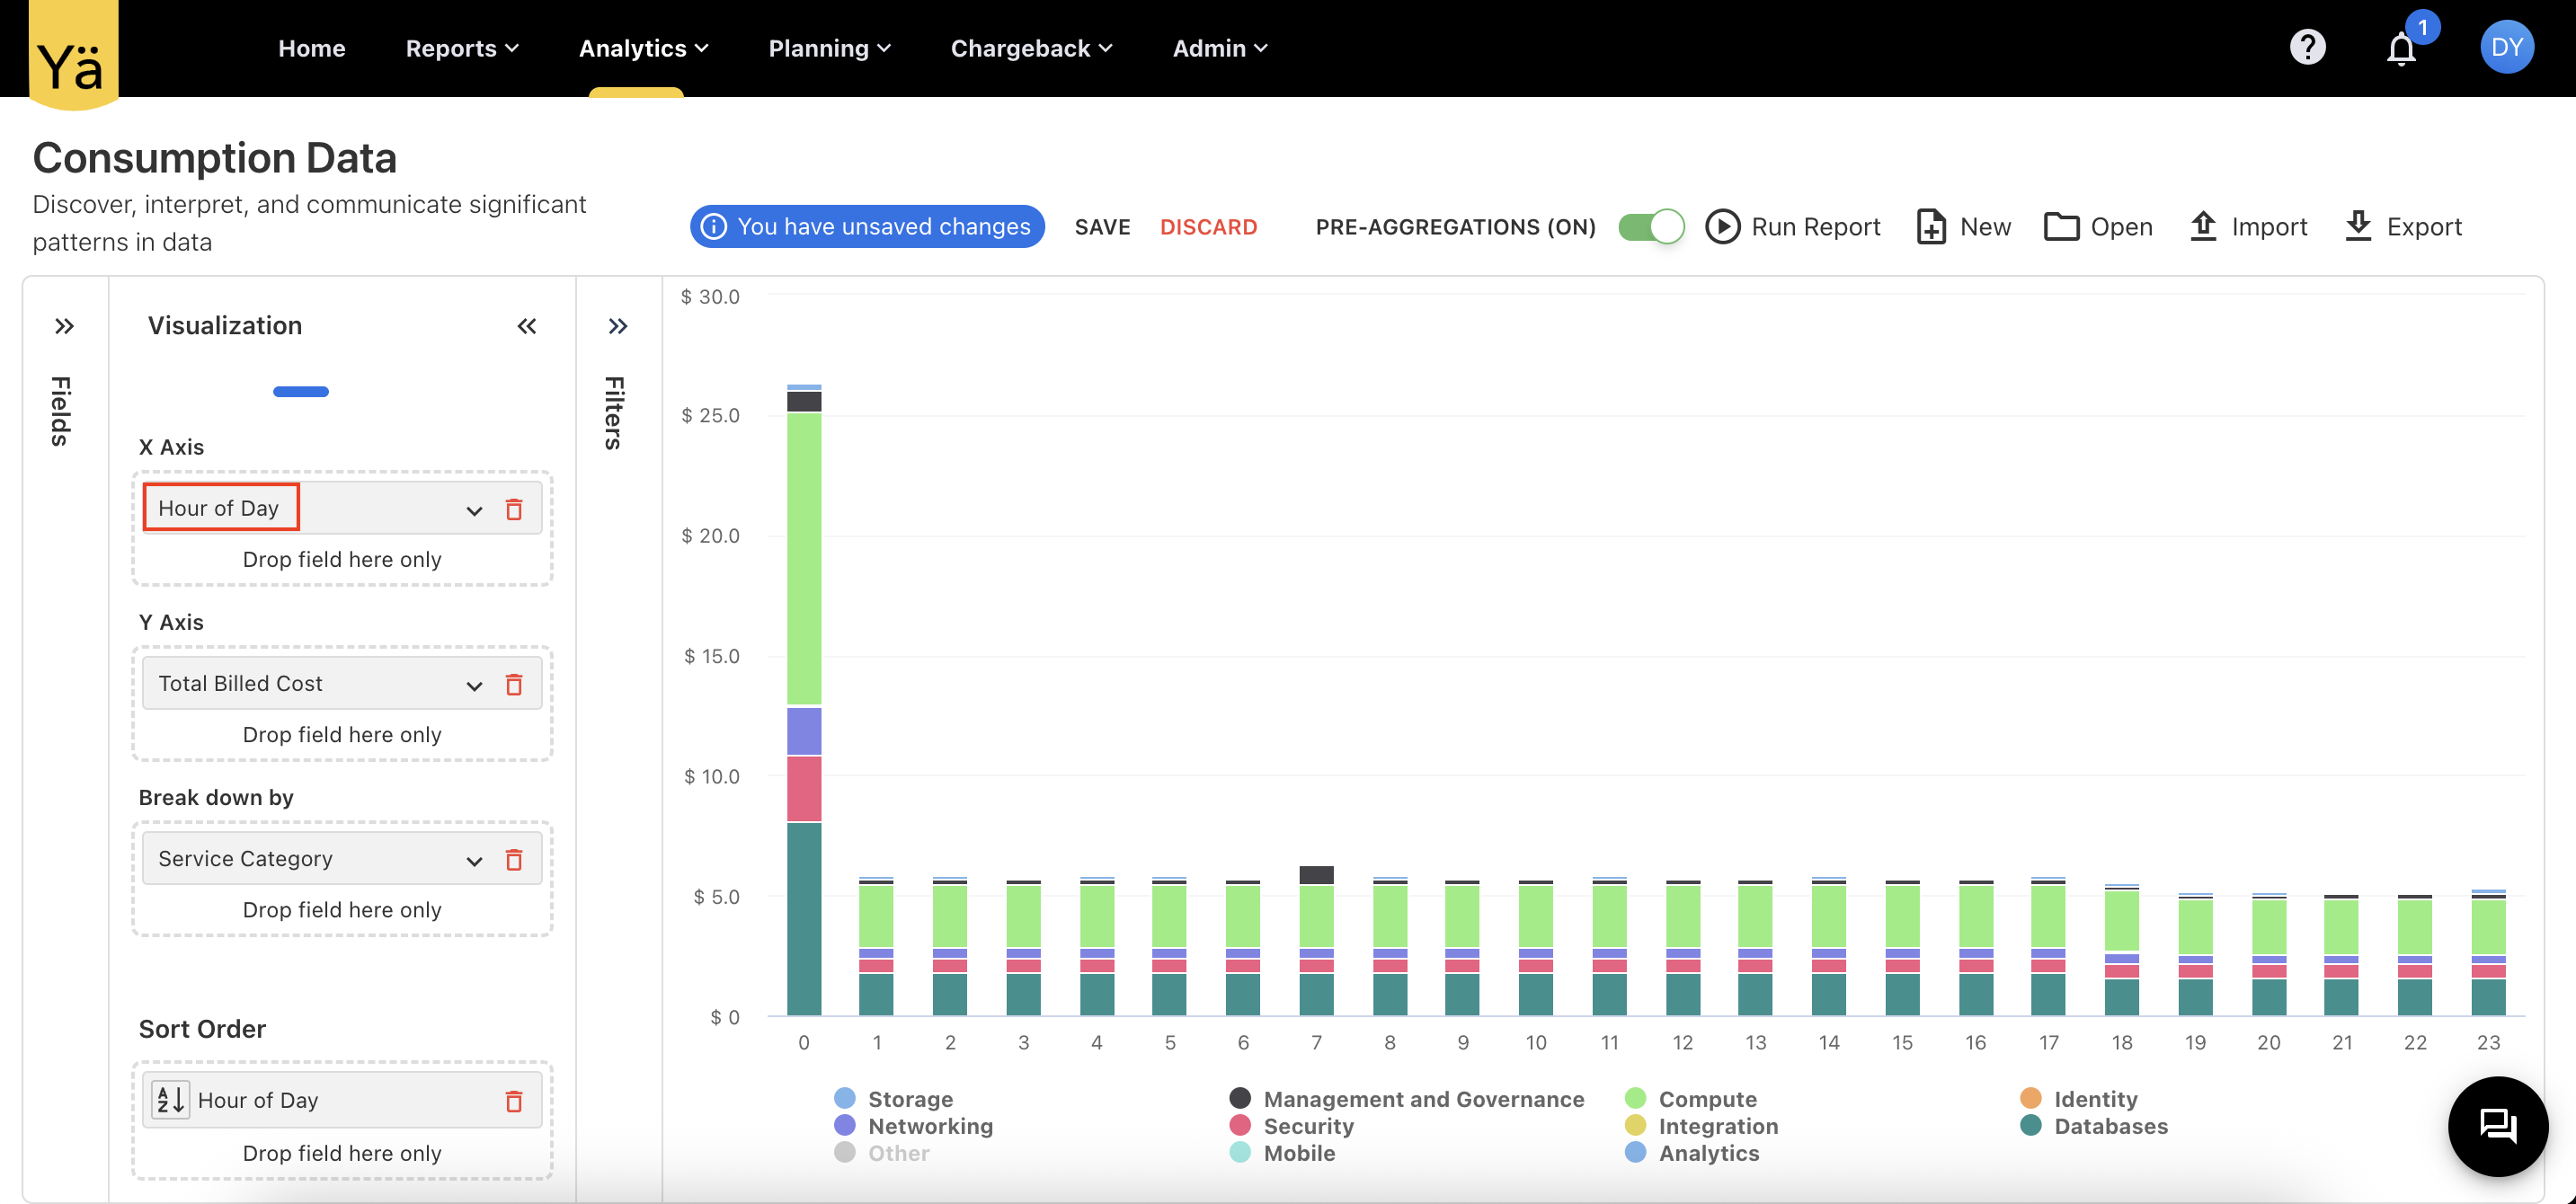
Hourly Cloud Consumption Analysis
In addition to daily cloud consumption analysis, we now support analyzing consumption on an hourly basis. A new field called Hour of Day has been added to the Cloud Consumption Analytics cube. This allows users to report and visualize consumption patterns on an hourly basis, providing additional insights into cloud usage behavior.
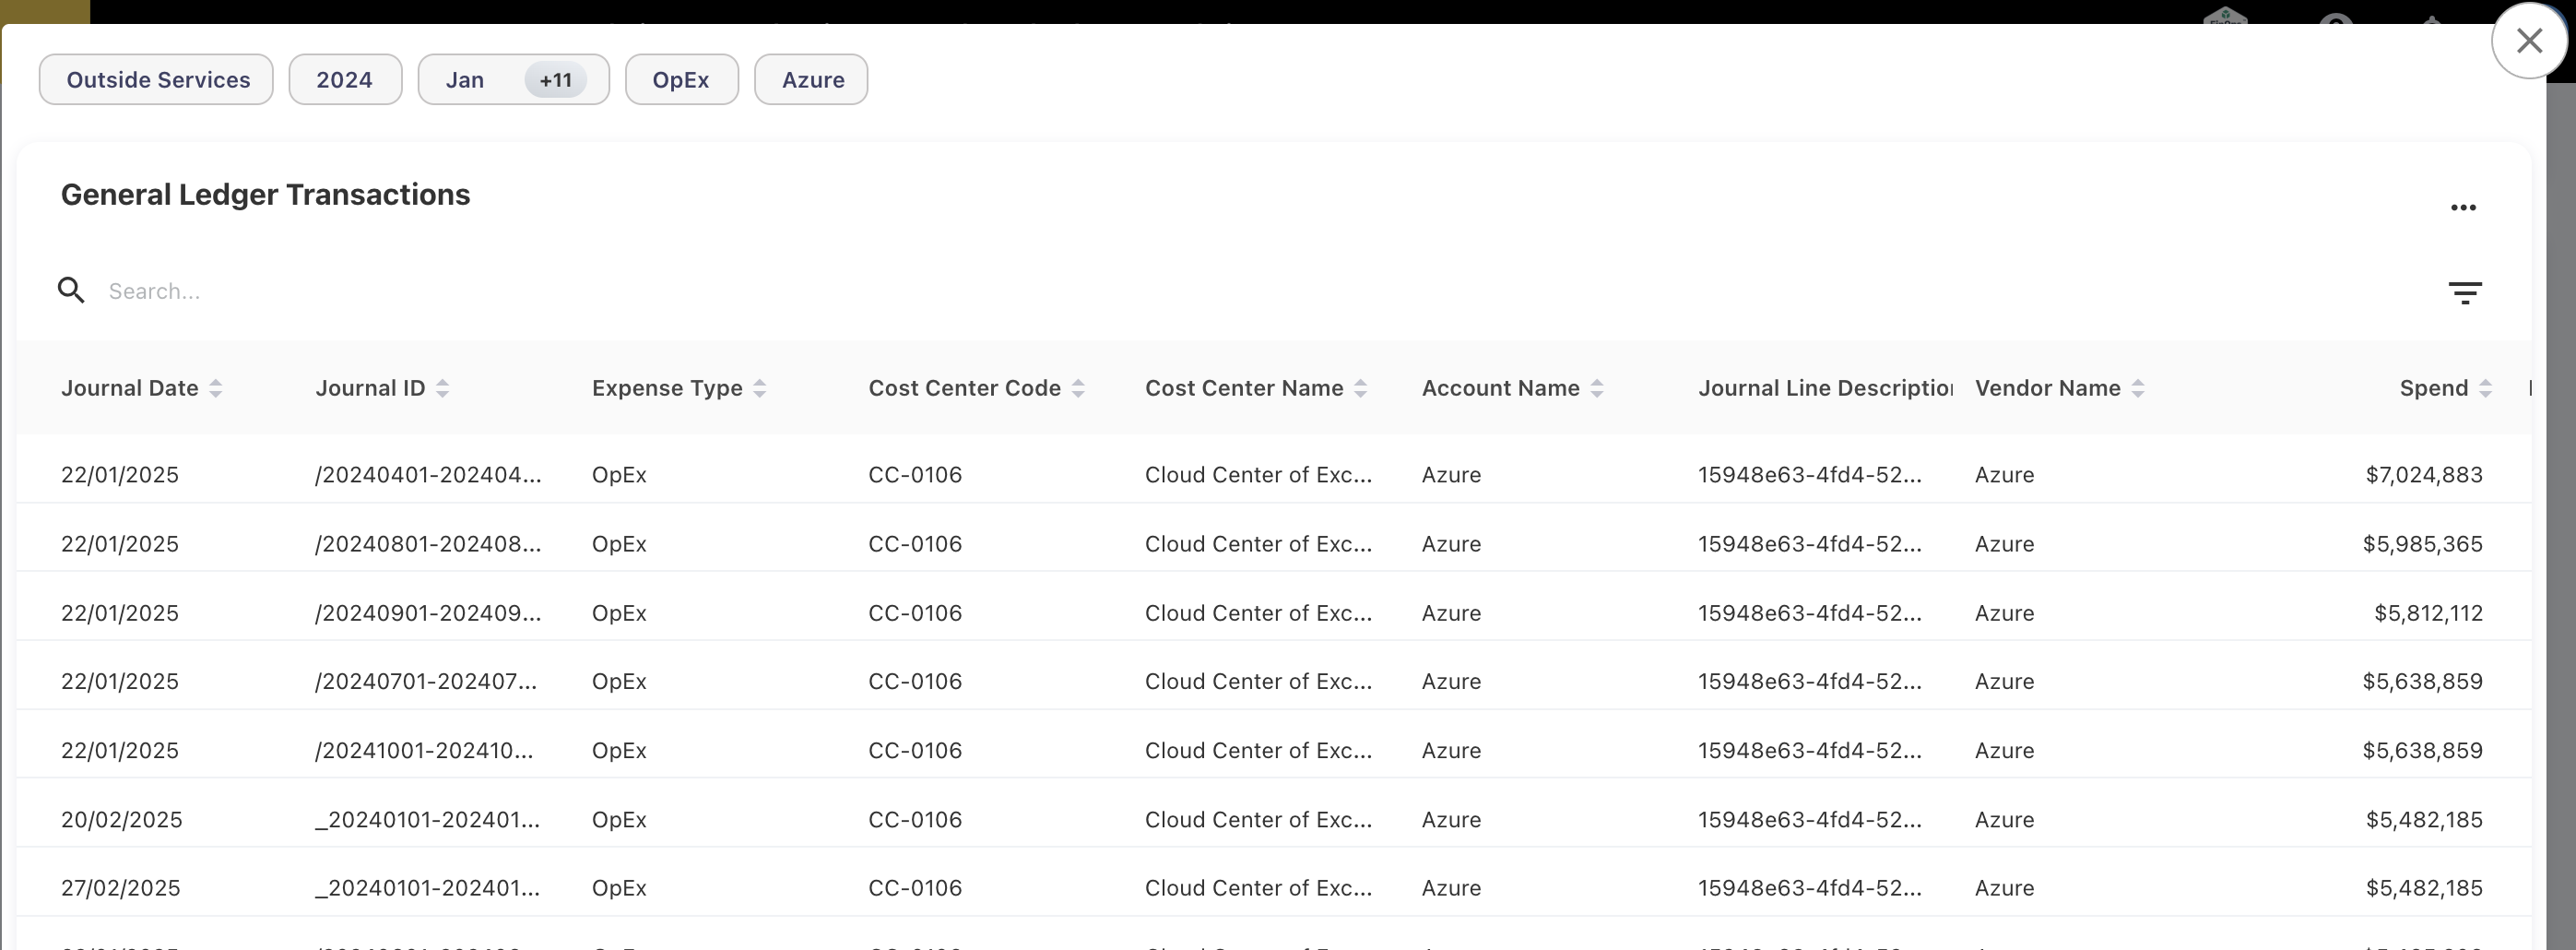
GL Popup Optimization
To load less data during pre-aggregation, the GL popups now display only the most essential fields by default. If users need more details, they can simply click on the View more icon to open a separate side panel with related details. For example, if an Invoice Number is visible in the GL popup, clicking on it will open related details like Purchase Order (PO) and Contract information in a separate, organized side panel. This enhancement speeds up the GL loading times and reduces on-screen clutter while still allowing access to detailed data when needed.
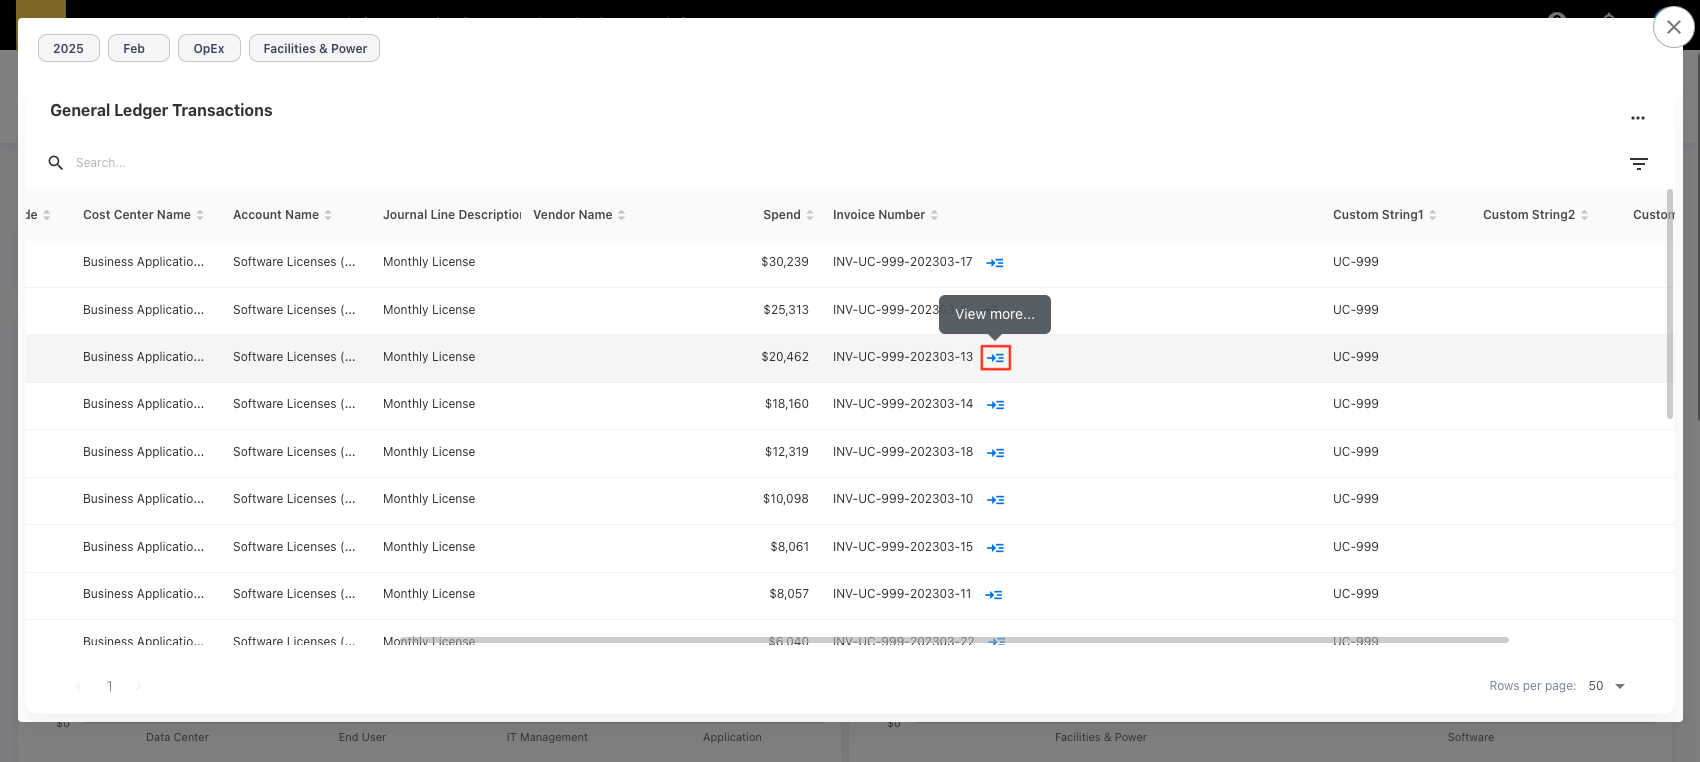
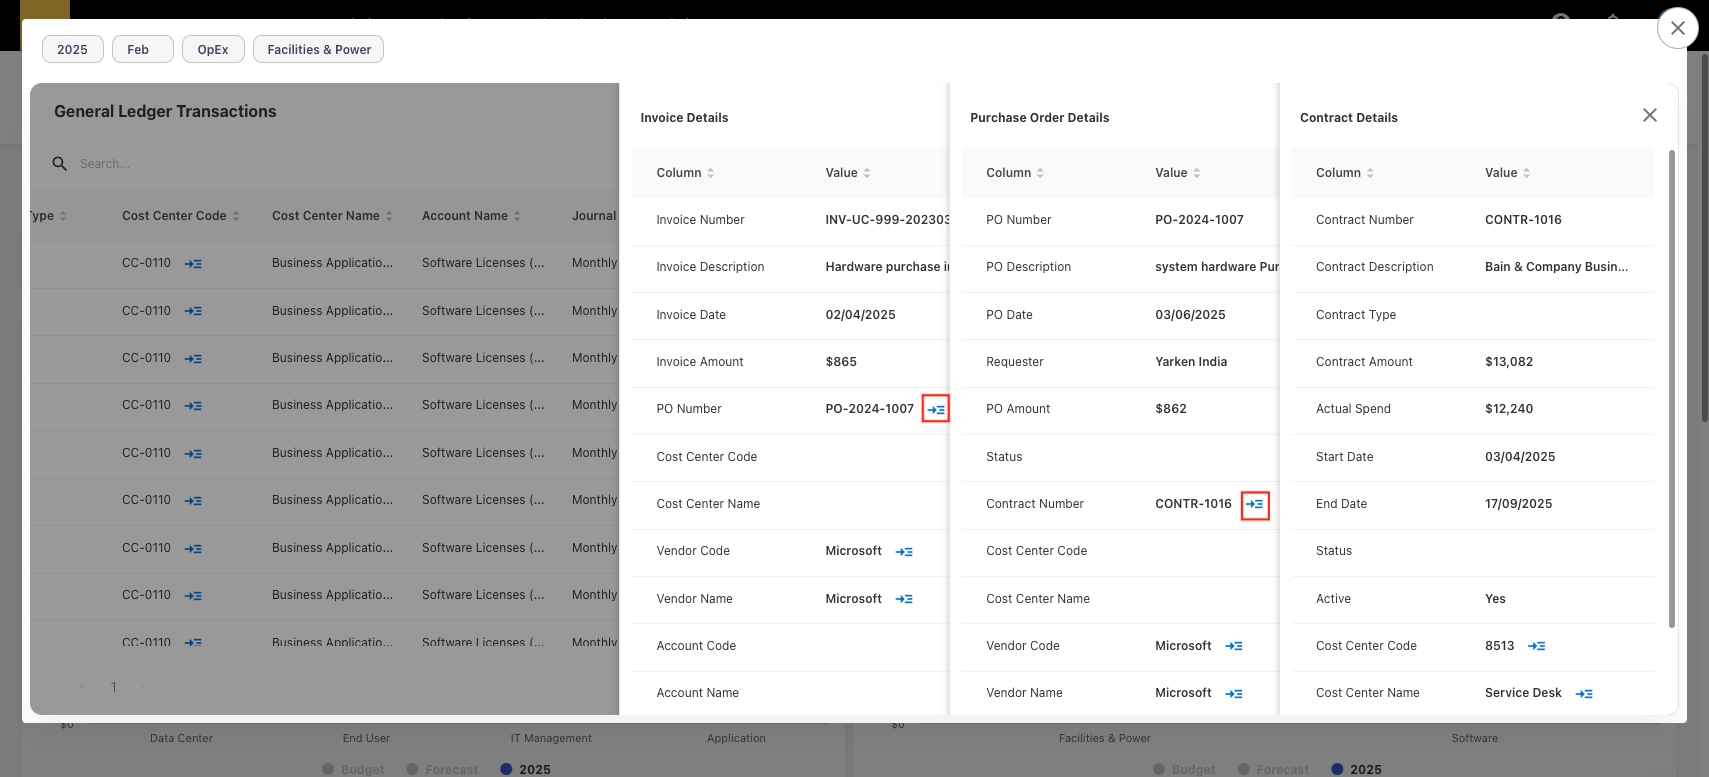
This capability is currently available for GL popups related to Vendor, Account, Cost Center, Invoice, Purchase Orders, Contracts only.
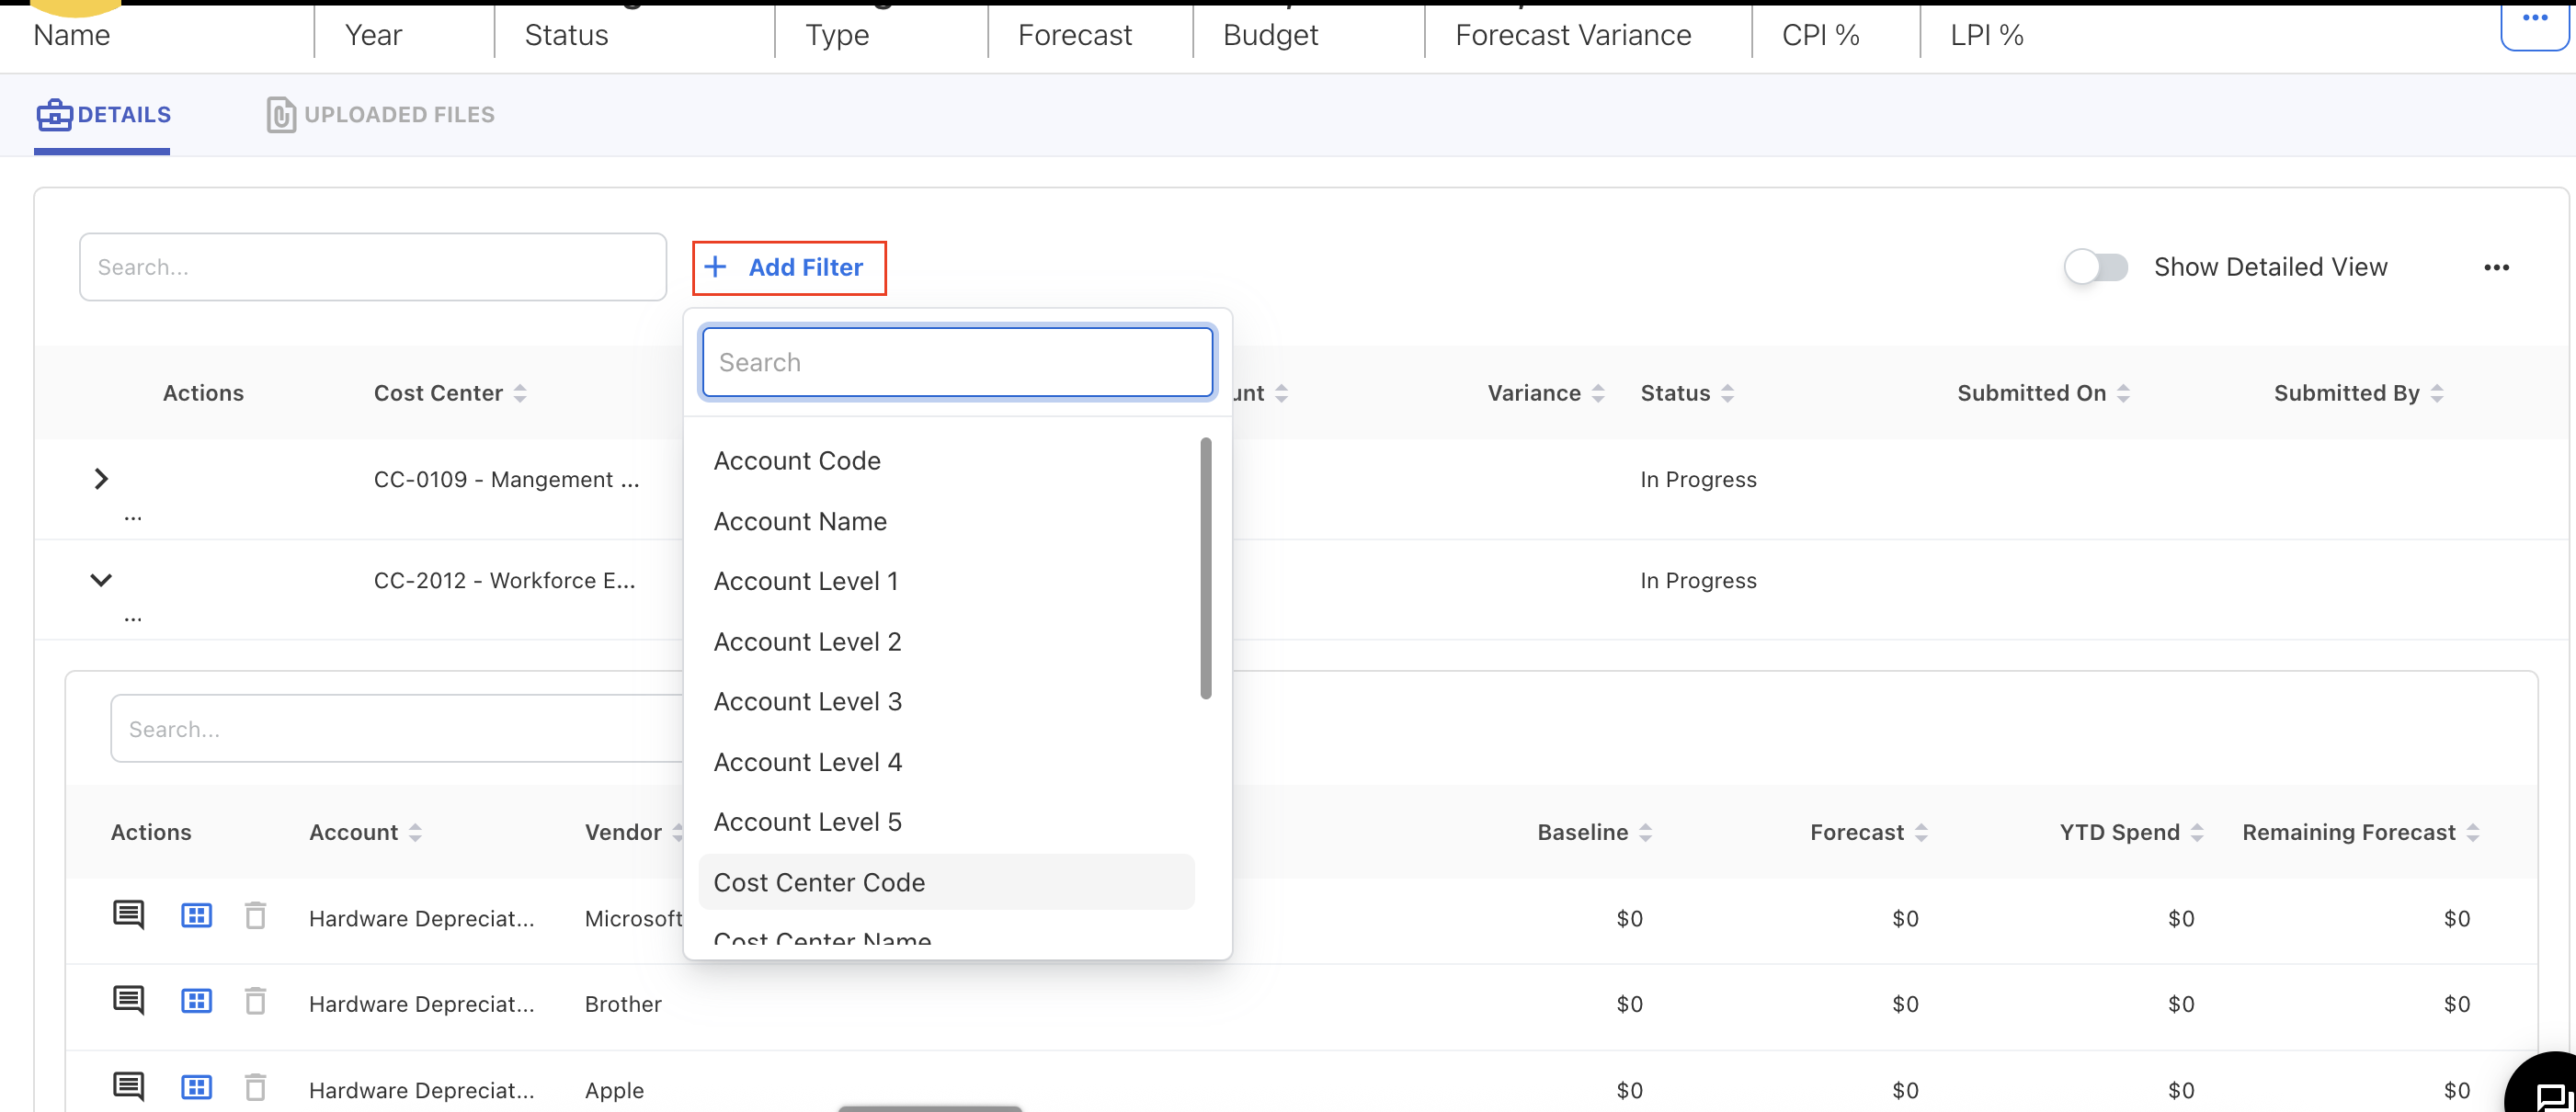
Global Filters for Forecast and Budget Planning Screens
The account and cost center filters—along with their hierarchies—are now available as global filters on the Forecast and Budget planning screens. These filters work similar to the existing year and month filters in standard dashboards and persist across different pages during the user session.
Dropdown Filters in Analytics
To improve filter performance and address filter result slowdowns caused by large datasets, dropdown filters in both Analytics and admin screens have been optimized. These filters now load data in batches, retrieving approximately 50 items at a time, with additional values accessible via the Show more option. This ensures a faster loading time when working with filters that contain thousands of values.
-20250626-072044.png?cb=c682b92239a5c13e742cc3e3beb65fe5)
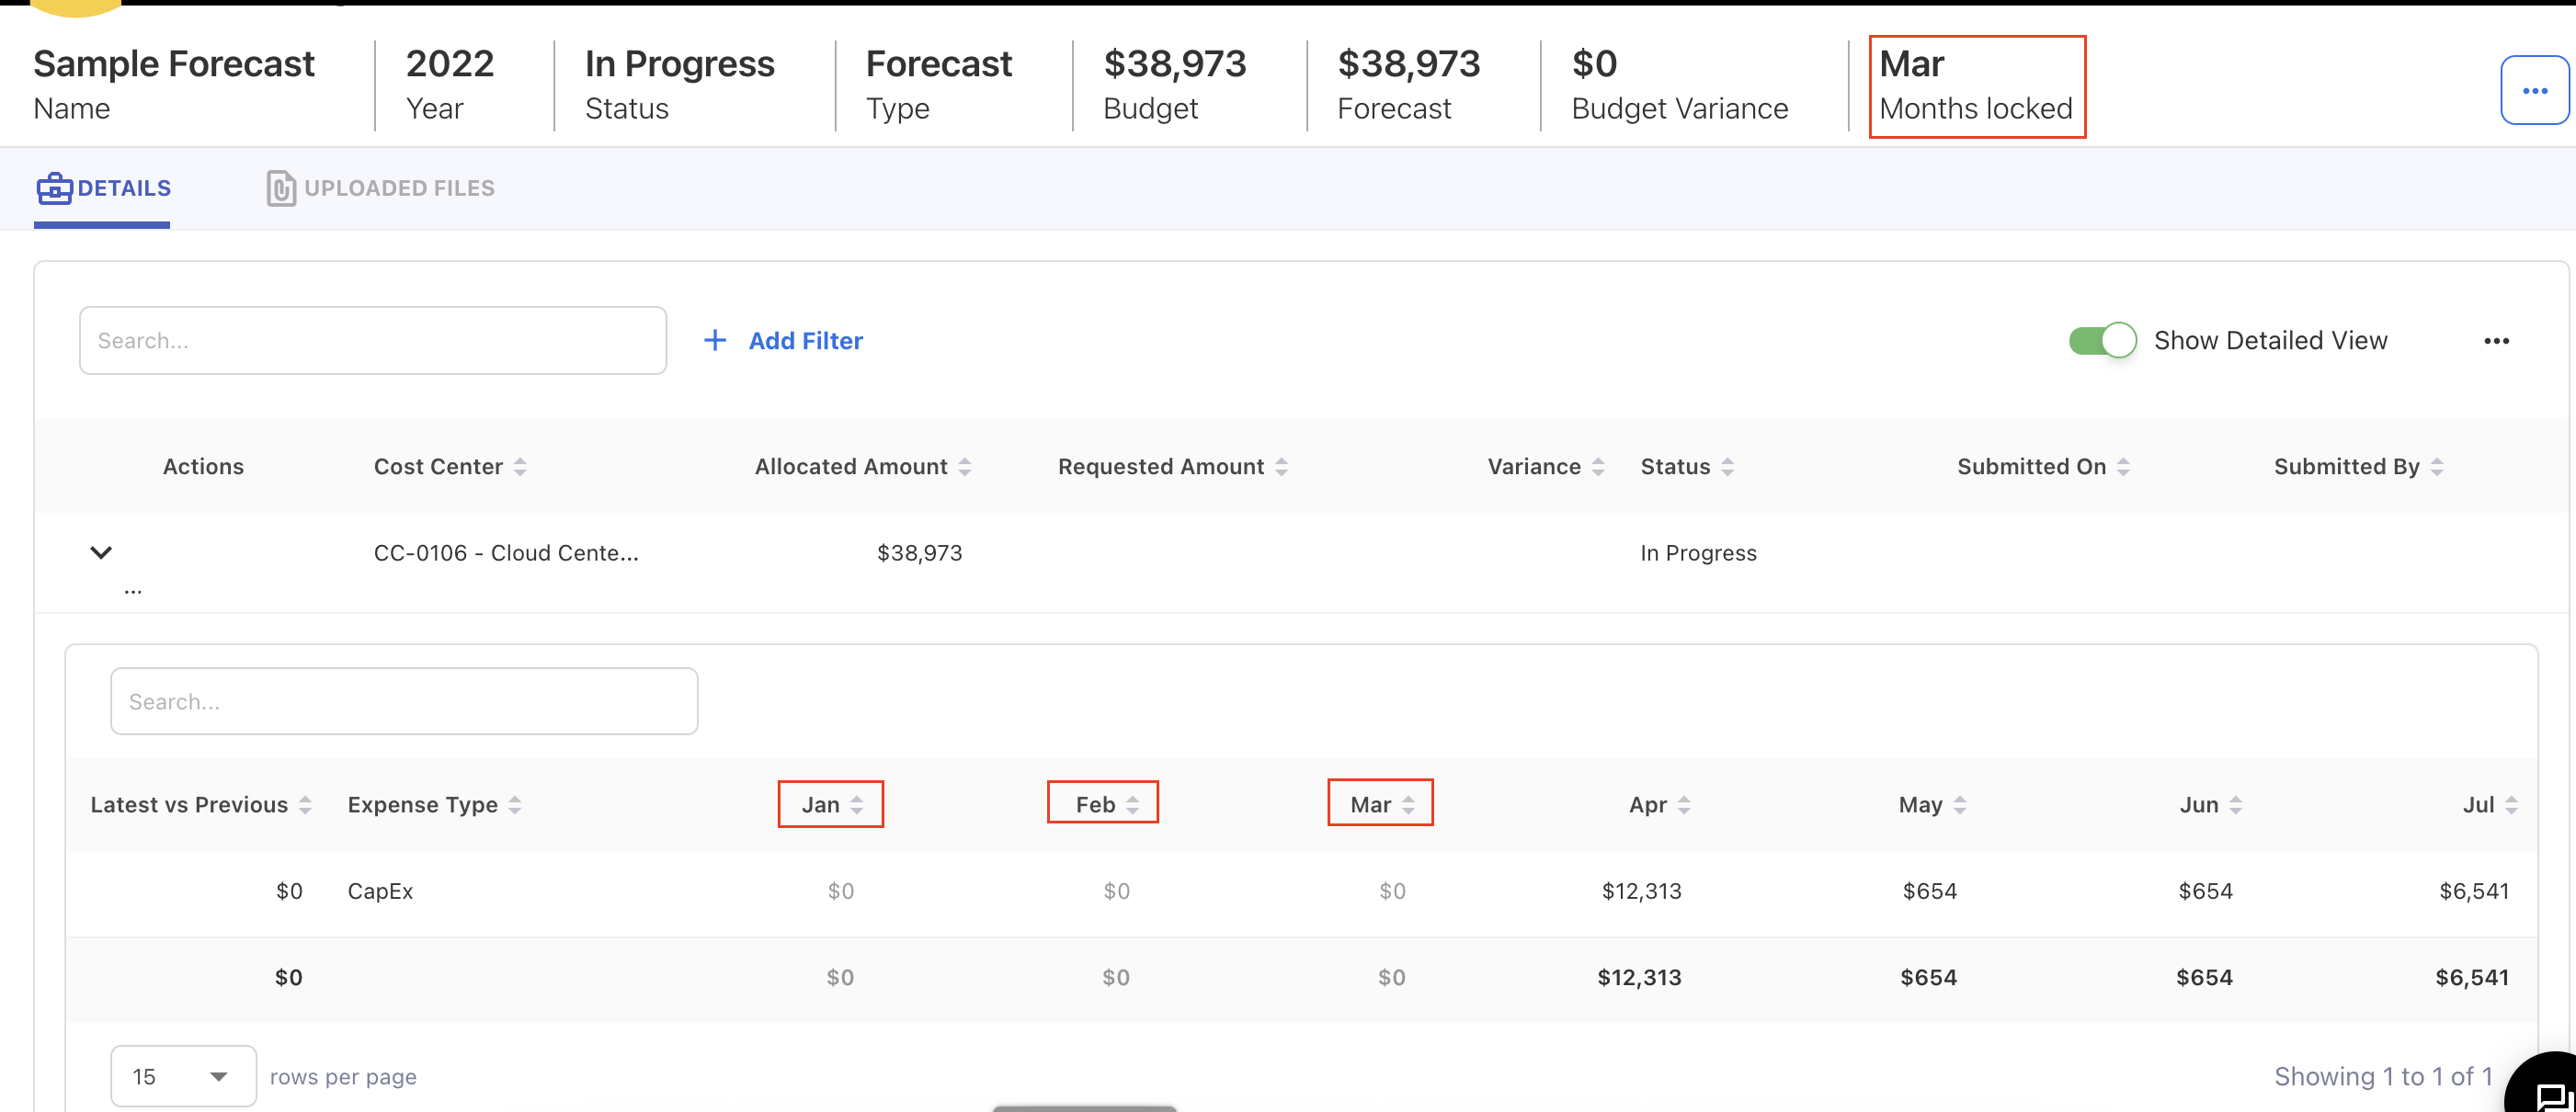
Locked Months in Forecasting
In the Planning module, months that are locked during forecast creation are now visually greyed out in the detailed view, indicating that these periods are non-editable.
Jun 16, 2025
Bug fixes and enhancements
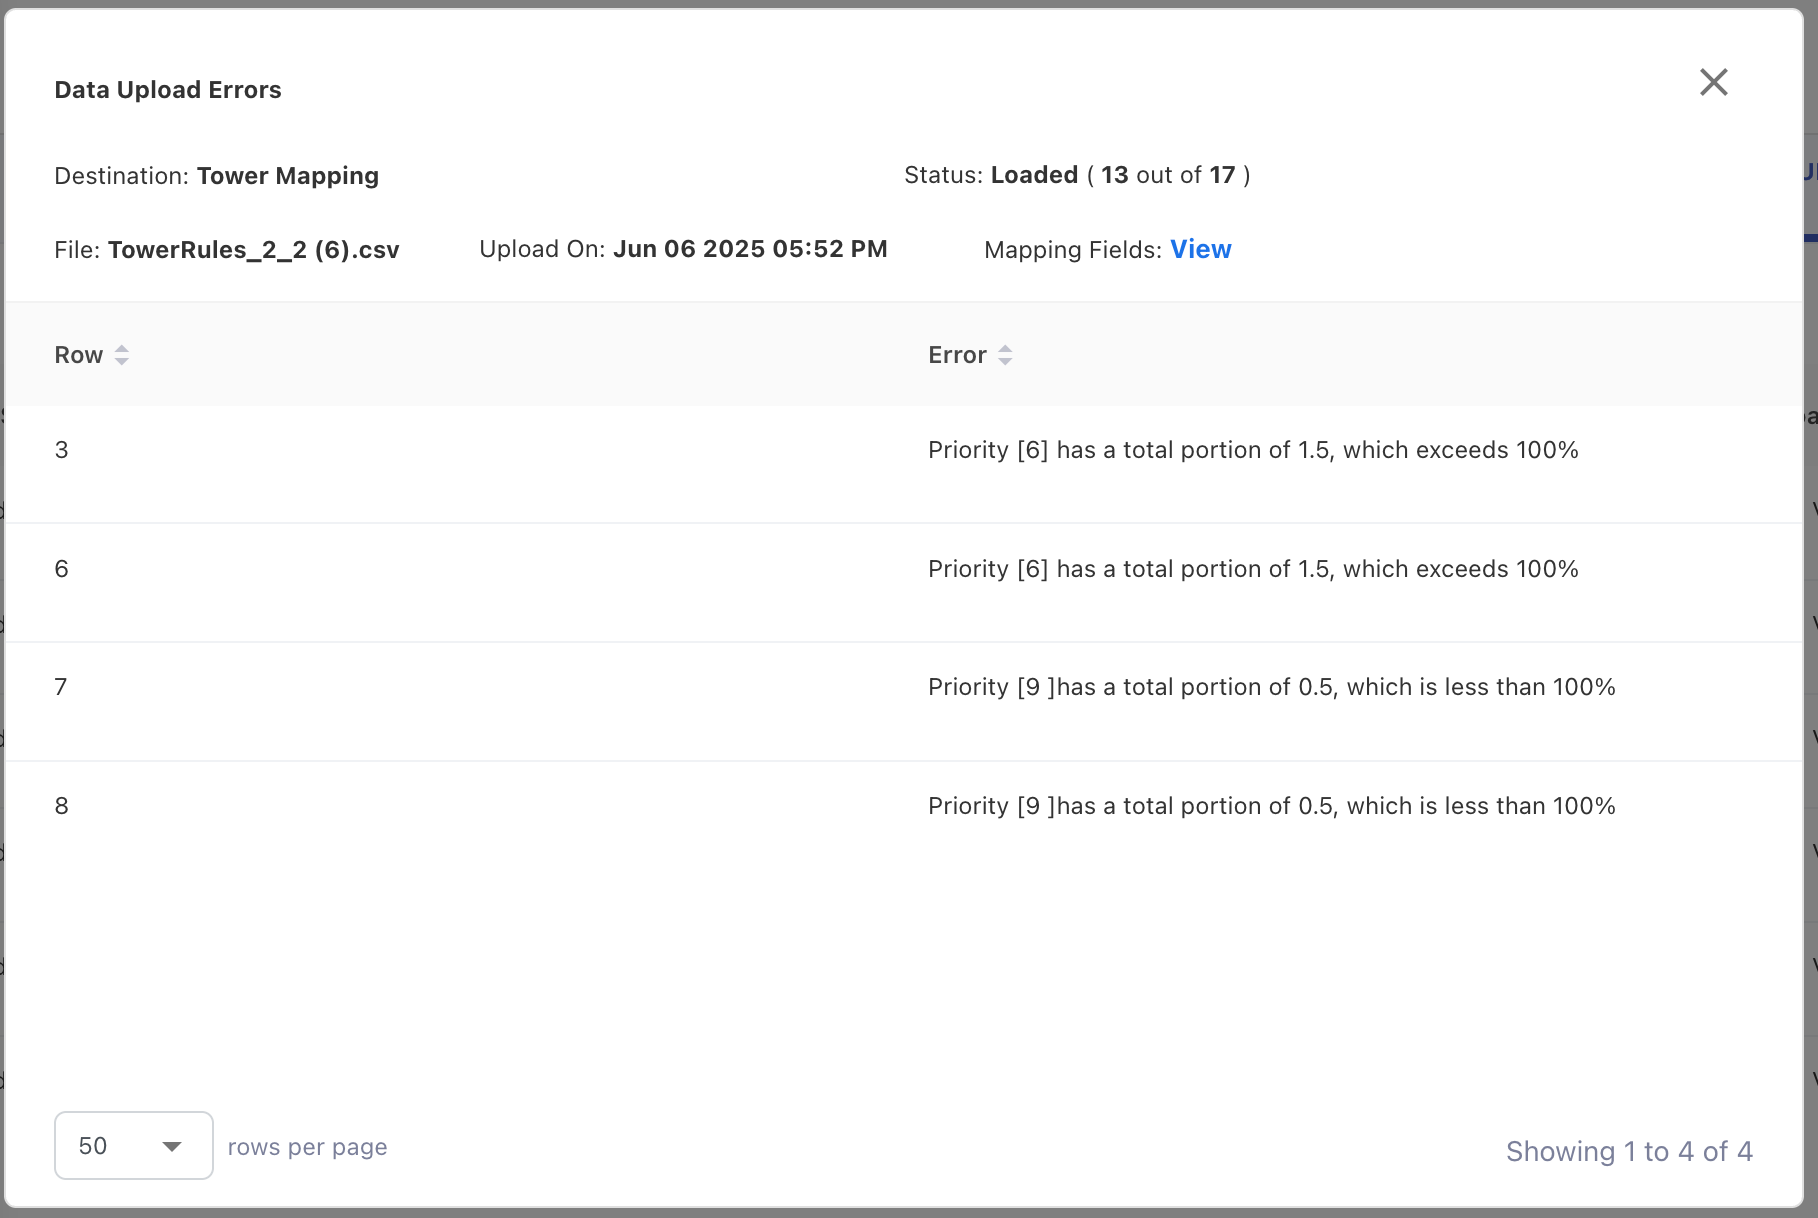
Validation for Duplicate Priority
To resolve the issue in the tower rules that have the same priority, a new validation check is added to prevent over or under allocation while uploading rules. If the uploaded file contains entries that have the same priority and their sum portions do not add up to 100%, those entries will be rejected with a clear error message.
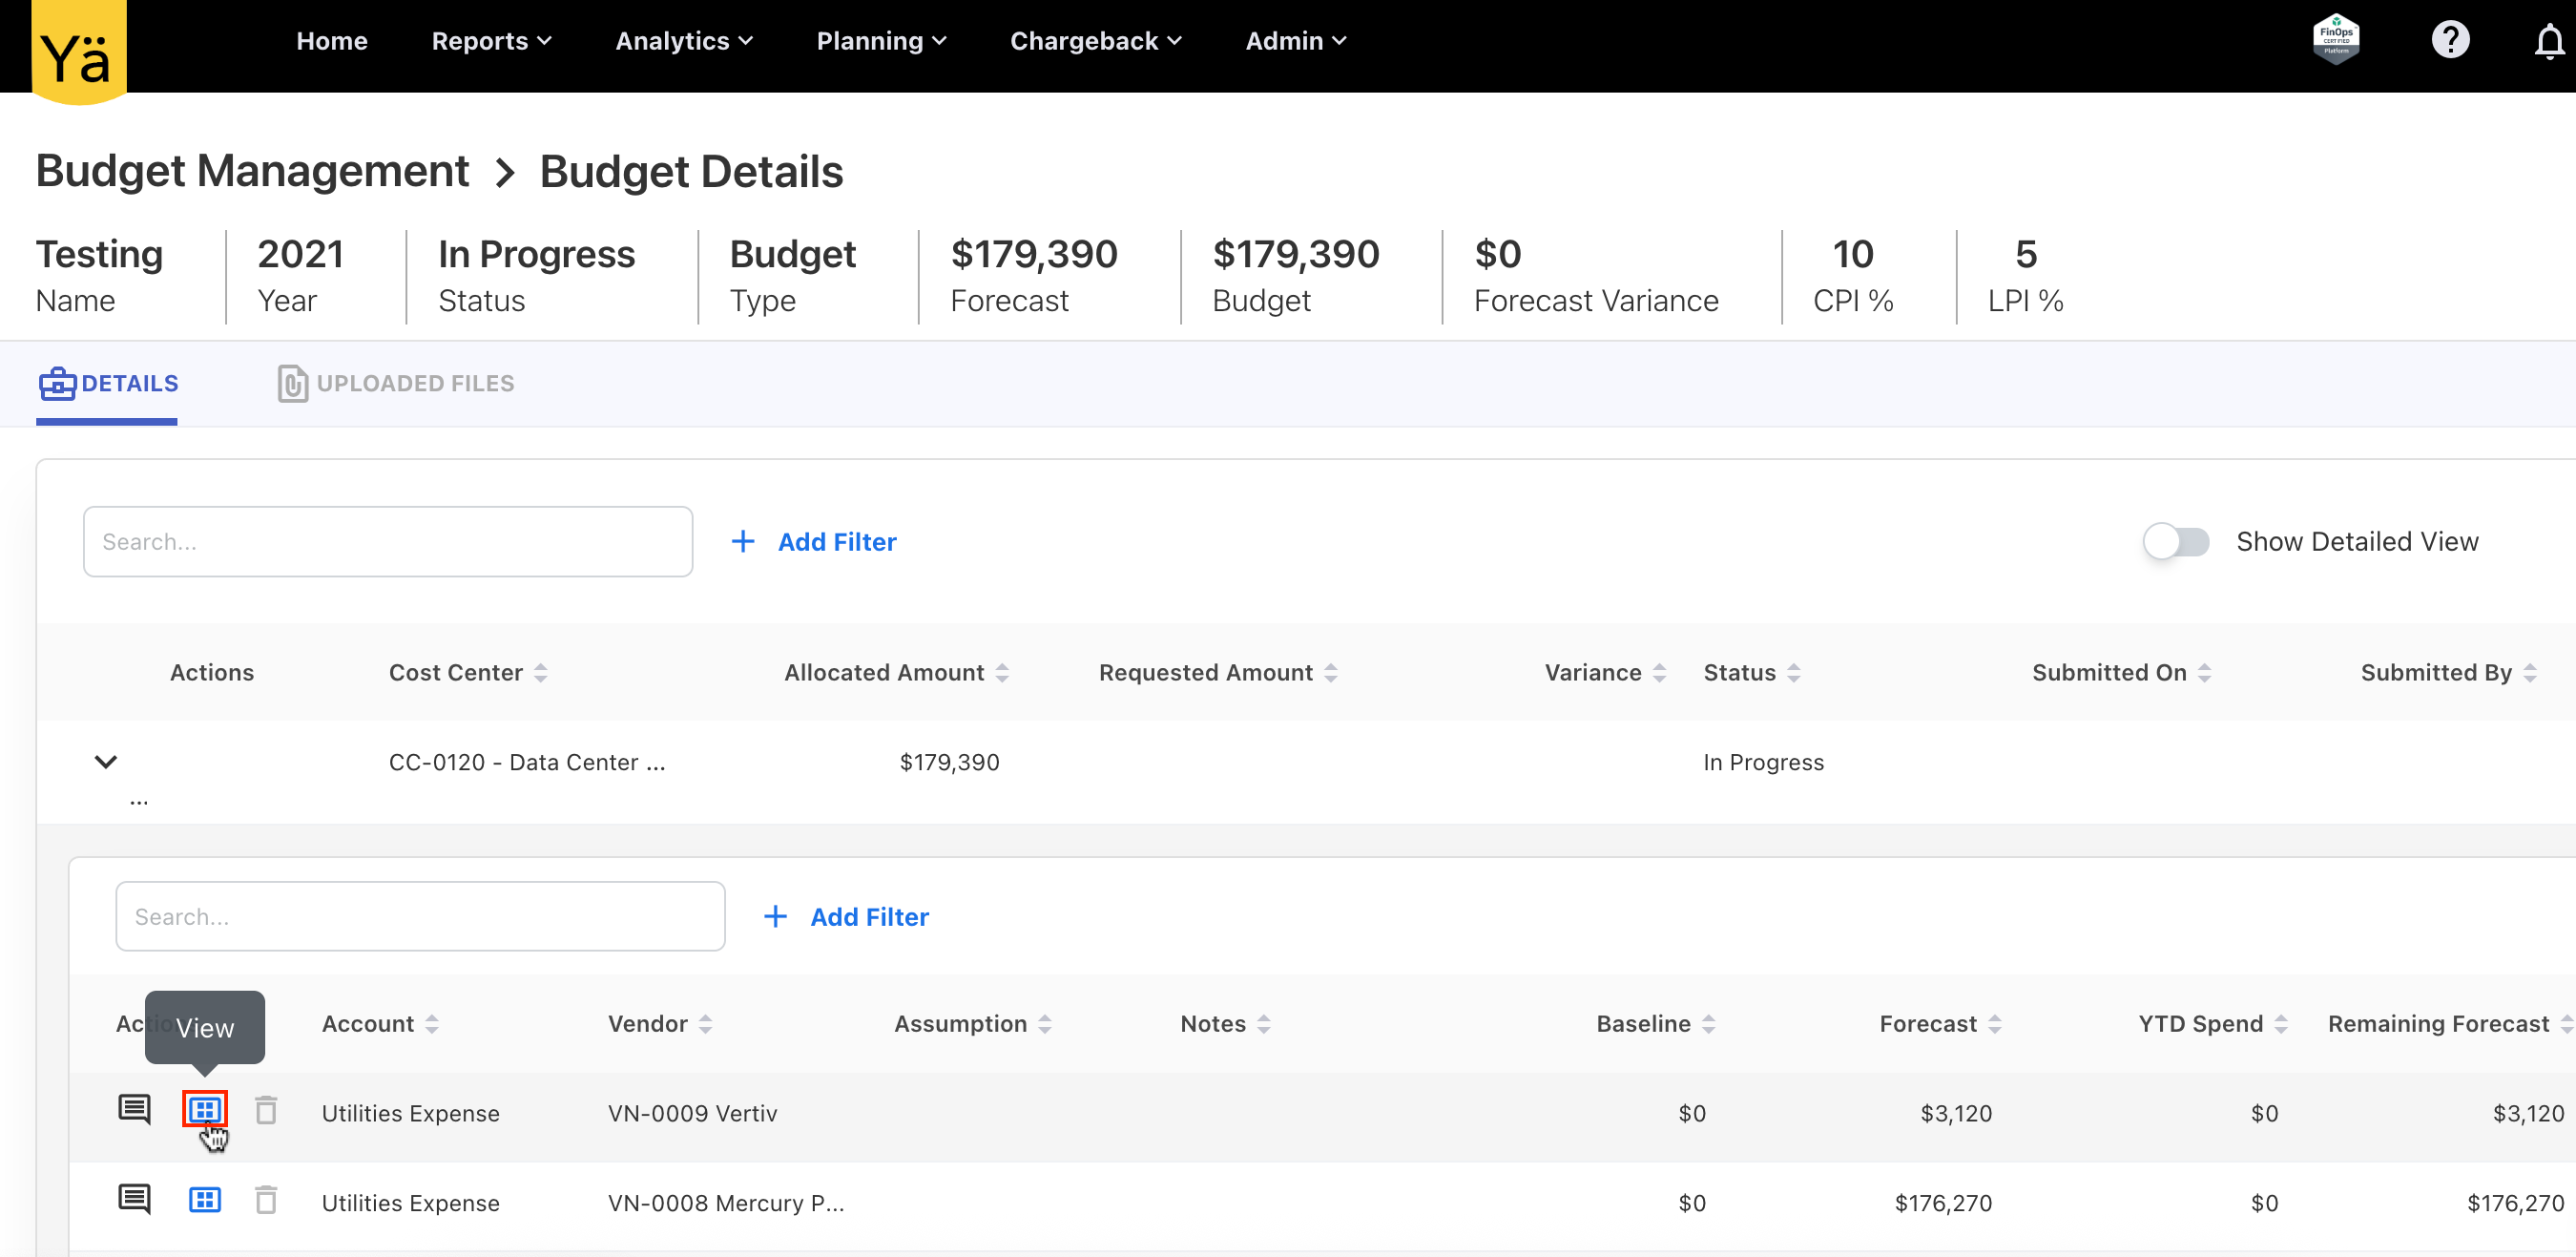
View Button for Non-Draft Budgets
The View button is enabled in the Budget Details page for budgets that are In Progress, Completed, Cancelled, or Approved status. When viewed, all budget line items are greyed out and non-editable to prevent any modifications. For budgets in Draft status, the Edit button remains unchanged, and full editing is allowed.
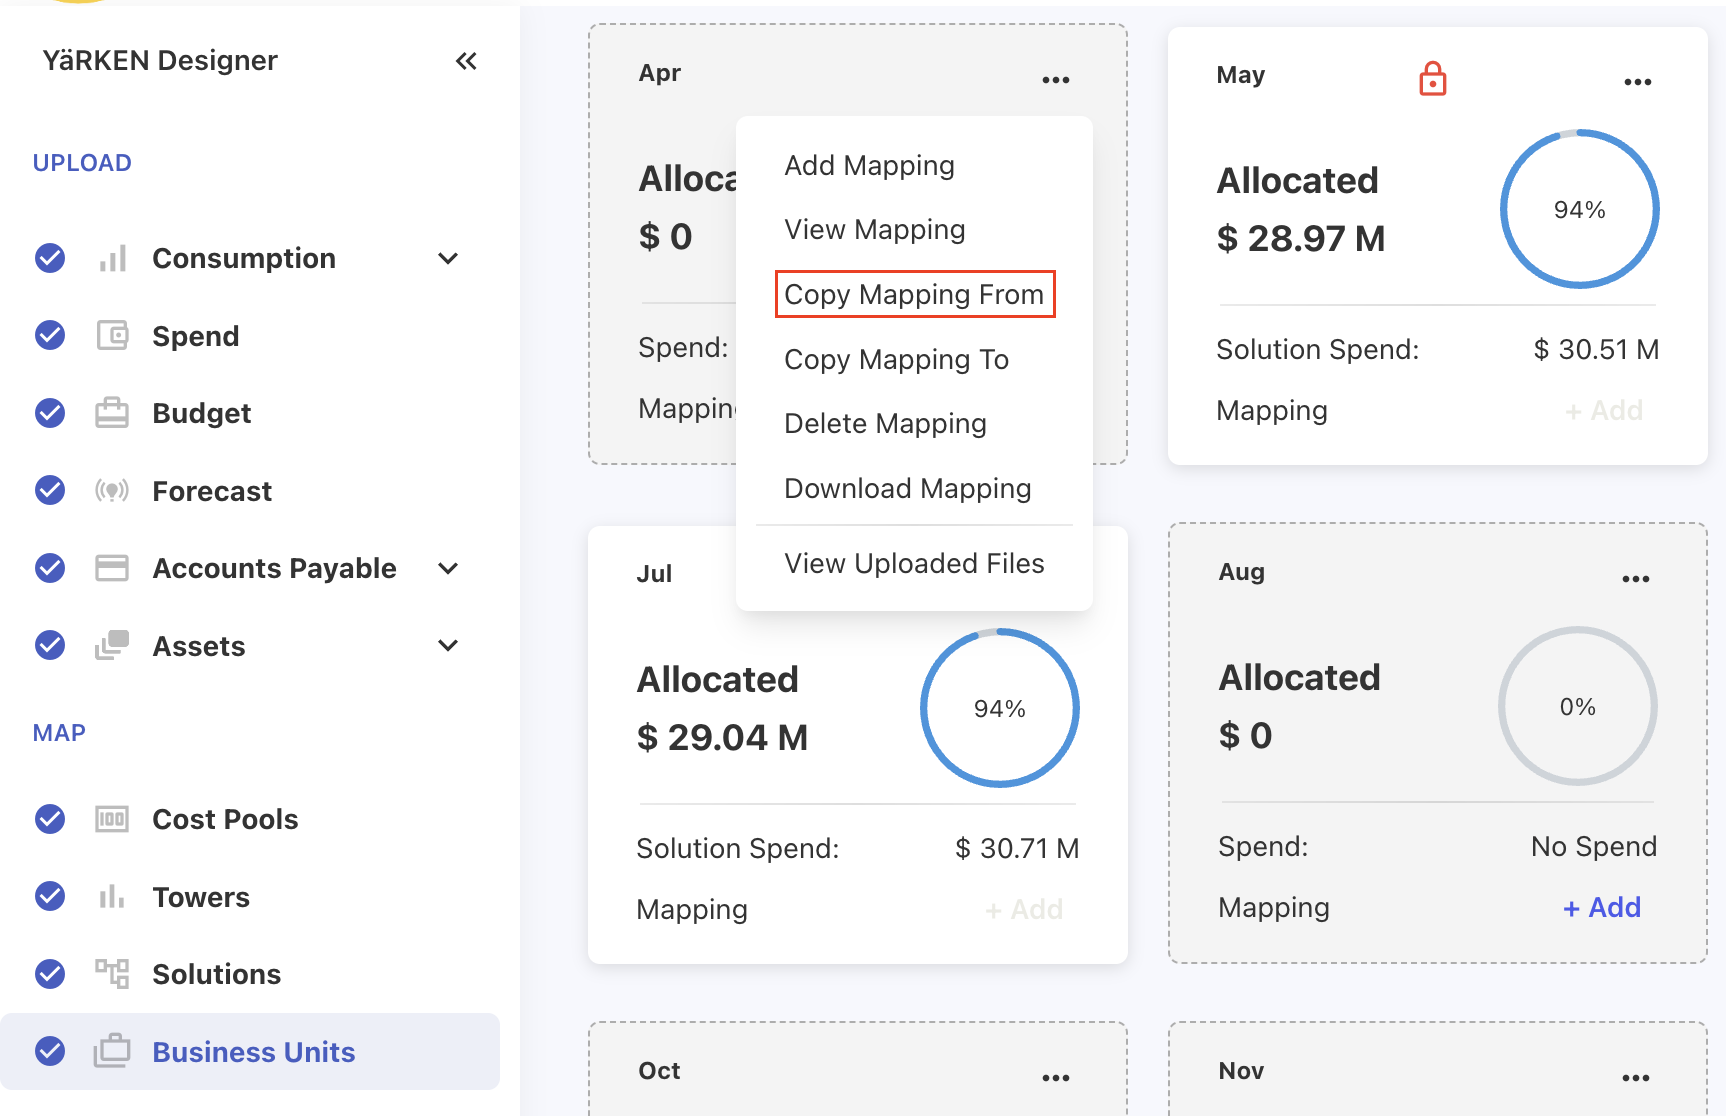
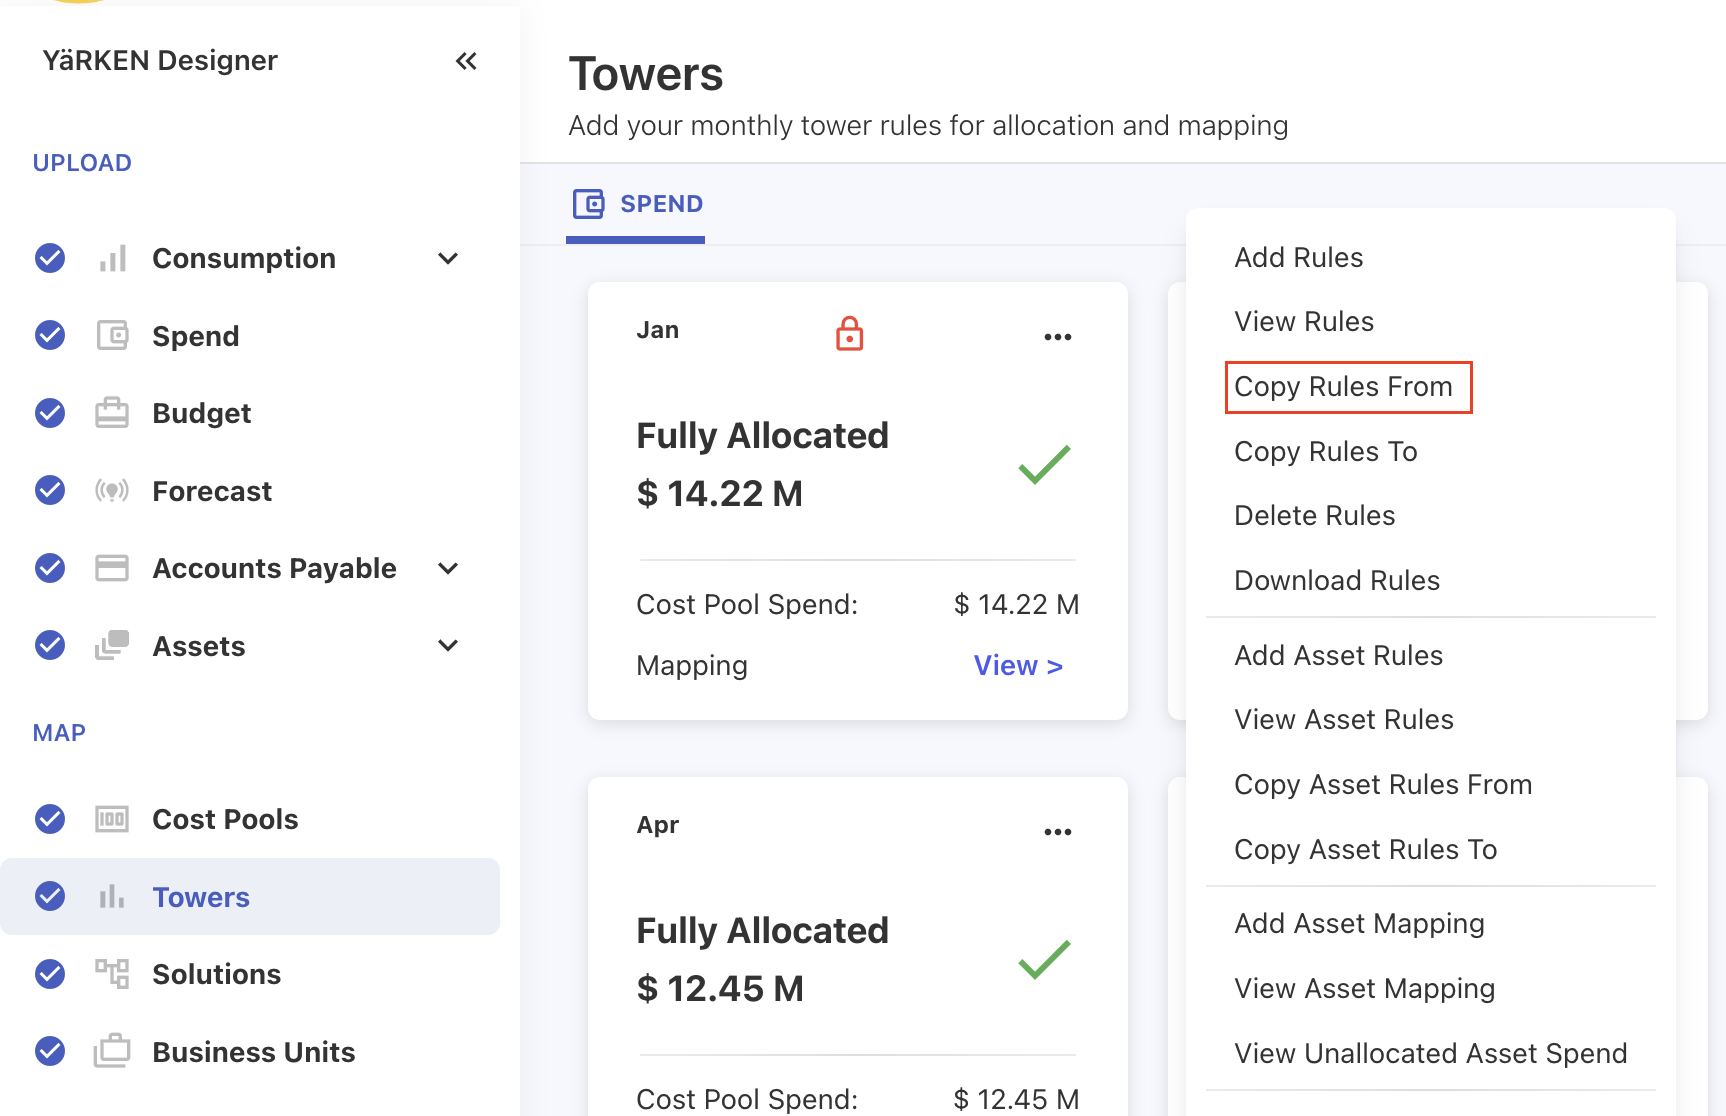
Copy From Option
The Copy From functionality for mapping and rules is now enabled directly within the sub-menus of Cost Pools, Towers, Solutions, and Business Units.
Jun 02, 2025
Bug fixes and enhancements
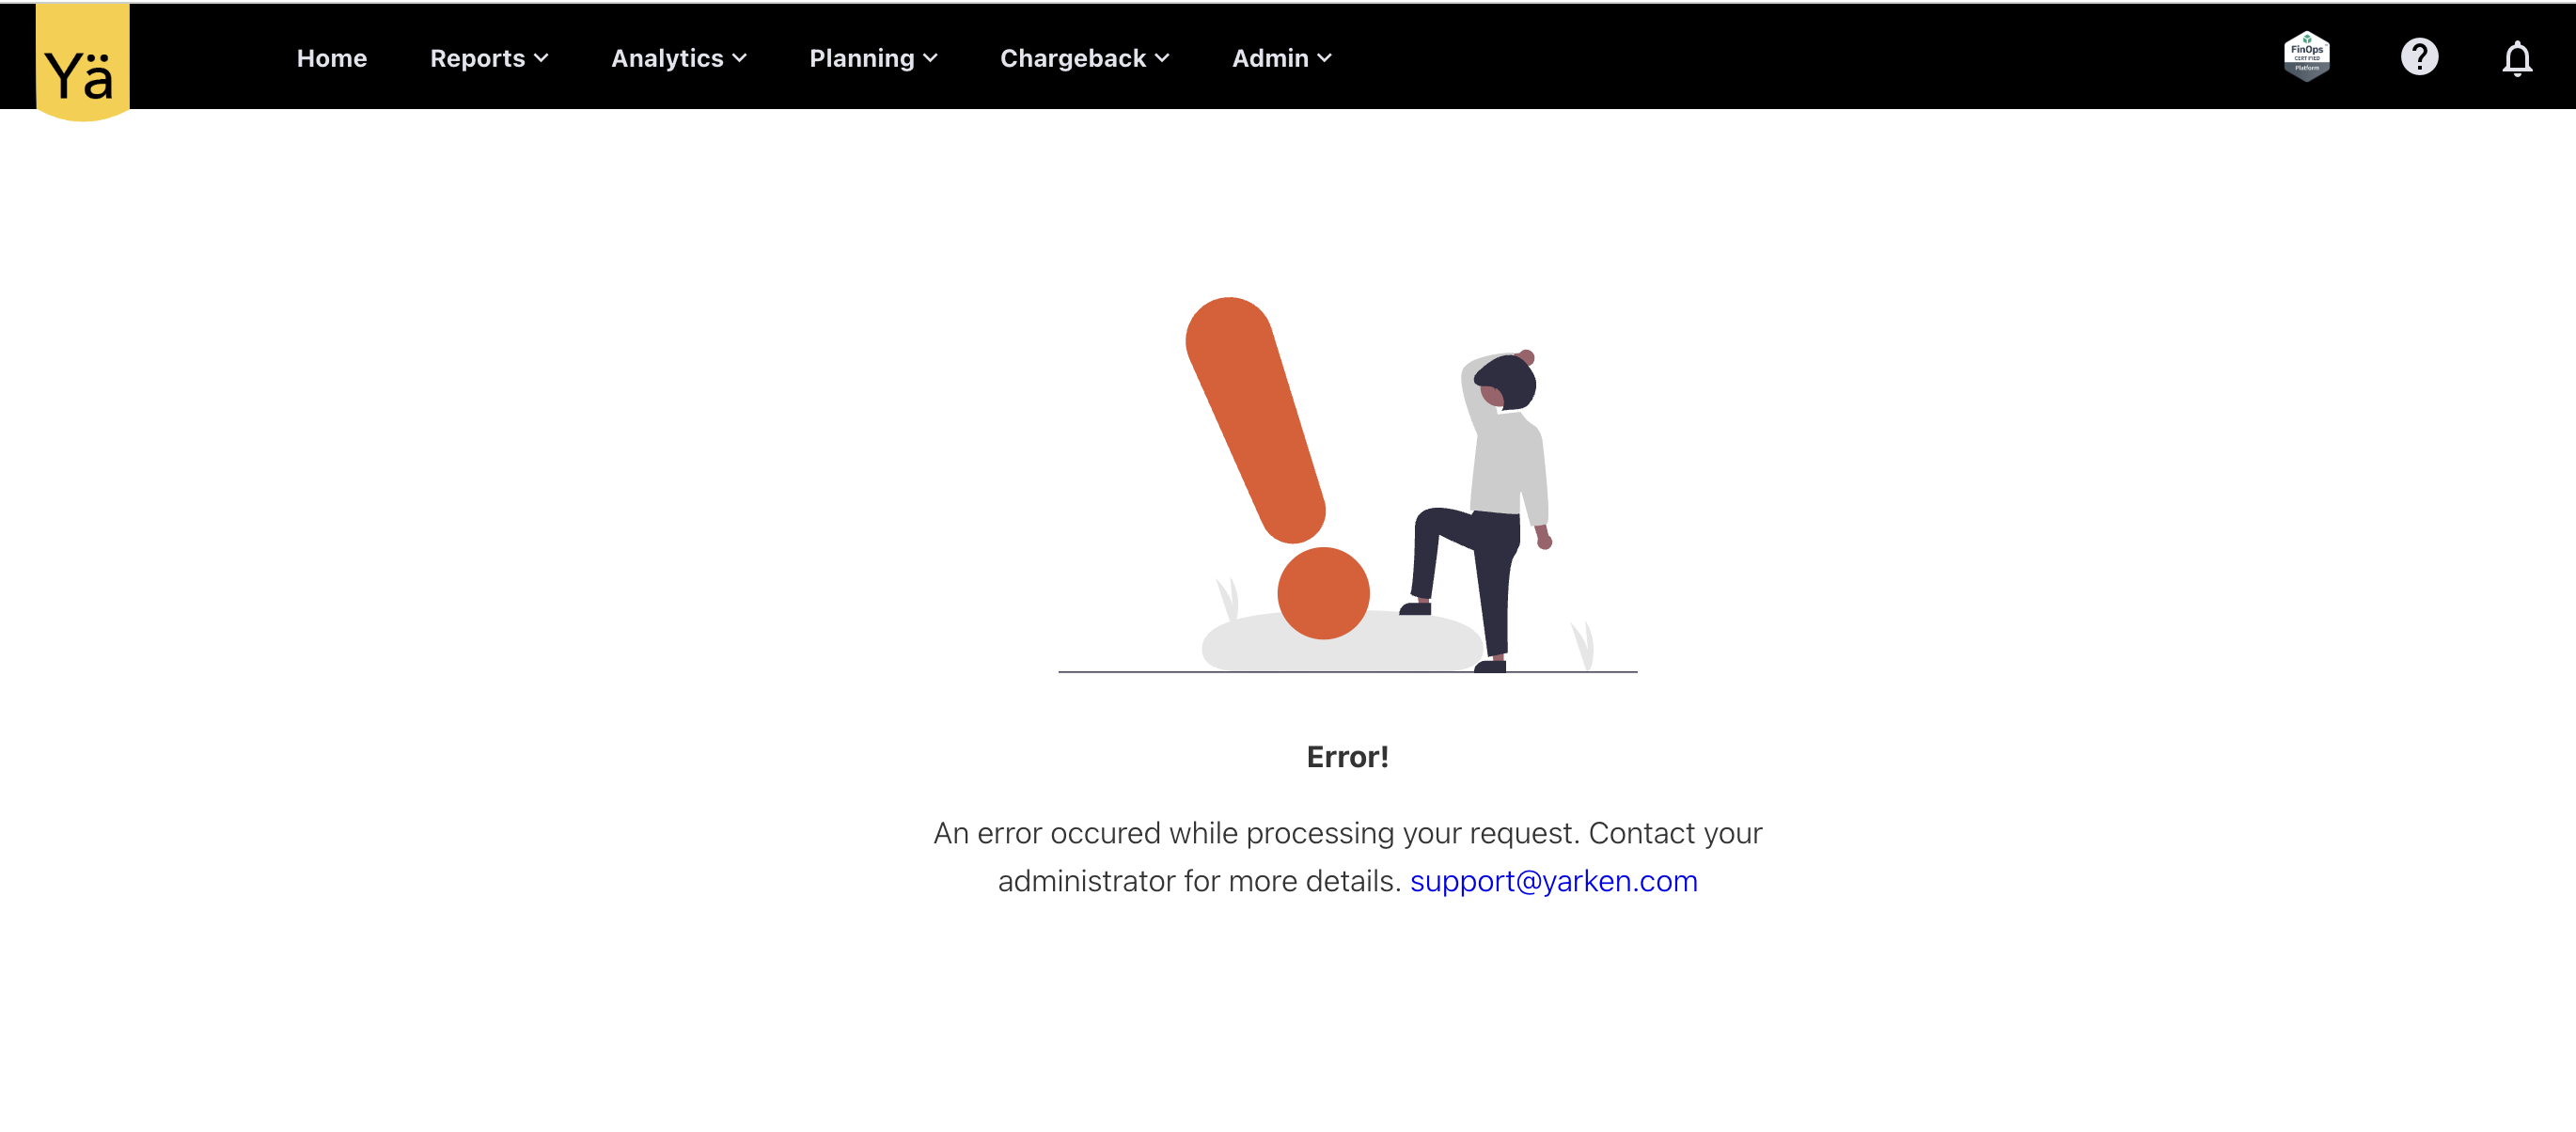
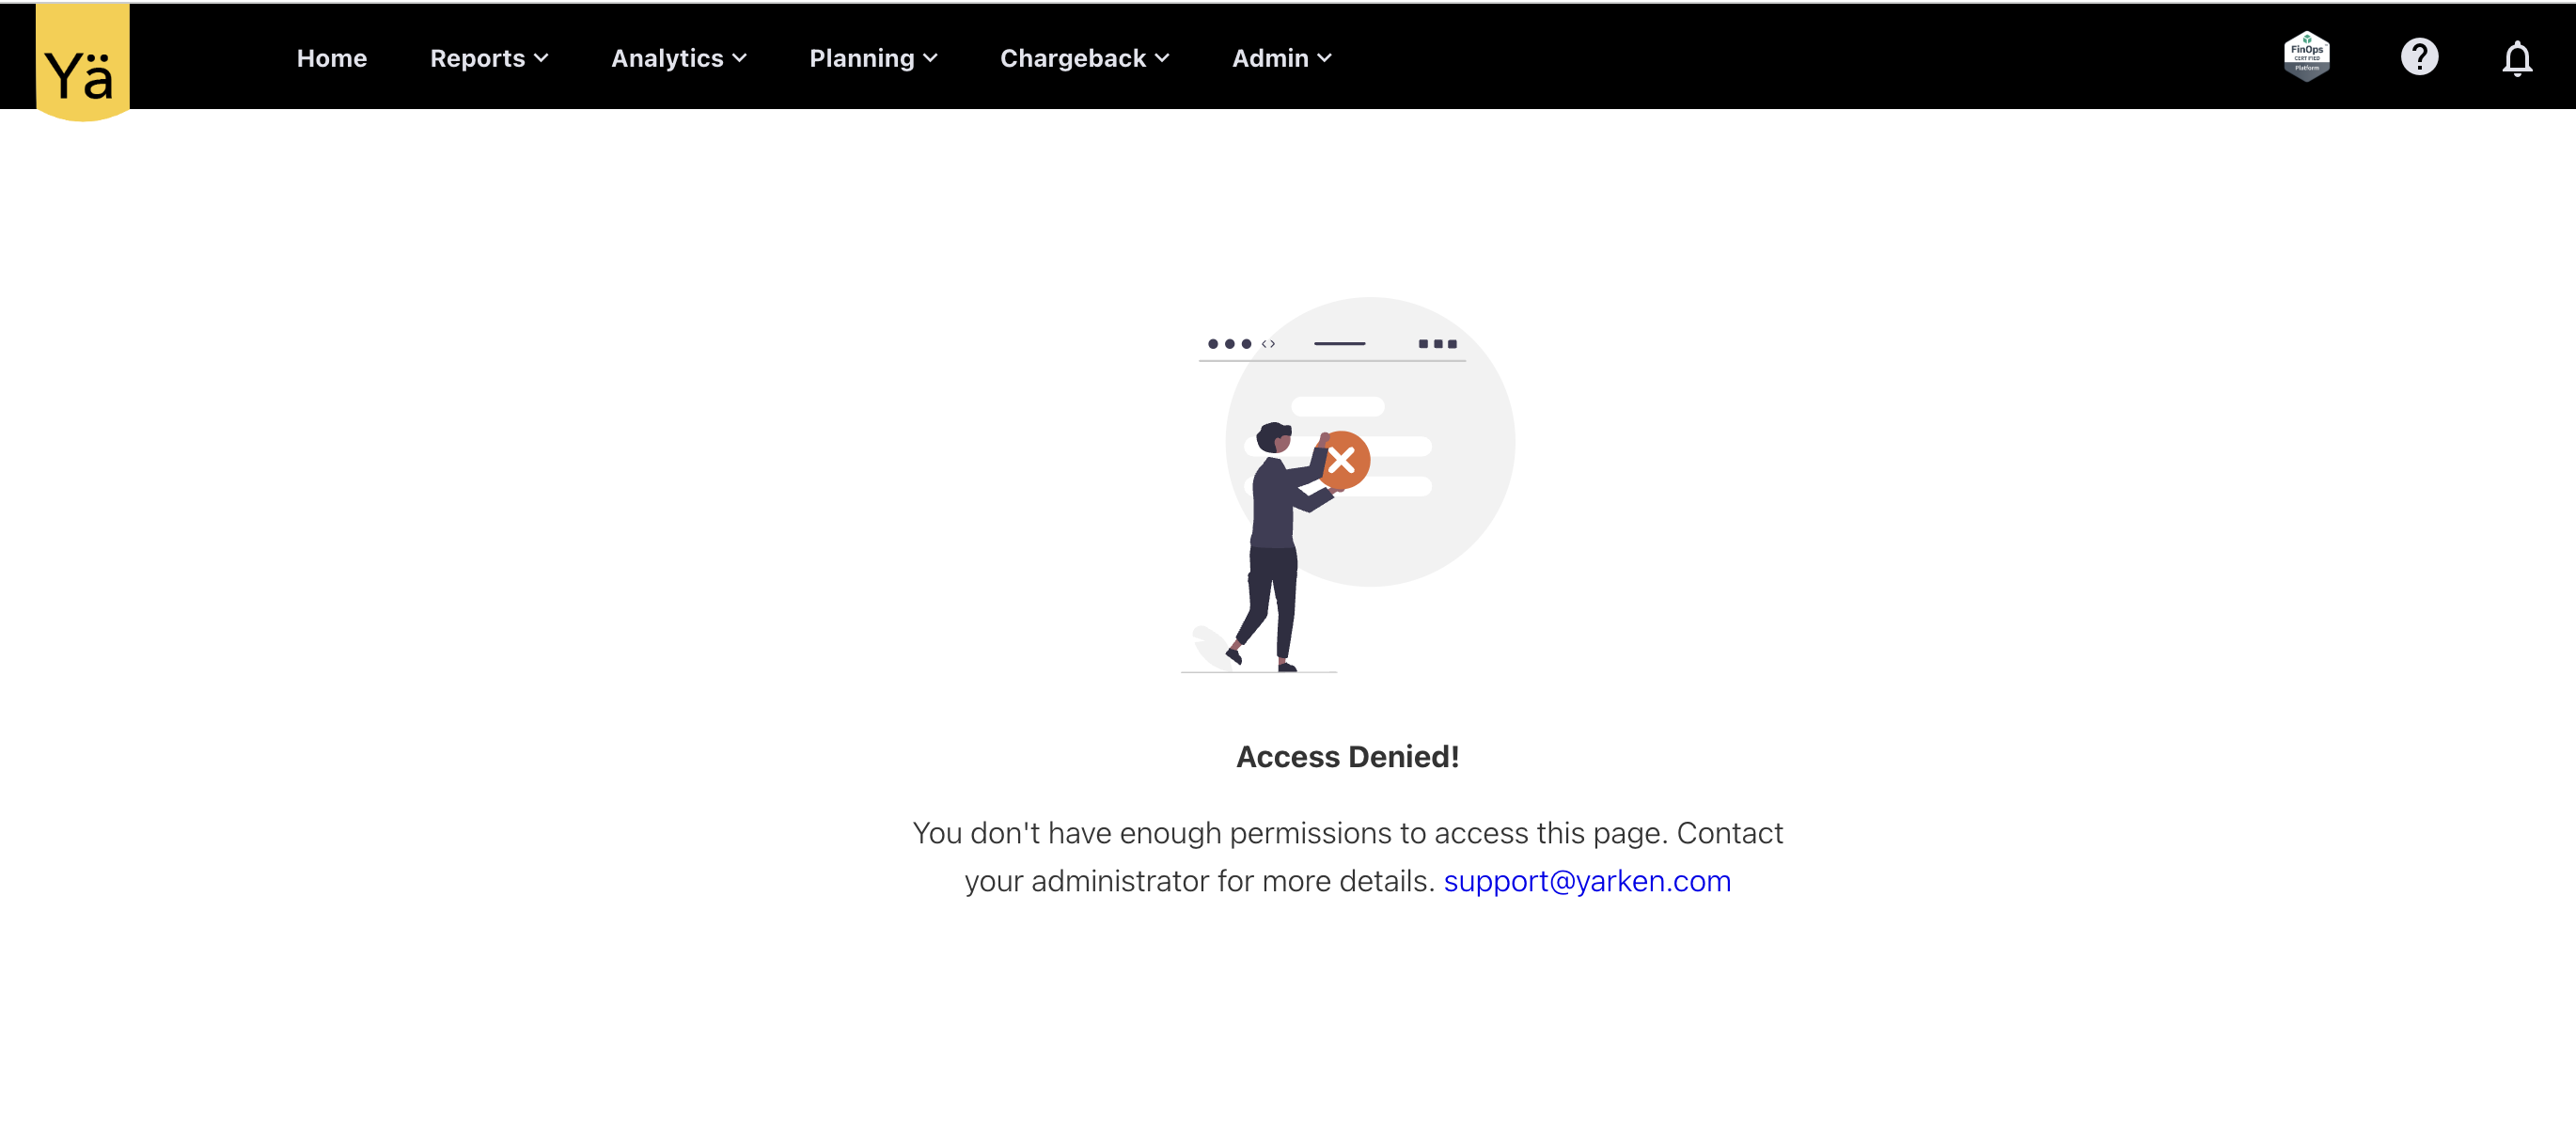
Email of Nominated Admin on Error Page
To provide a clear point of contact for the support, the support email address on error page and access denied page can now be customized to include nominated admin email. However, the default email address is set to support@yarken.com.
Bug Fixes
This release version includes below bug fixes:
-
Certain fields within the Filter section in the Custom Dashboard did not enable users to manually enter characters with spaces; however, pasting a string with spaces worked. This issue is fixed, and users can now enter text with spaces directly into these fields.
-
The chargeback process can now efficiently handle a large number of records.
May 26, 2025
New dashboards and enhancements
New Dashboards
This release introduces new dashboards exclusively designed for tracking license utilization and application activity.
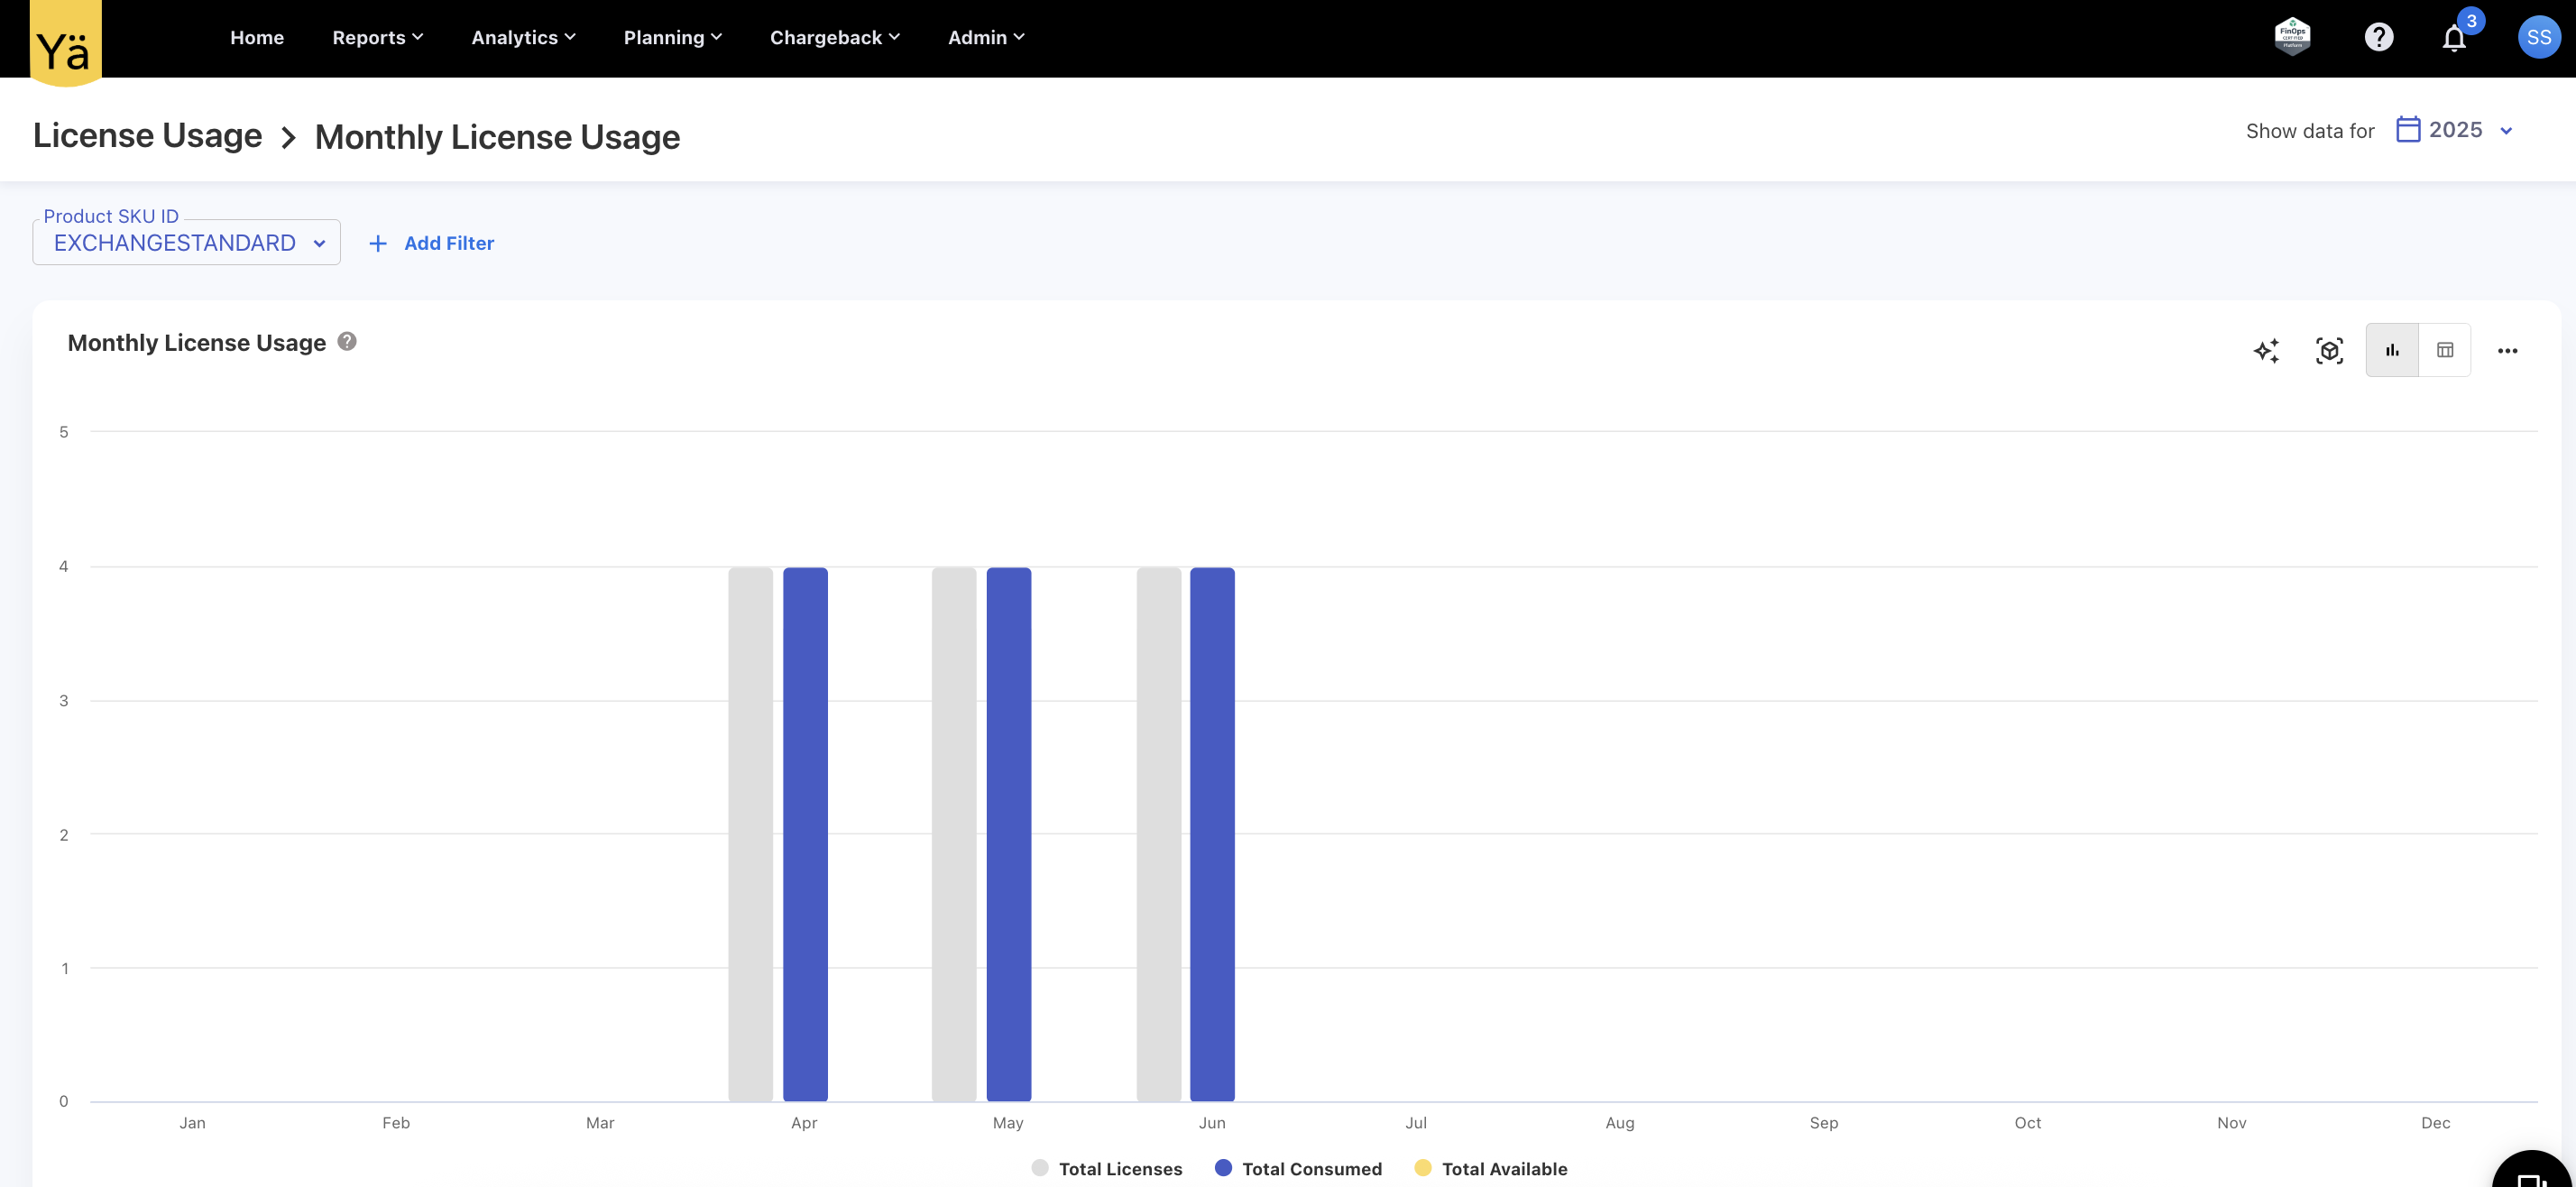
License Usage
A new License Usage dashboard displays monthly license usage data for a specific product. It helps you track:
-
Total licenses
-
Consumed licenses
-
Available licenses
The dashboard offers visibility into monthly license consumption trends and may be expanded to include additional charts and tables in future updates.
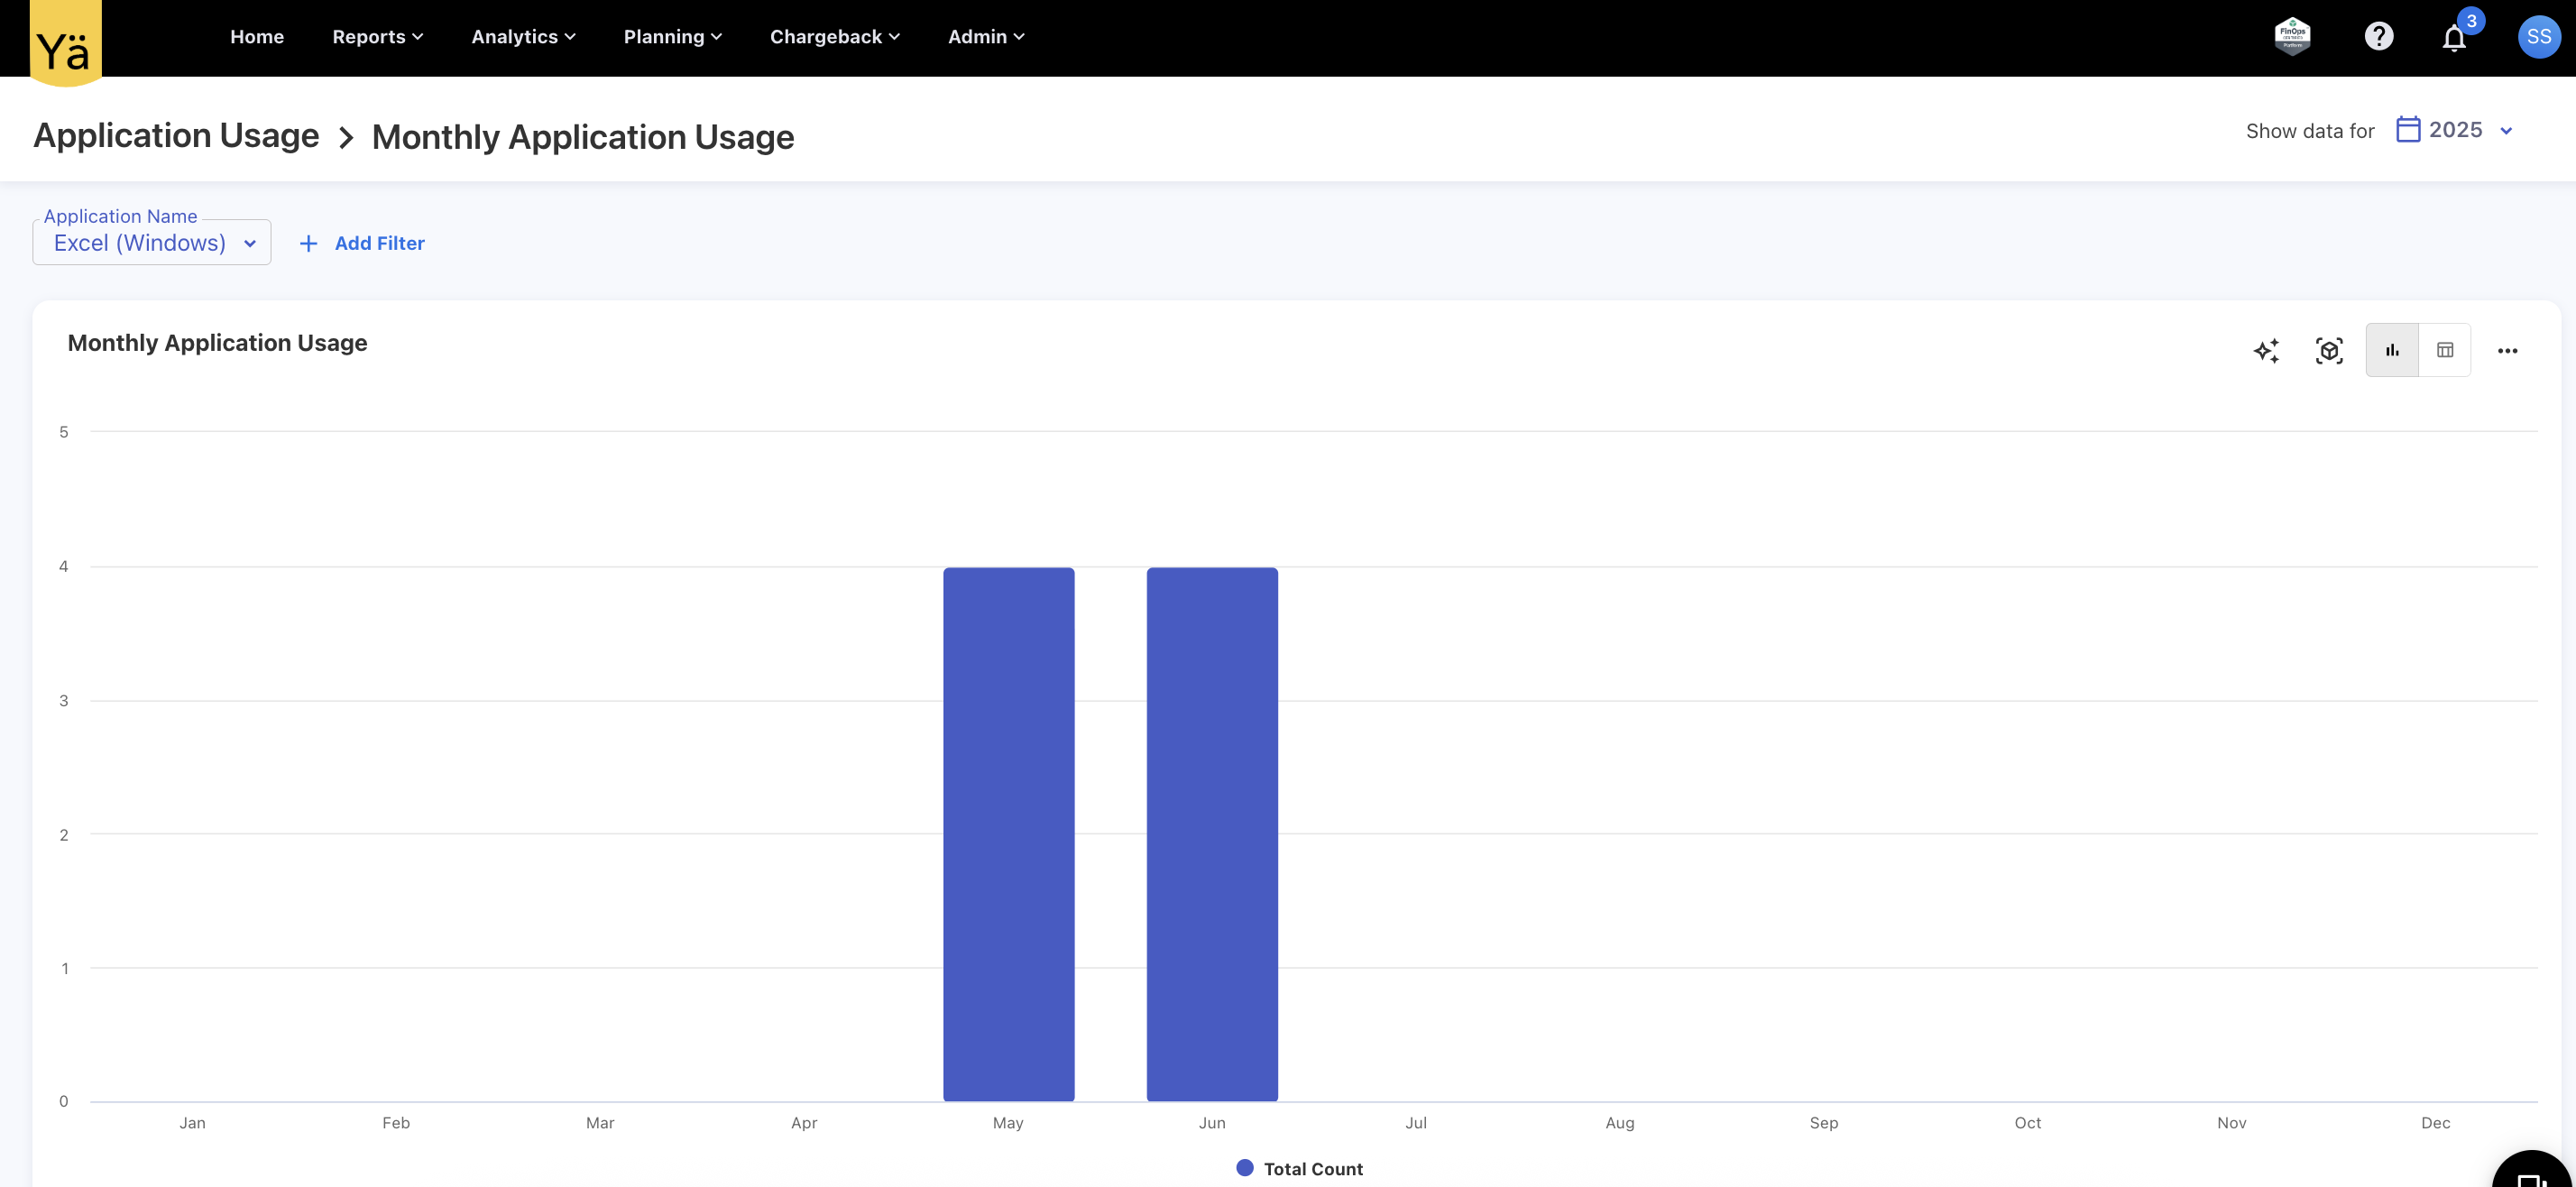
Application Usage
The Application Usage dashboard record the monthly usage count for a specific application. It helps you track and monitor how often an application is accessed or used over time, providing insights into monthly application consumption trends.
New Consumption Data Uploads
In addition with the Cloud and Mobile consumption uploads, we now support data uploads for:
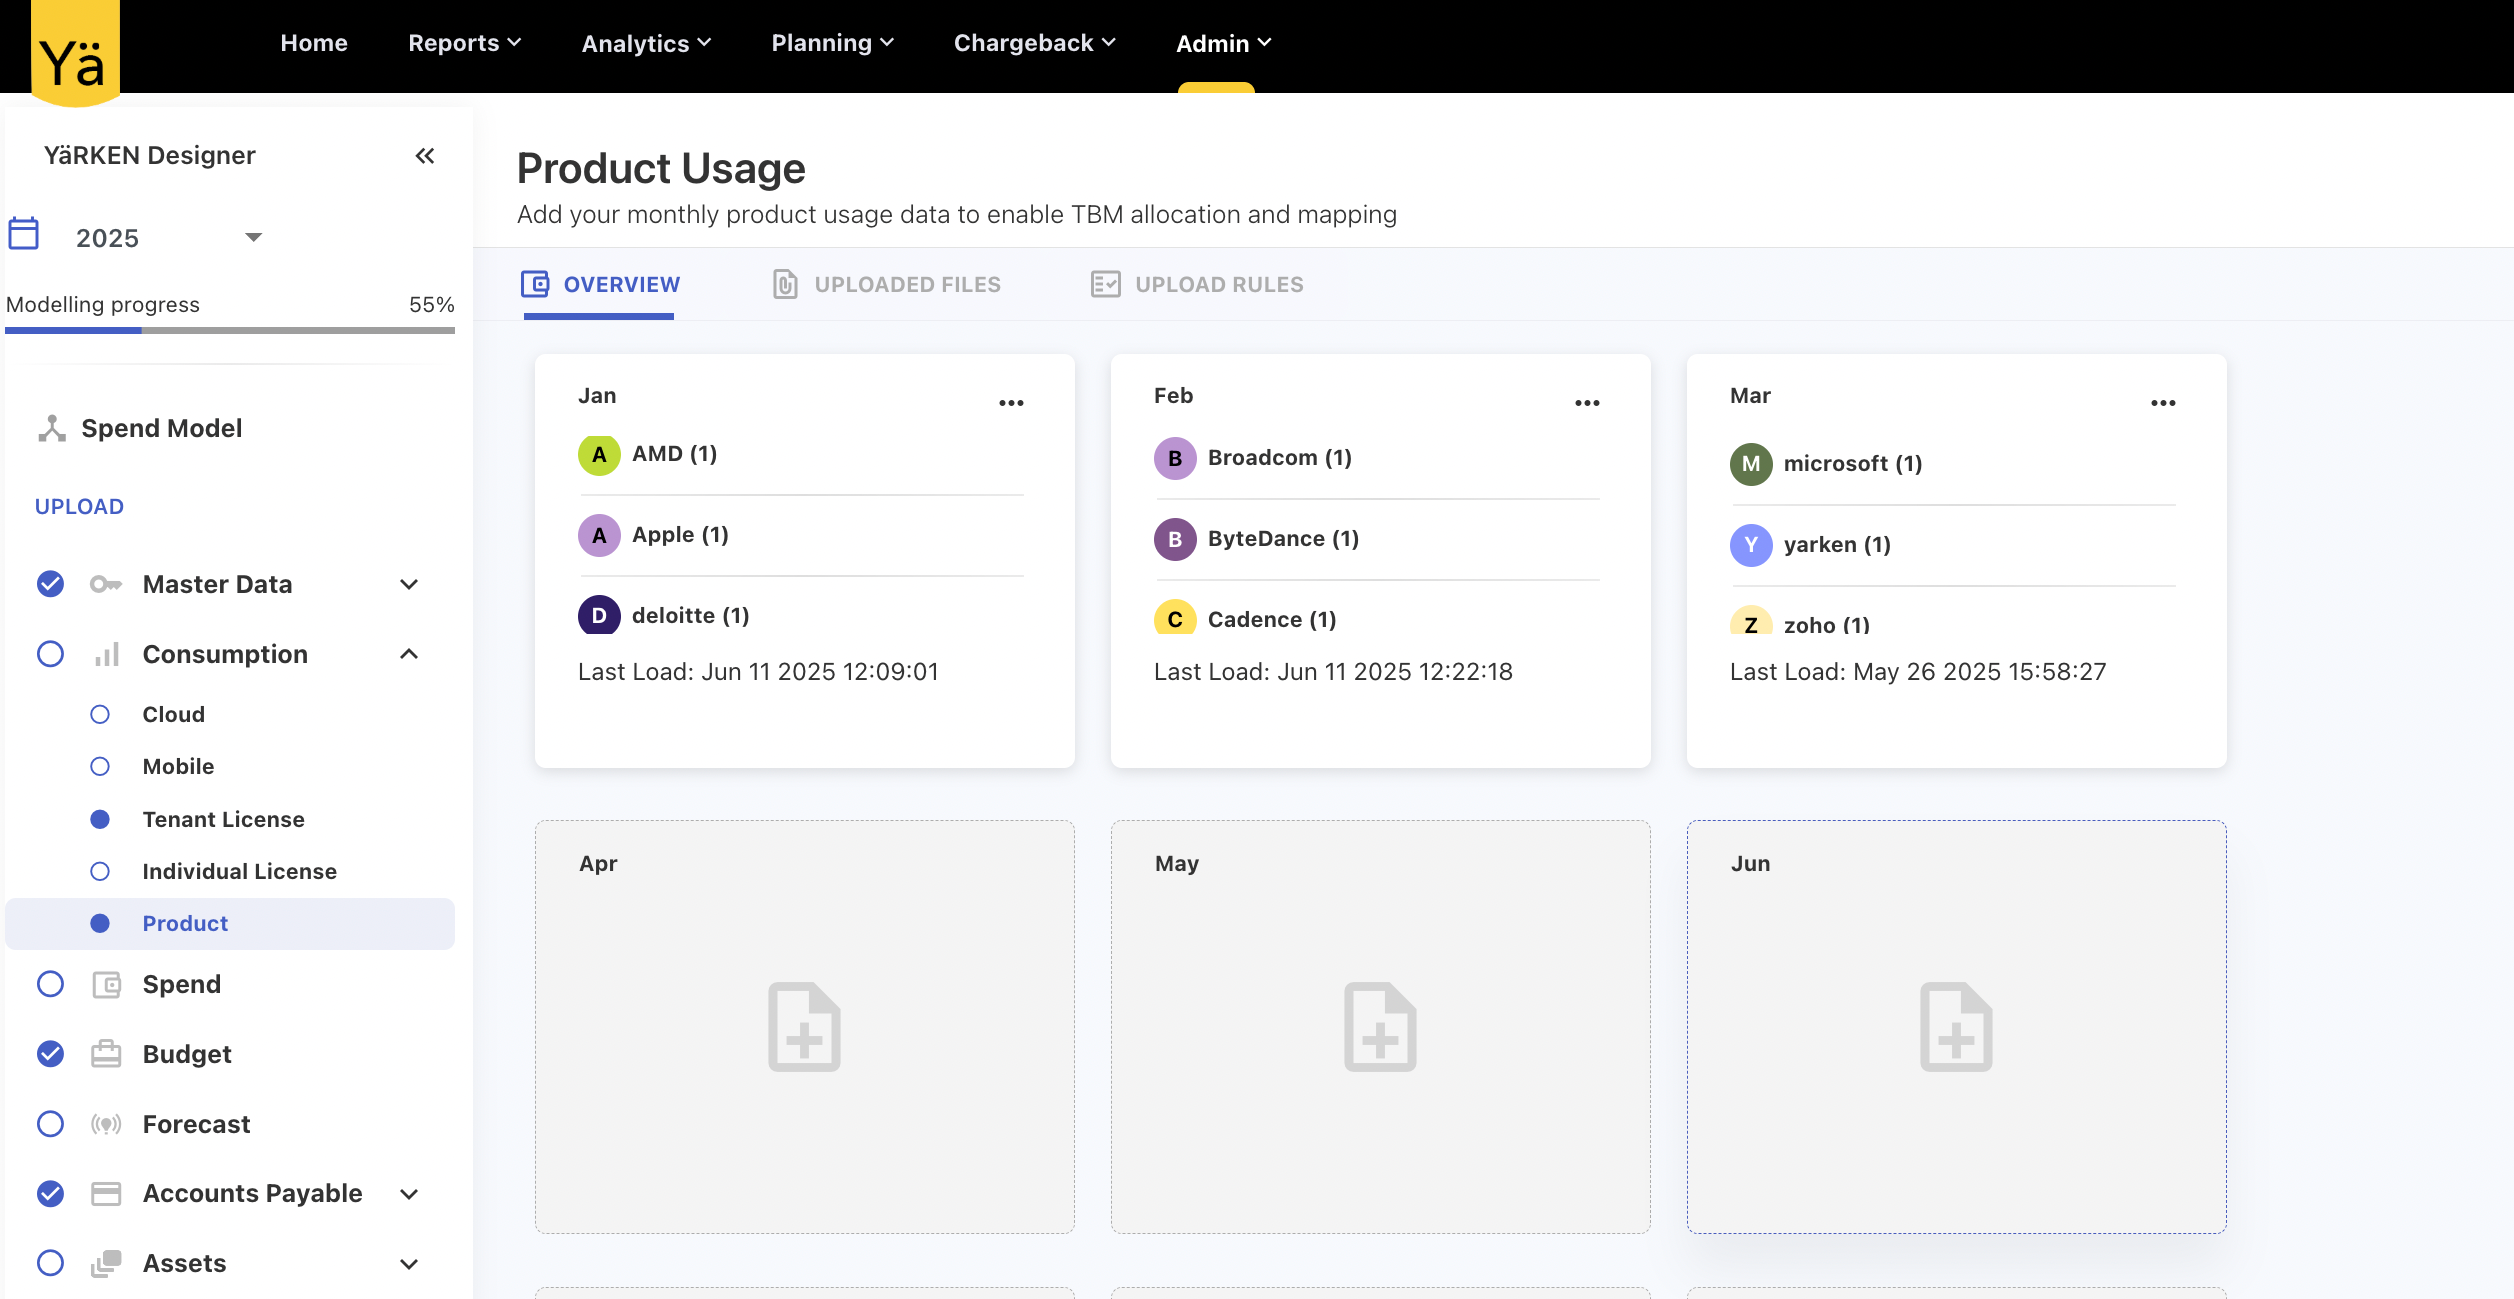
Product Usage
Users can now load month-on-month usage details for specific products. The uploaded data supports reporting and enables tracking monthly user-level engagement across different applications. While uploading, users can select the vendor associated with the data.
Individual License Usage
The Individual License Usage allows users to upload month-on-month individual product license usage data. This upload helps in the monitoring and reporting of license consumption by tracking license usage at the user level. Users can assign the usage data to a specific vendor during upload.
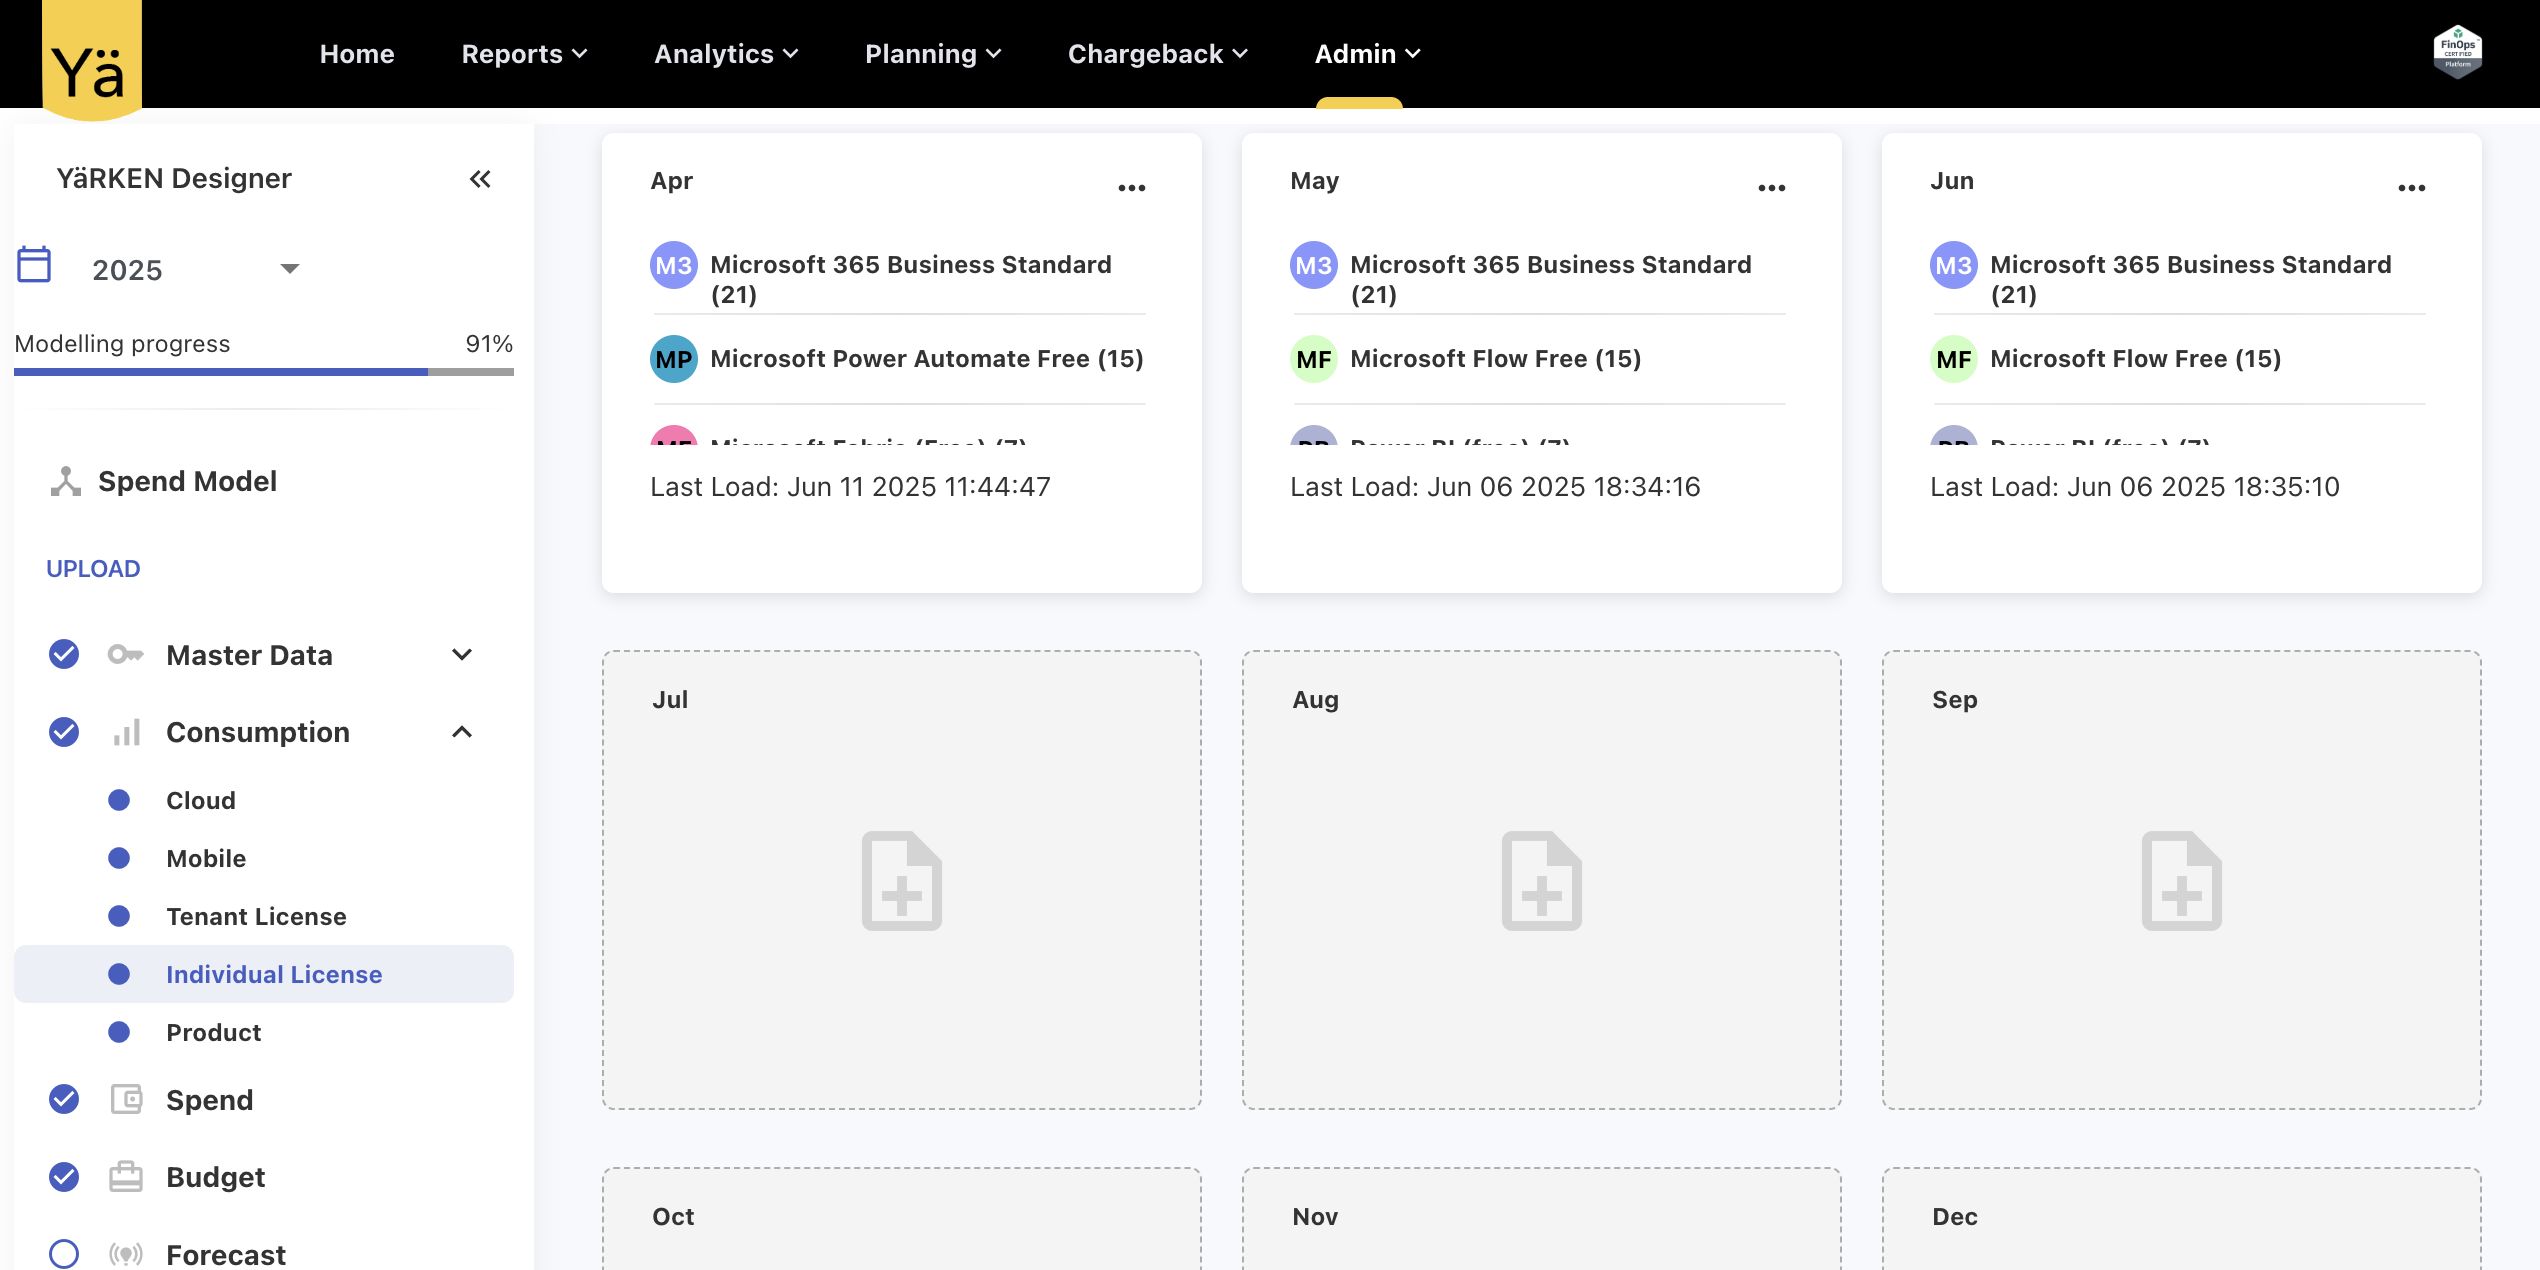
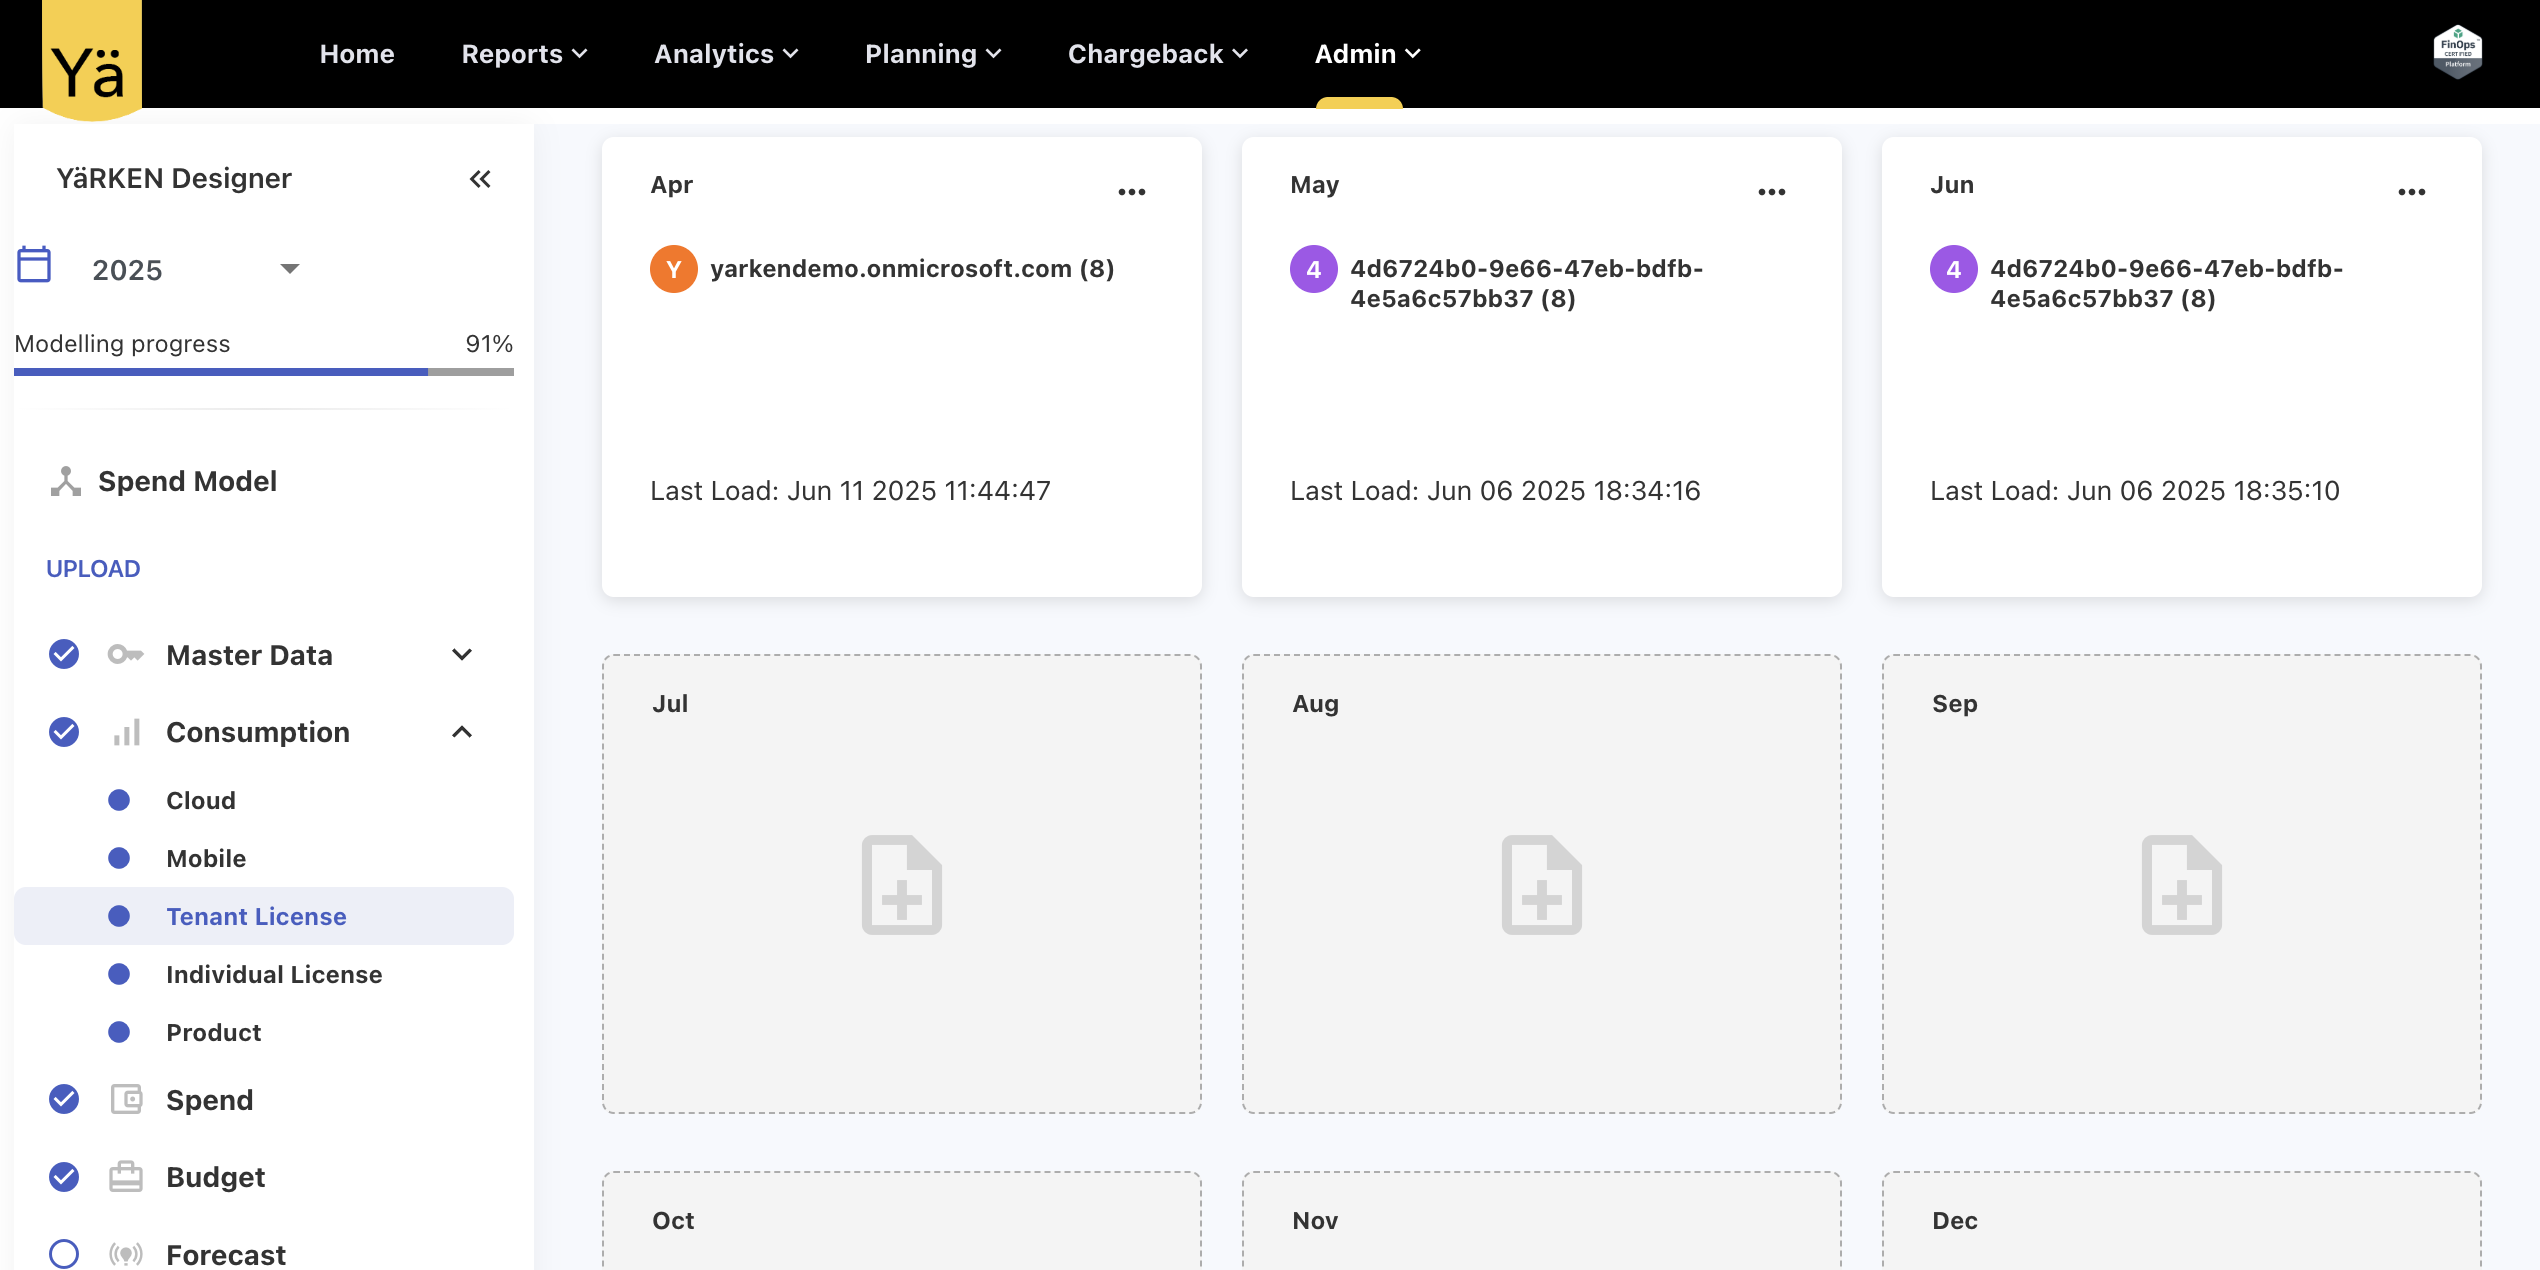
Tenant License Usage
Users can now upload month-on-month individual tenant license usage data for reporting. This data helps track license allocation and license availability at the tenant level. Users can assign the usage data to a specific vendor during upload.
Alerting Enhancement
Cloud Spend Alerting
A new metric type Cloud Spend is added in the Alerting feature. Users can now configure cloud spend alerts based on specific cloud fields such as Resource Name, Resource Type, Provider, and define threshold values to trigger alerts when spend crosses the defined limits.
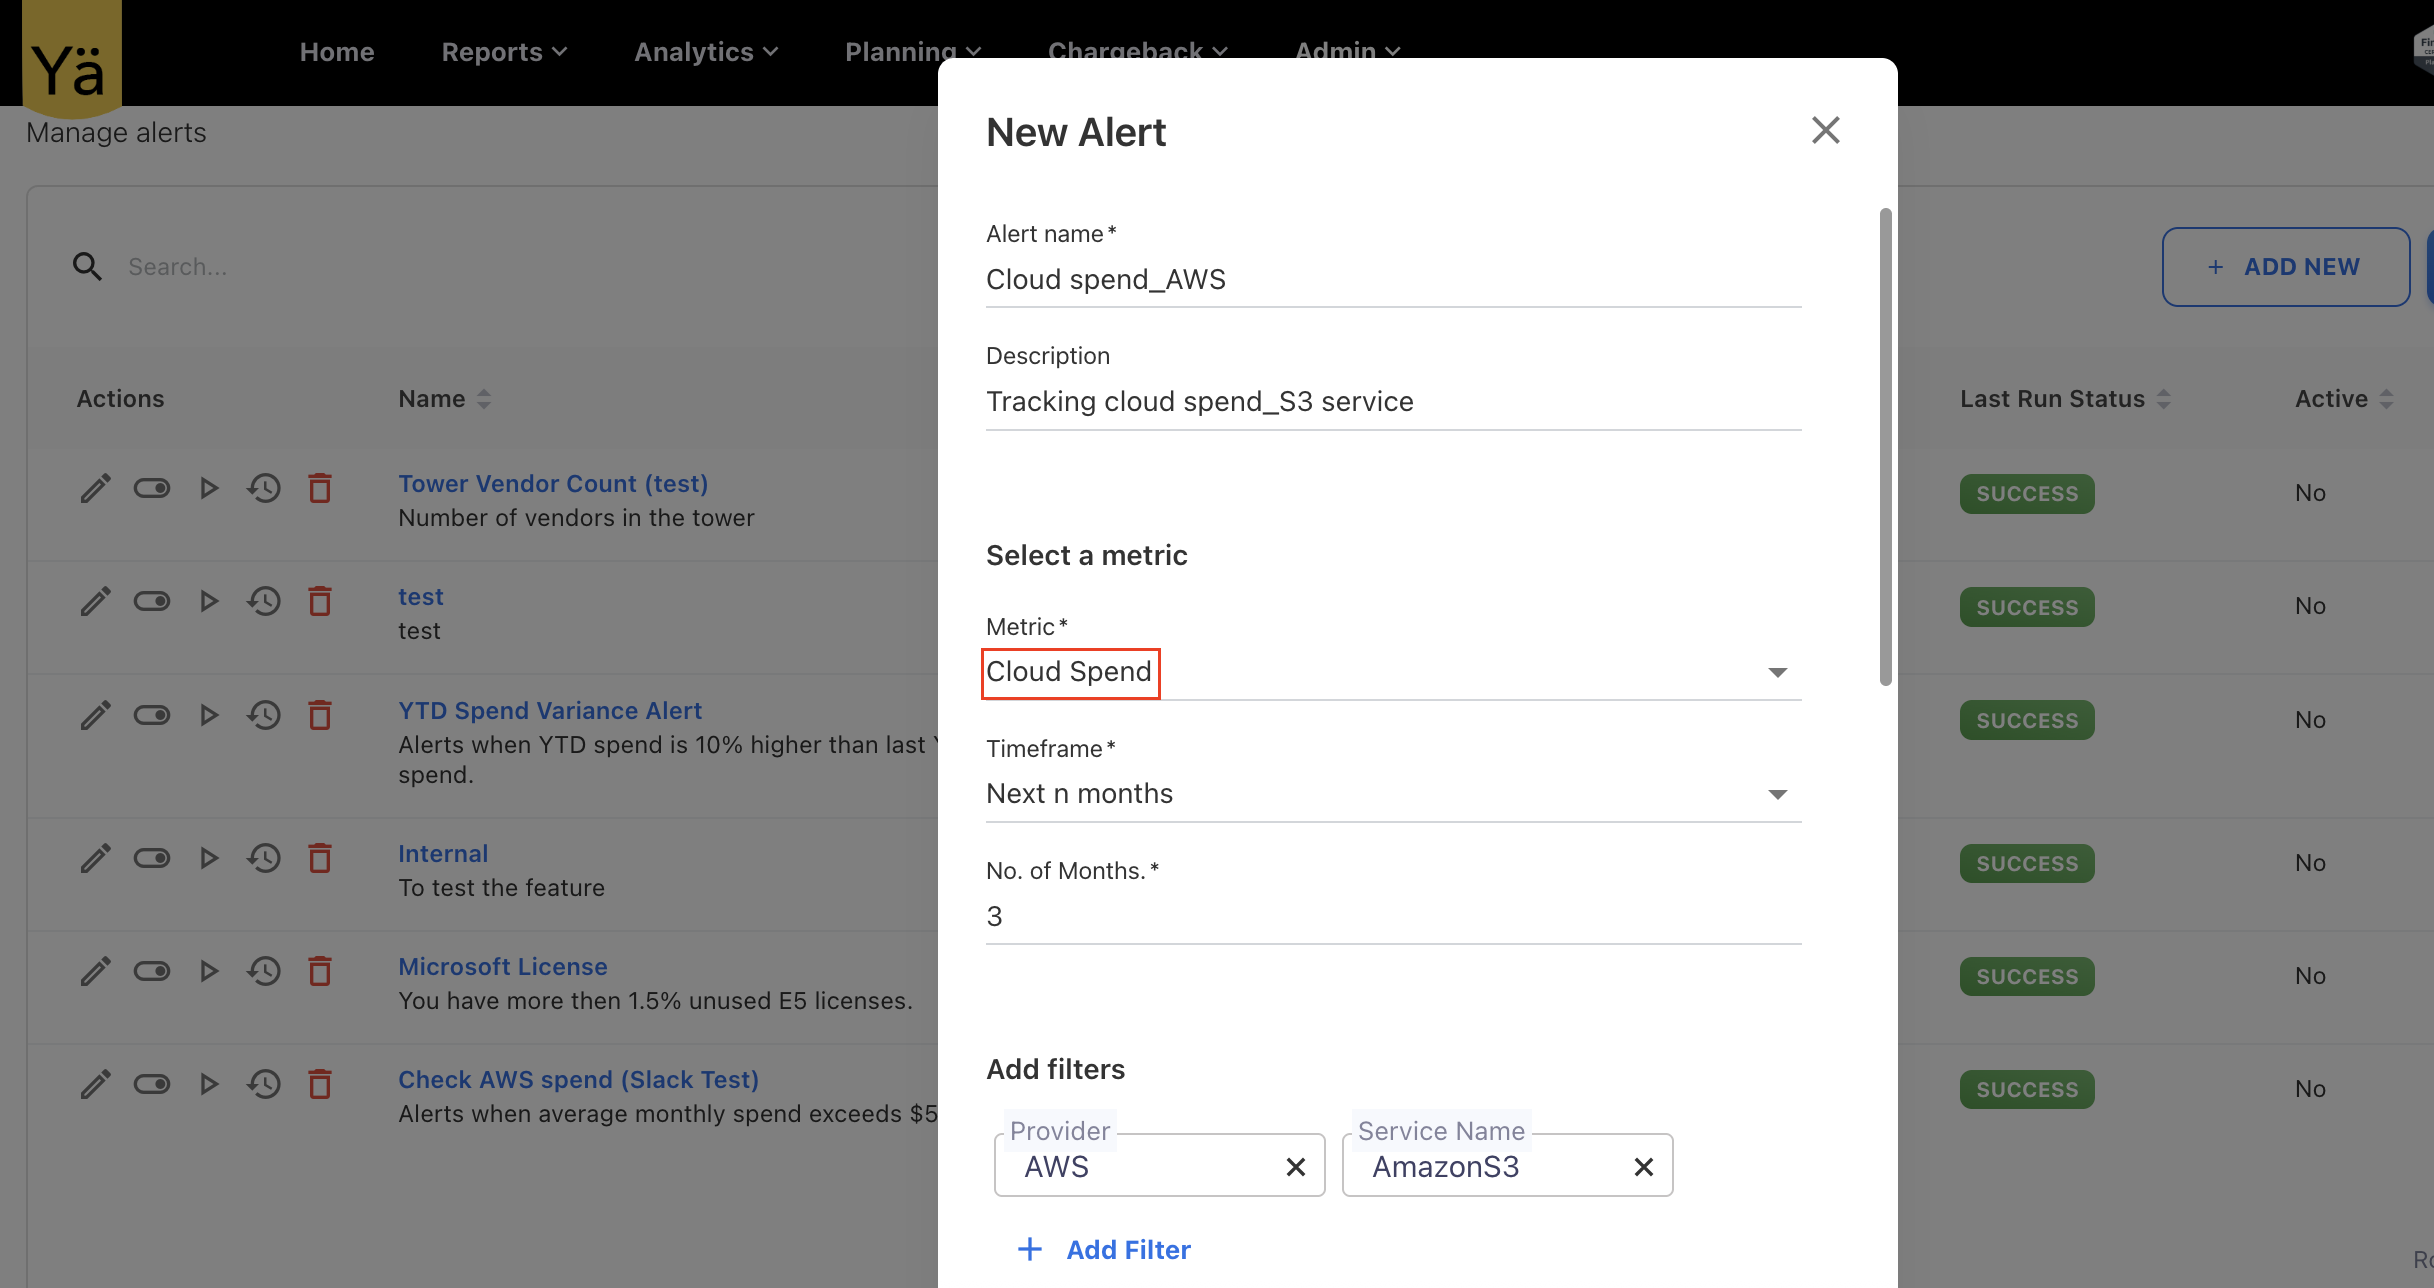
In addition, Timeframes value for all the fields are updated to include the day fields – Current Date, Last n days, last n days (include current), Last n days, Last n days (include current).
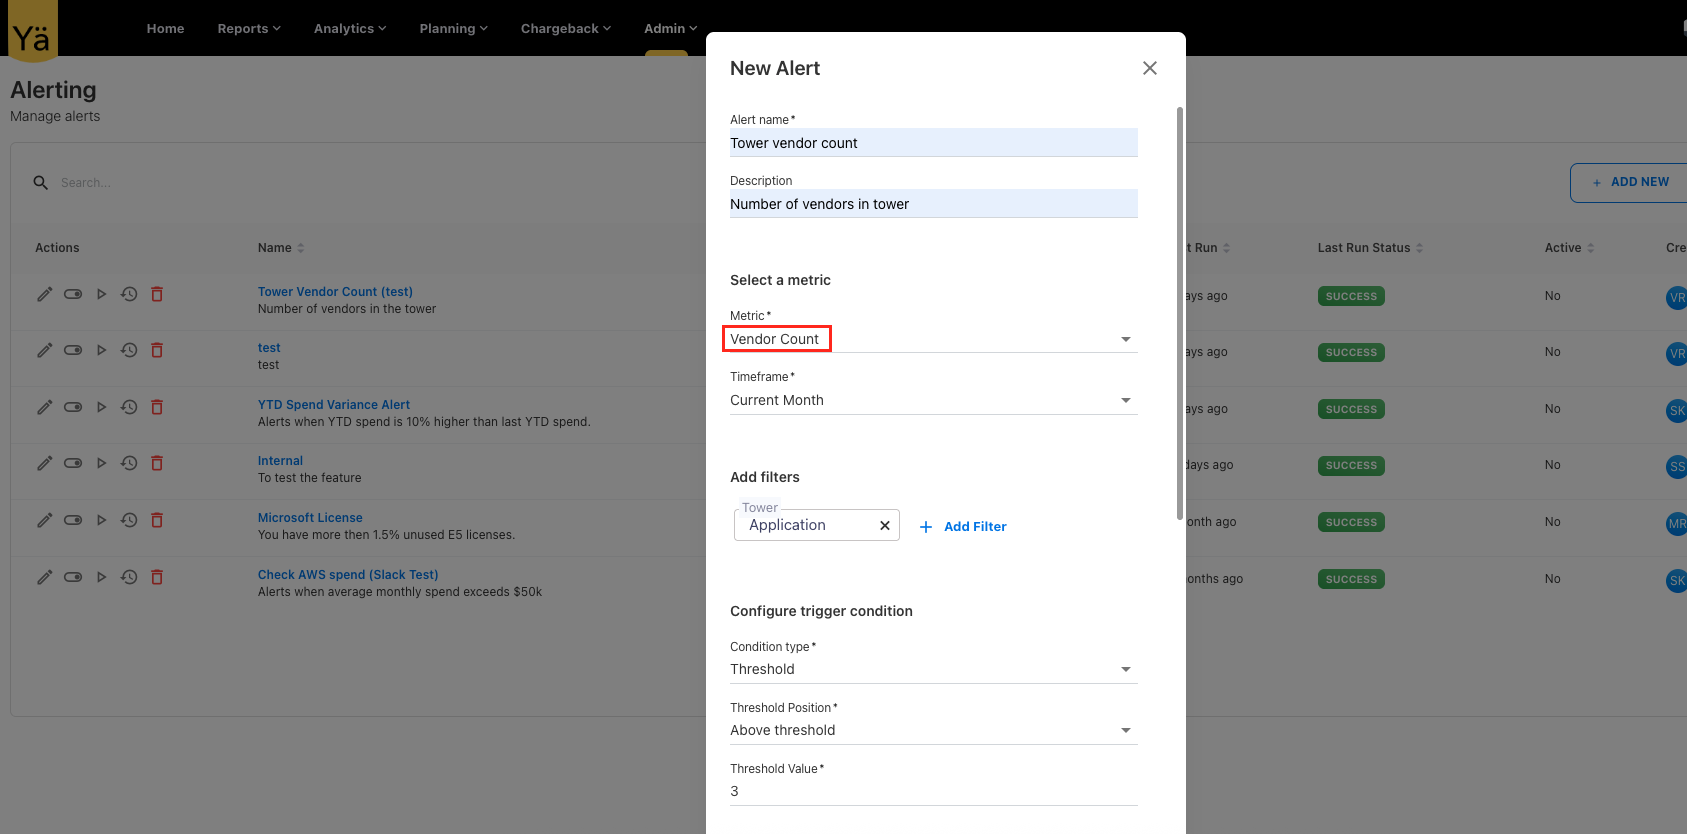
Vendor Count Alerting
A new metric type called Vendor Count is introduced in the alerting feature that monitors the number of vendors assigned to cost pools or towers. Users can now configure alerts that trigger when the vendor count in the cost pools or towers exceeds or falls below the defined threshold value.
May 19, 2025
Enhancements
Microsoft Graph API Integration
We have introduced a Microsoft Graph API integration into YäRKEN application, allowing you to seamlessly sync Microsoft 365 license and product usage details. This new API integration enables the users to automate license data retrieval and use comprehensive license information for reporting and analytics.
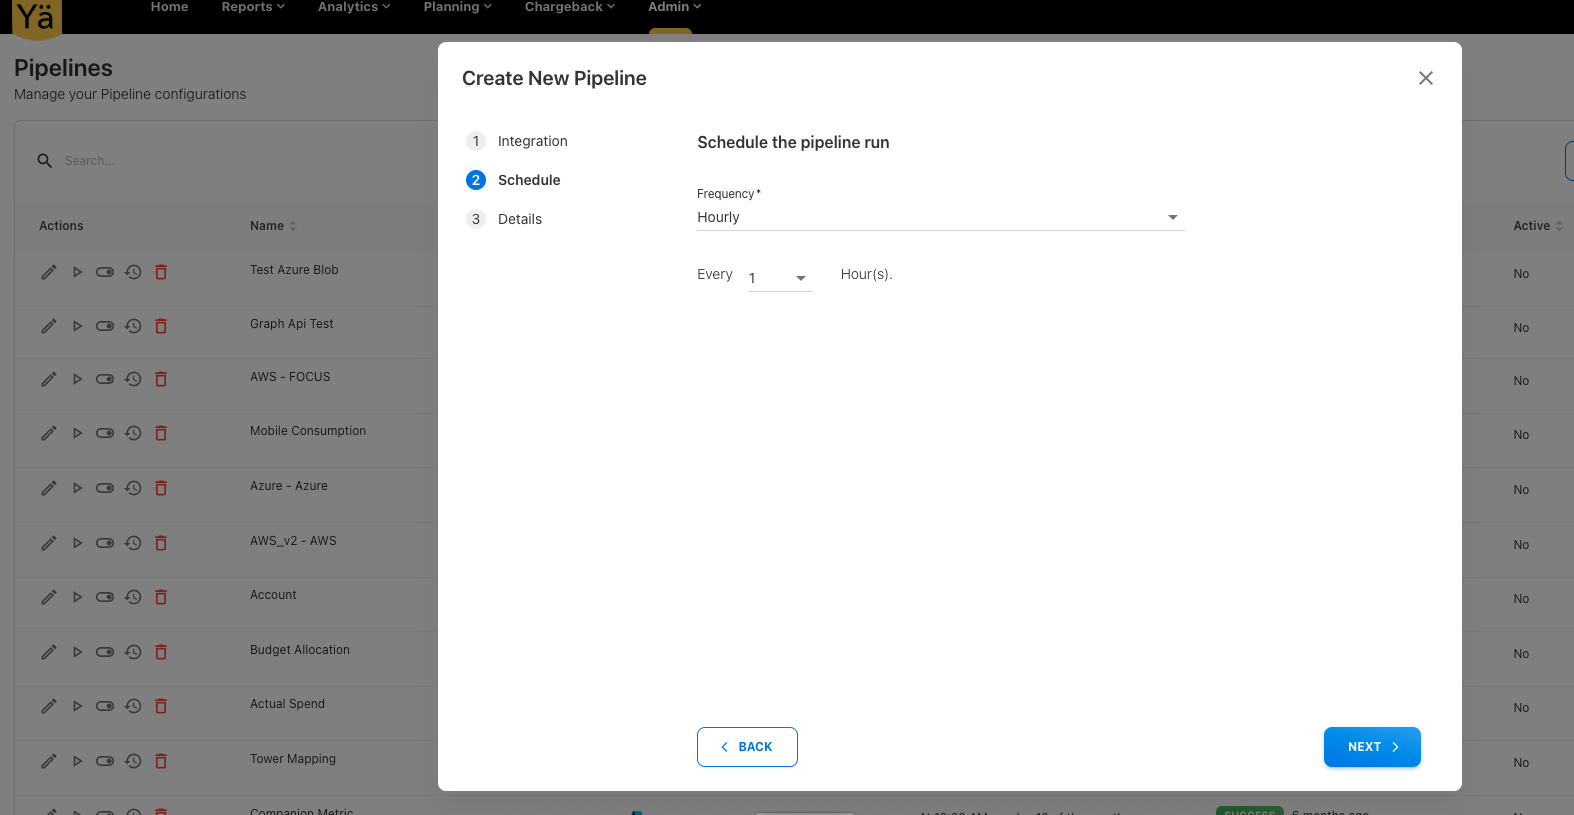
The integration is designed to work through the Pipeline feature. Users can set up a new pipeline connection to sync License Details or Product Usage Details using Tenant ID, Client ID, and Client Secret. Users can also schedule pipeline run that automatically sync data at defined intervals. Once the data is fetched, it becomes available for use in the License Usage analytics cube.
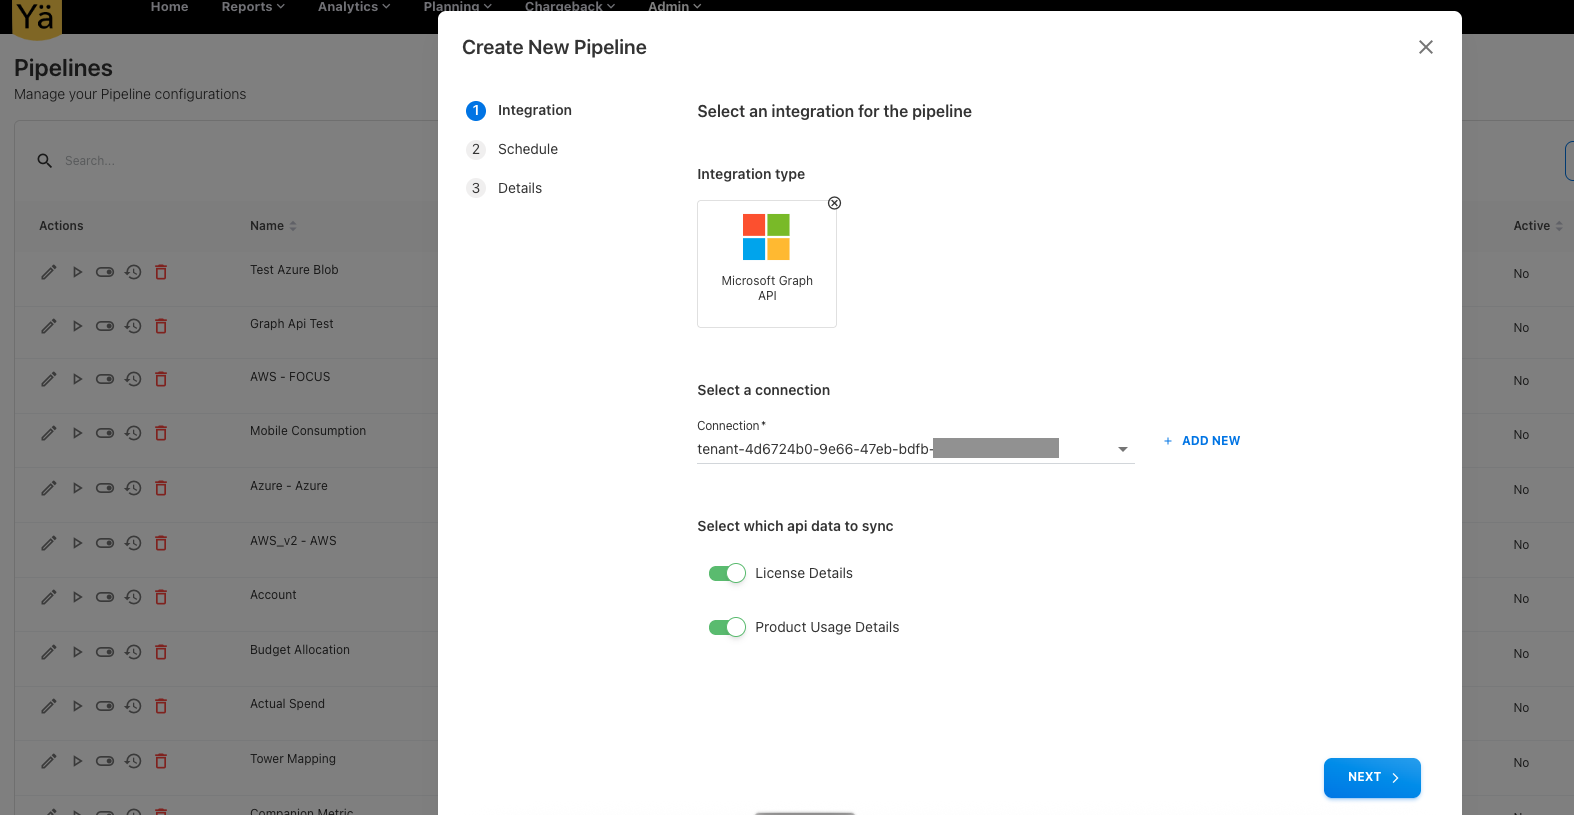
This new API integration provides greater visibility into license allocations and product usage trends across the organization.
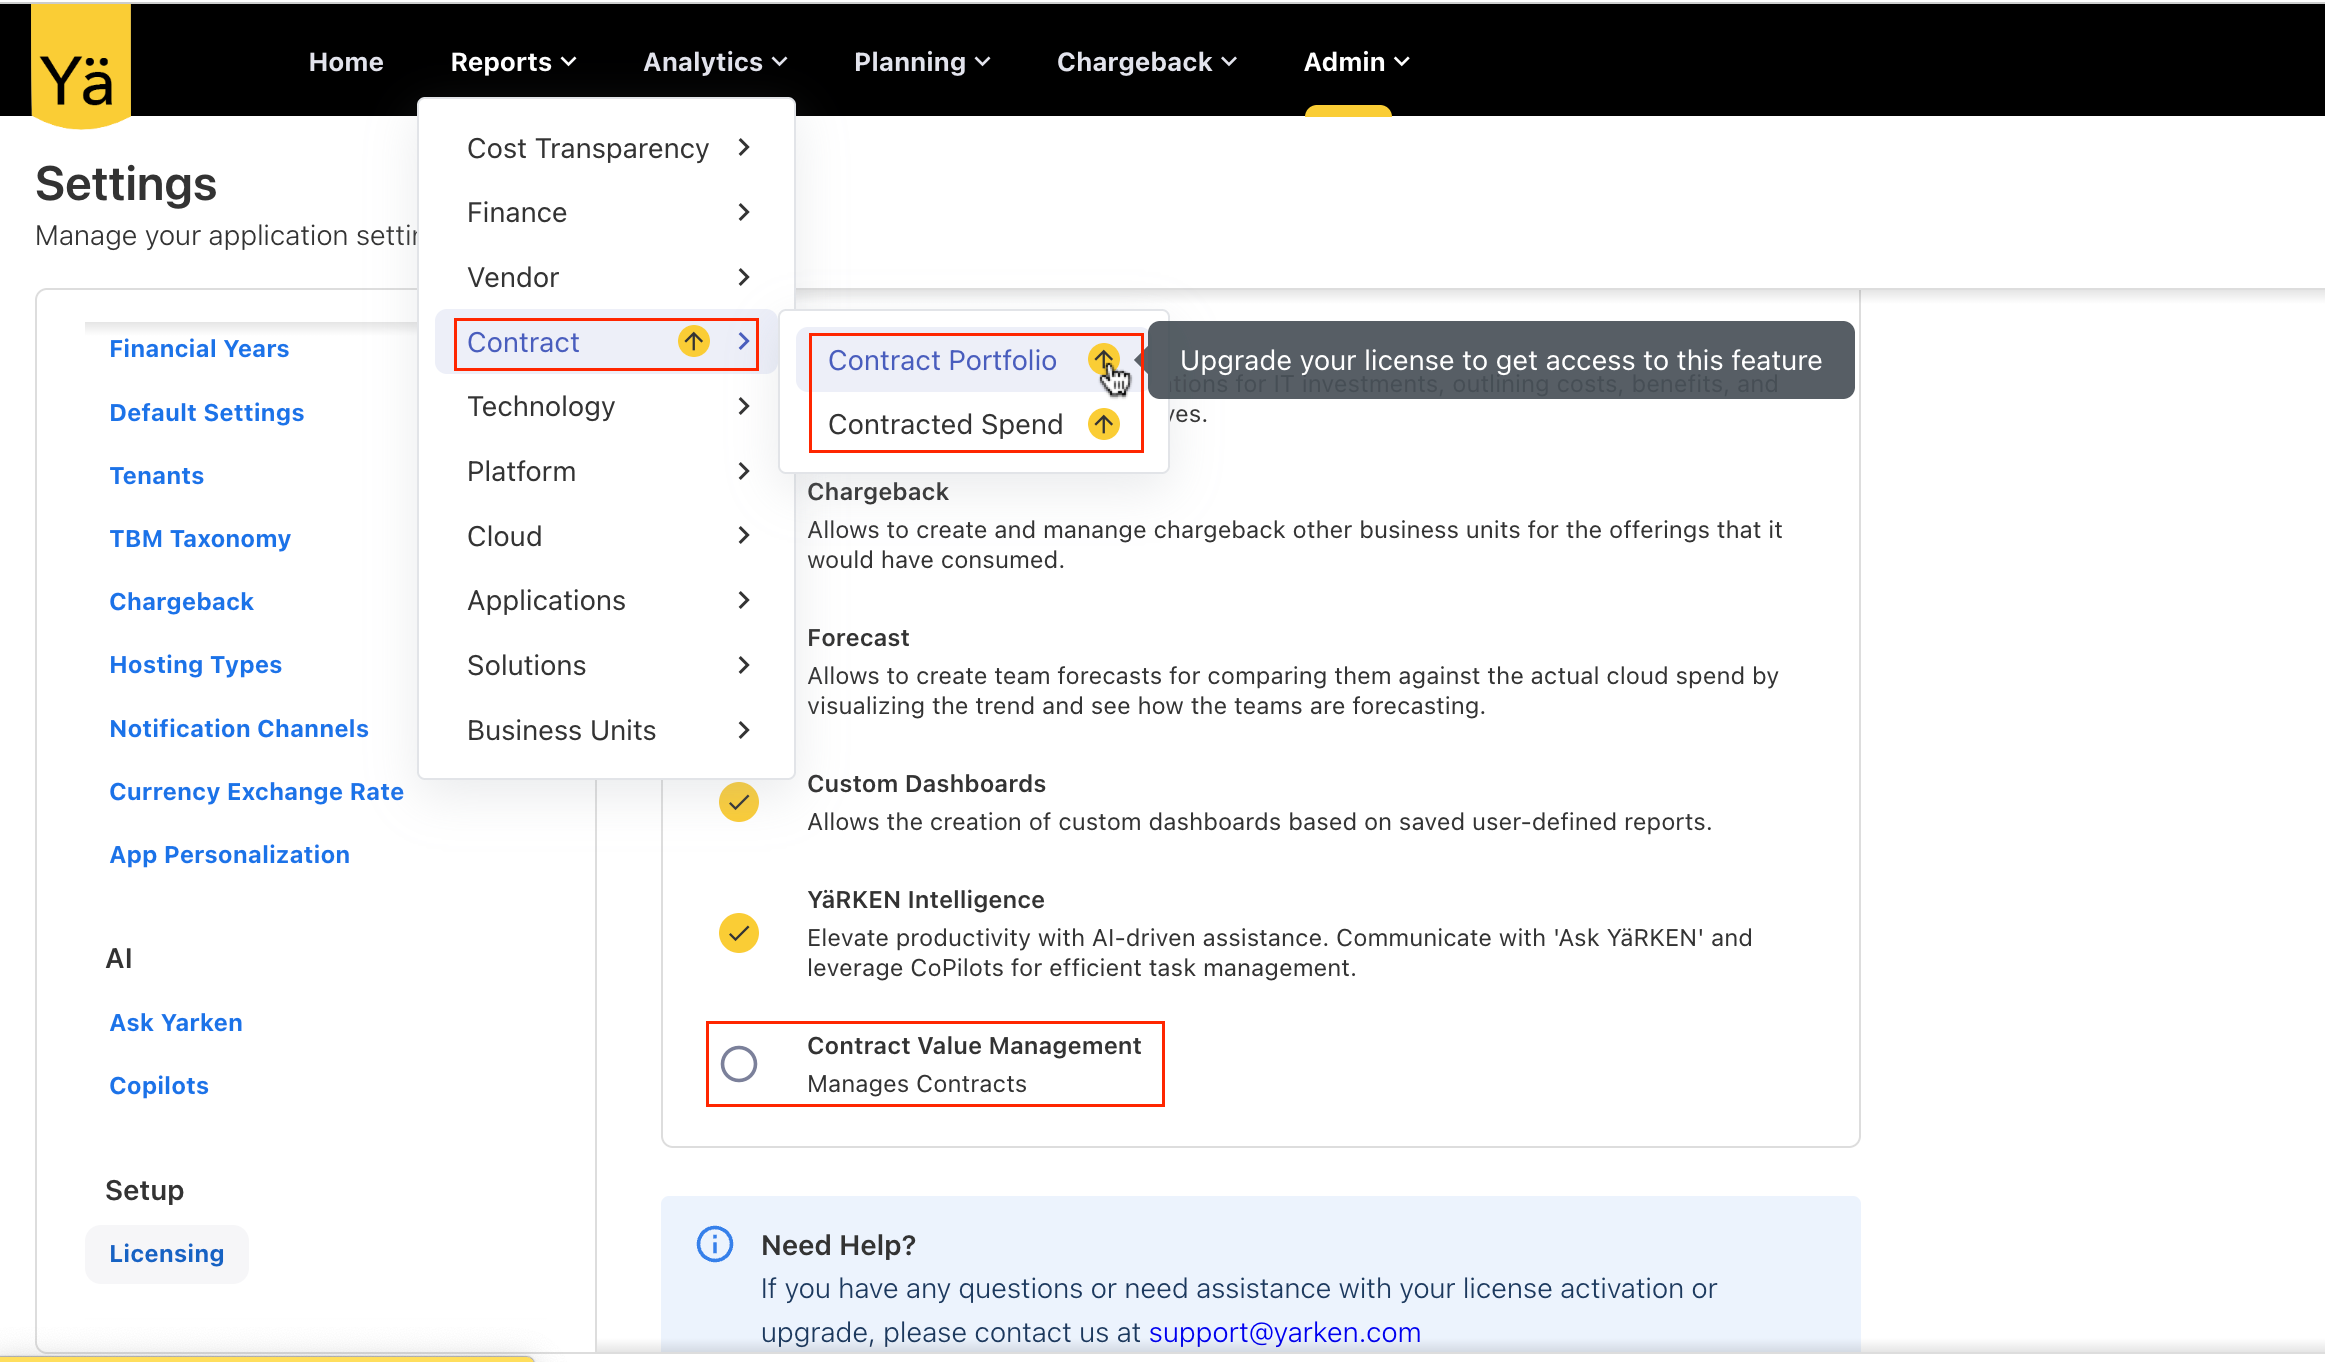
New License: Contract Value Management
We have introduced a new license—Contract Value Management—designed specifically for contract tracking and reporting. As part of this change, the existing contract-related dashboards, Contract Portfolio and Contracted Spend, are moved under this new license. In addition, the License Usage reporting cube is also brought under this new license.
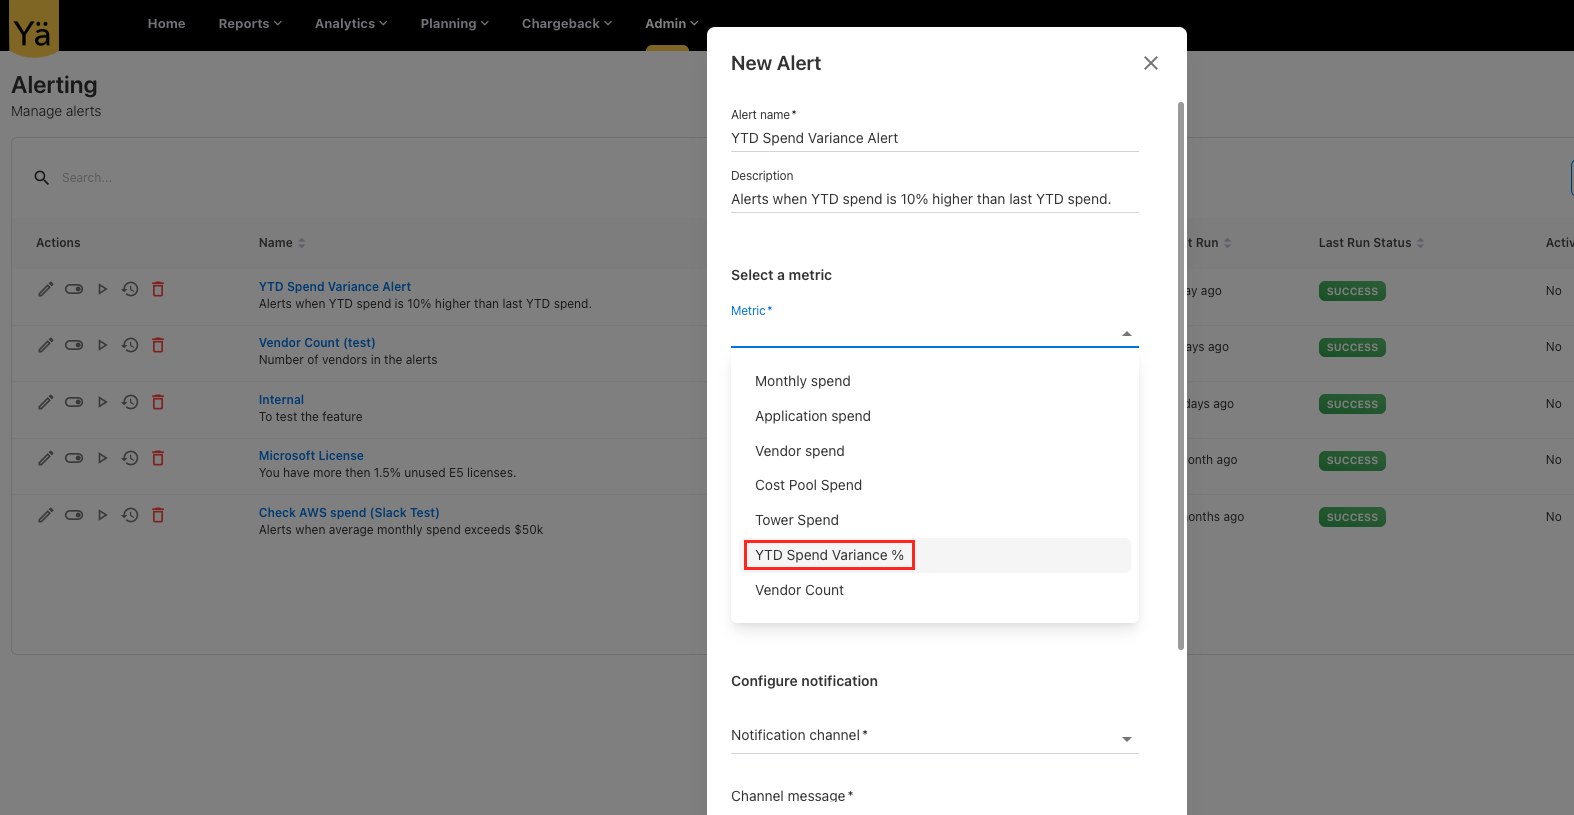
New Alert Metric: YTD Spend Variance %
An alerting feature is now included with a new metric type called YTD Spend Variance % that allows you to set alerts based on the percentage variance between actual YTD spend and prior year spend. This metric tracks the difference between the current YTD spend and the previous year's YTD spend, highlighting any significant increases or decreases.
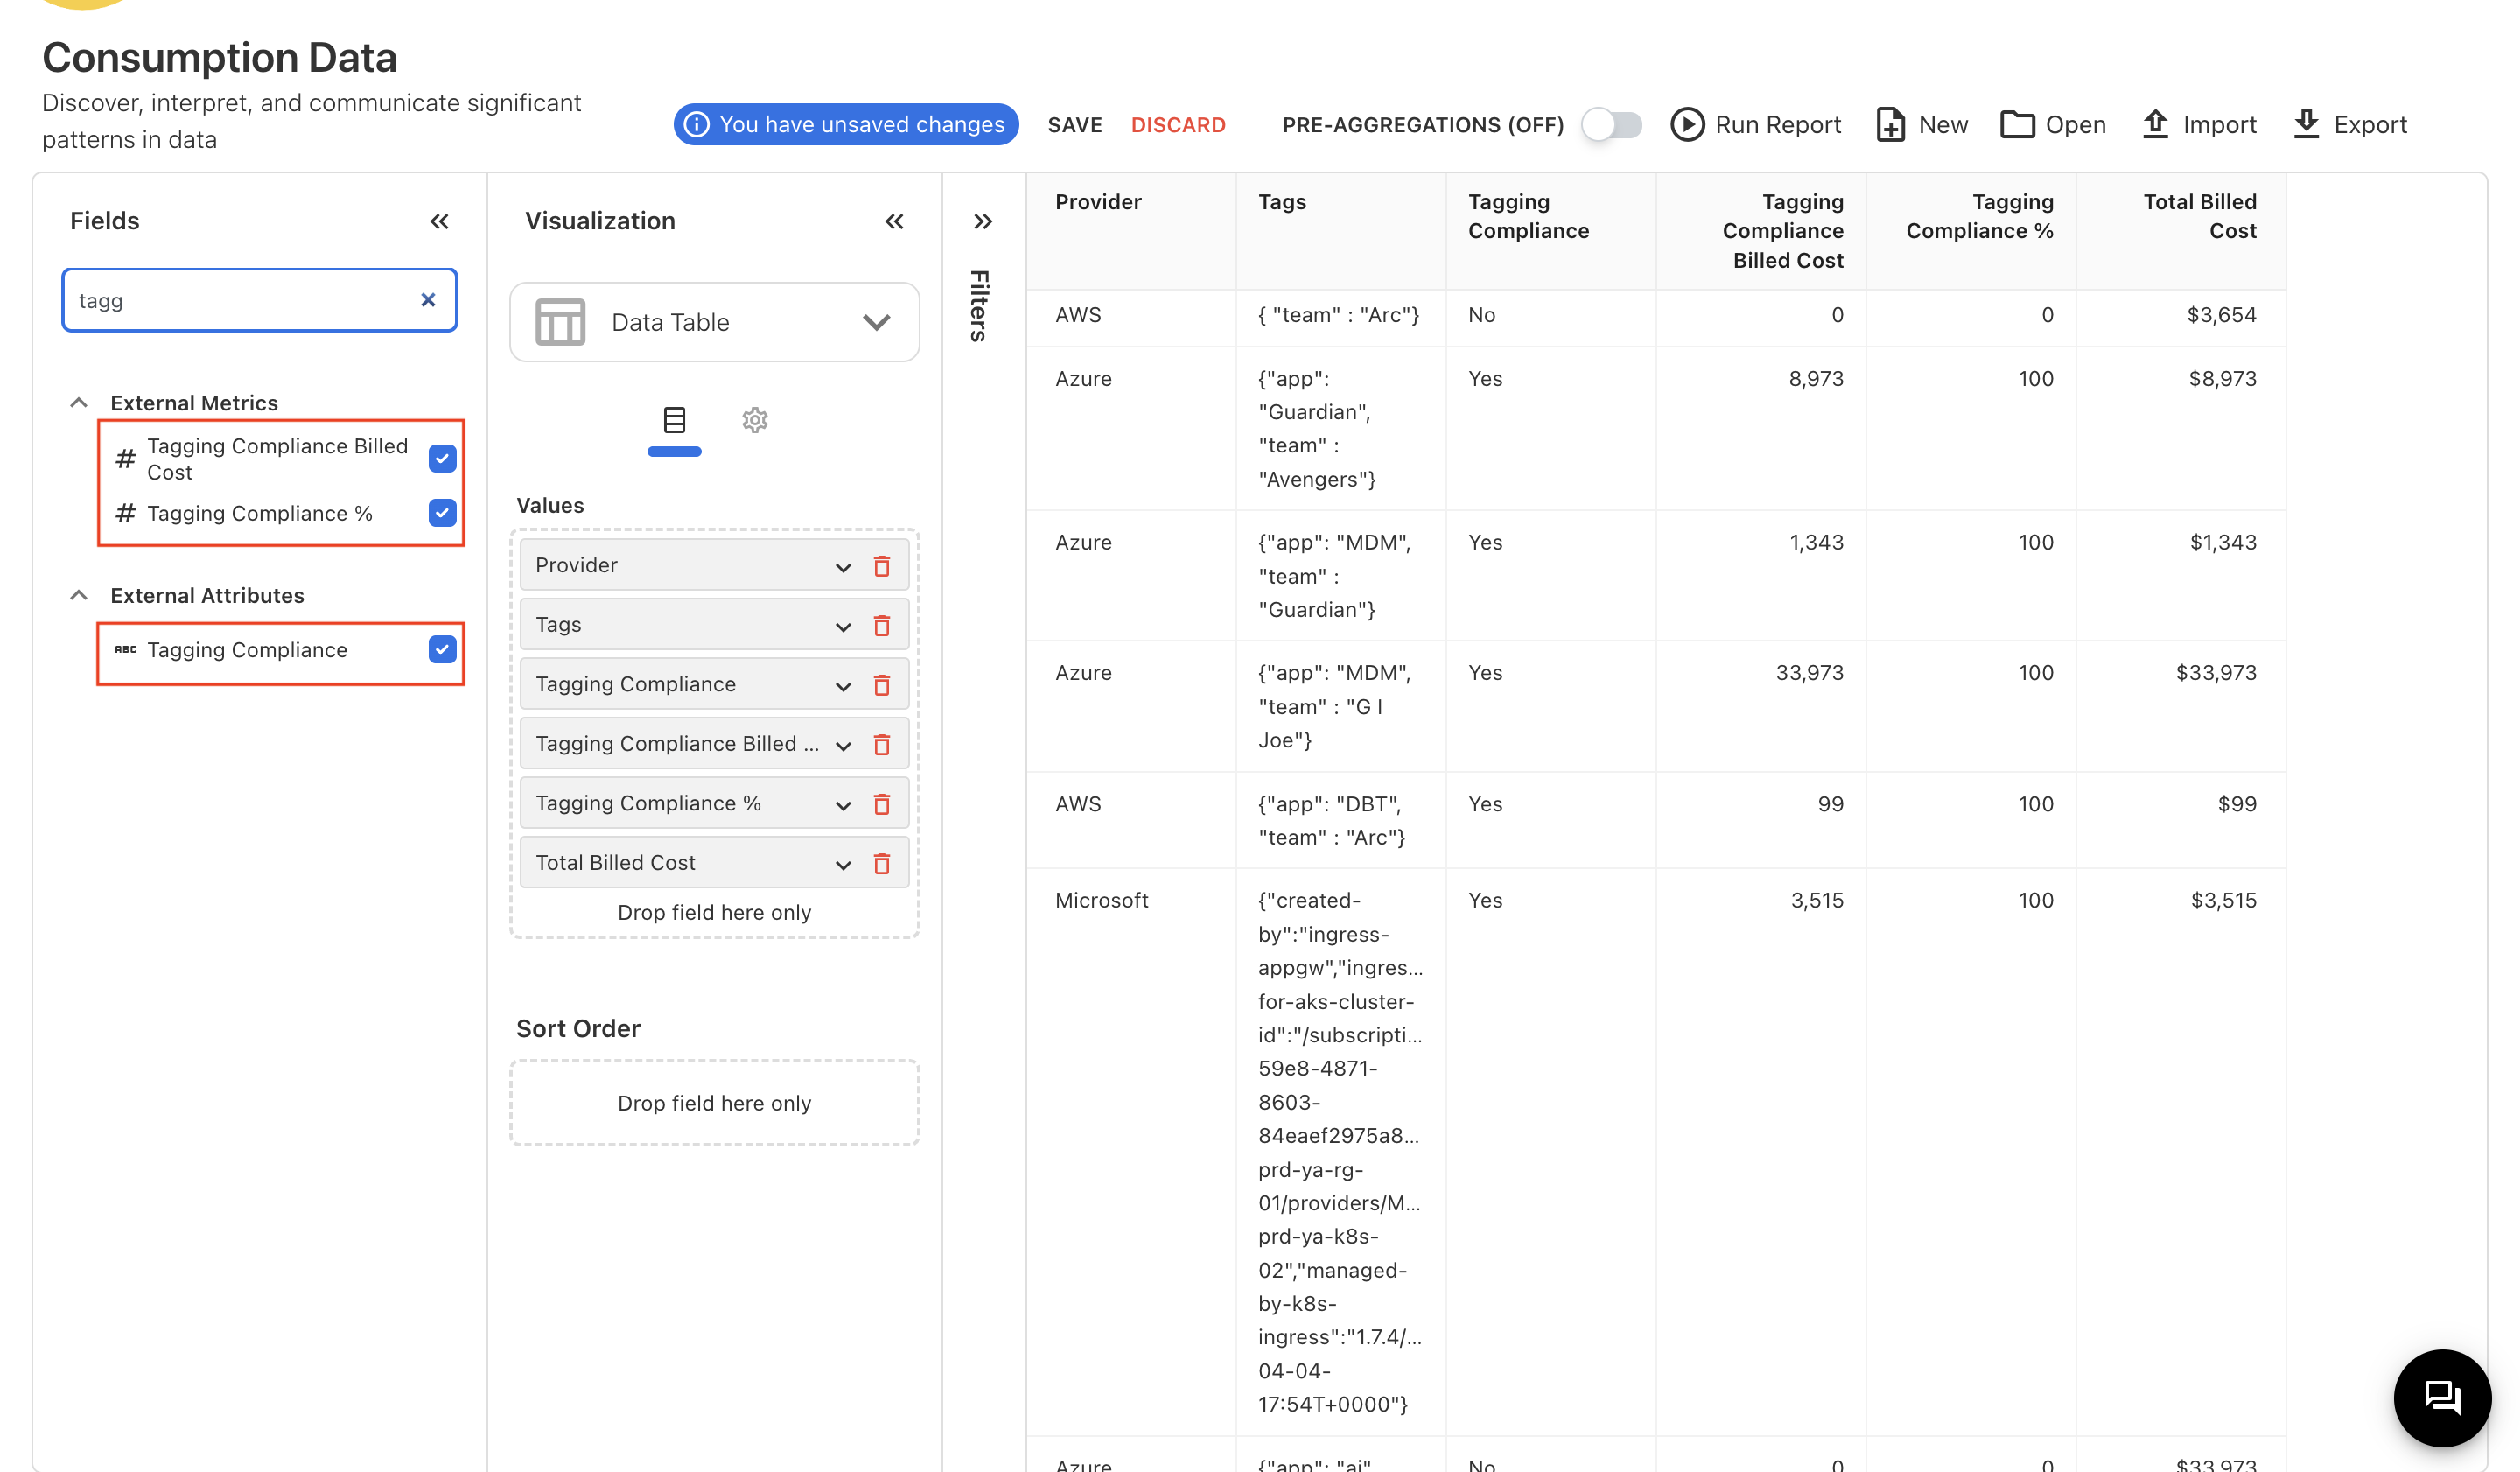
Cloud Consumption: Tagging Compliance
To support tagging compliance tracking in the cloud consumption data, a new field called Tagging Compliance is introduced. This field is now available to map during cloud data upload. Using this new field, users can define upload rules to automate tagging compliance by customizing the tagging rules or rely on the default application tag.
Additionally, we have enabled reporting to track tagging compliance through new fields in Analytics.
-
Tagging Compliance: Tagging compliance of selected resource.
-
Tagging Compliance Billed Cost: Total billed cost of tagged resources.
-
Tagging Compliance %: Percentage of tagged billed cost versus total billed cost.
Dropdown Filter Performance
To improve performance and user experience across standard dashboards and reports, dropdown filters are enhanced to support pagination. Previously, filters fetching datasets with thousands of records led to slow load times. With this enhancement, filters now load 50 records at a time, and a Show More option is provided to load additional values as needed. Moreover, the filter search works seamlessly by displaying search results through all records. This enhancement significantly improves filter response when navigating large datasets.

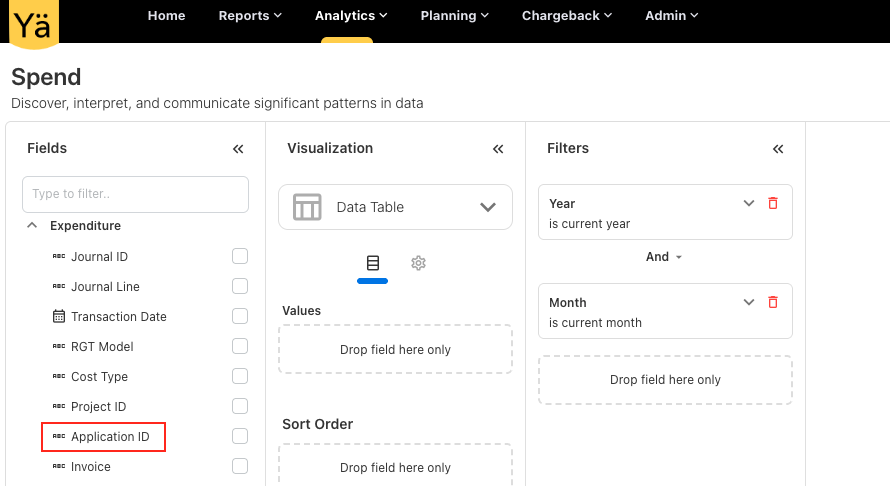
Application ID in Analytics and GL Transaction
The Application ID field is now exposed in the Spend cube (under Expenditure) and in the GL transactions across all dashboards except Platform-related dashboards.
May 12, 2025
Enhancements
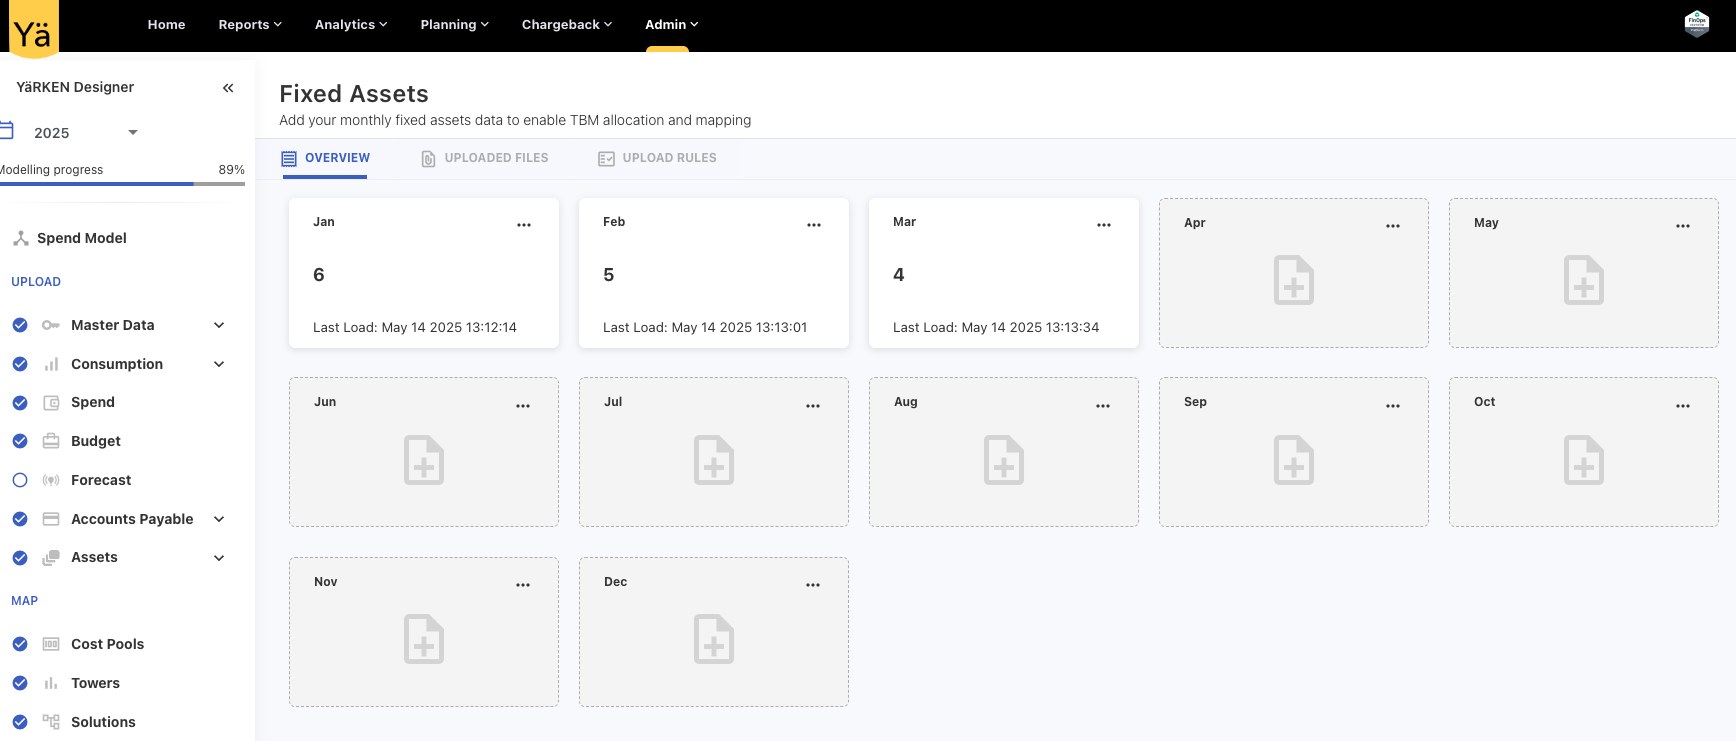
Fixed Asset: New Asset Type
A new asset type called Fixed Assets is introduced, which allows adding and managing monthly data specific to fixed assets. This new asset type helps in tracking long-term assets with reporting for fixed resources.
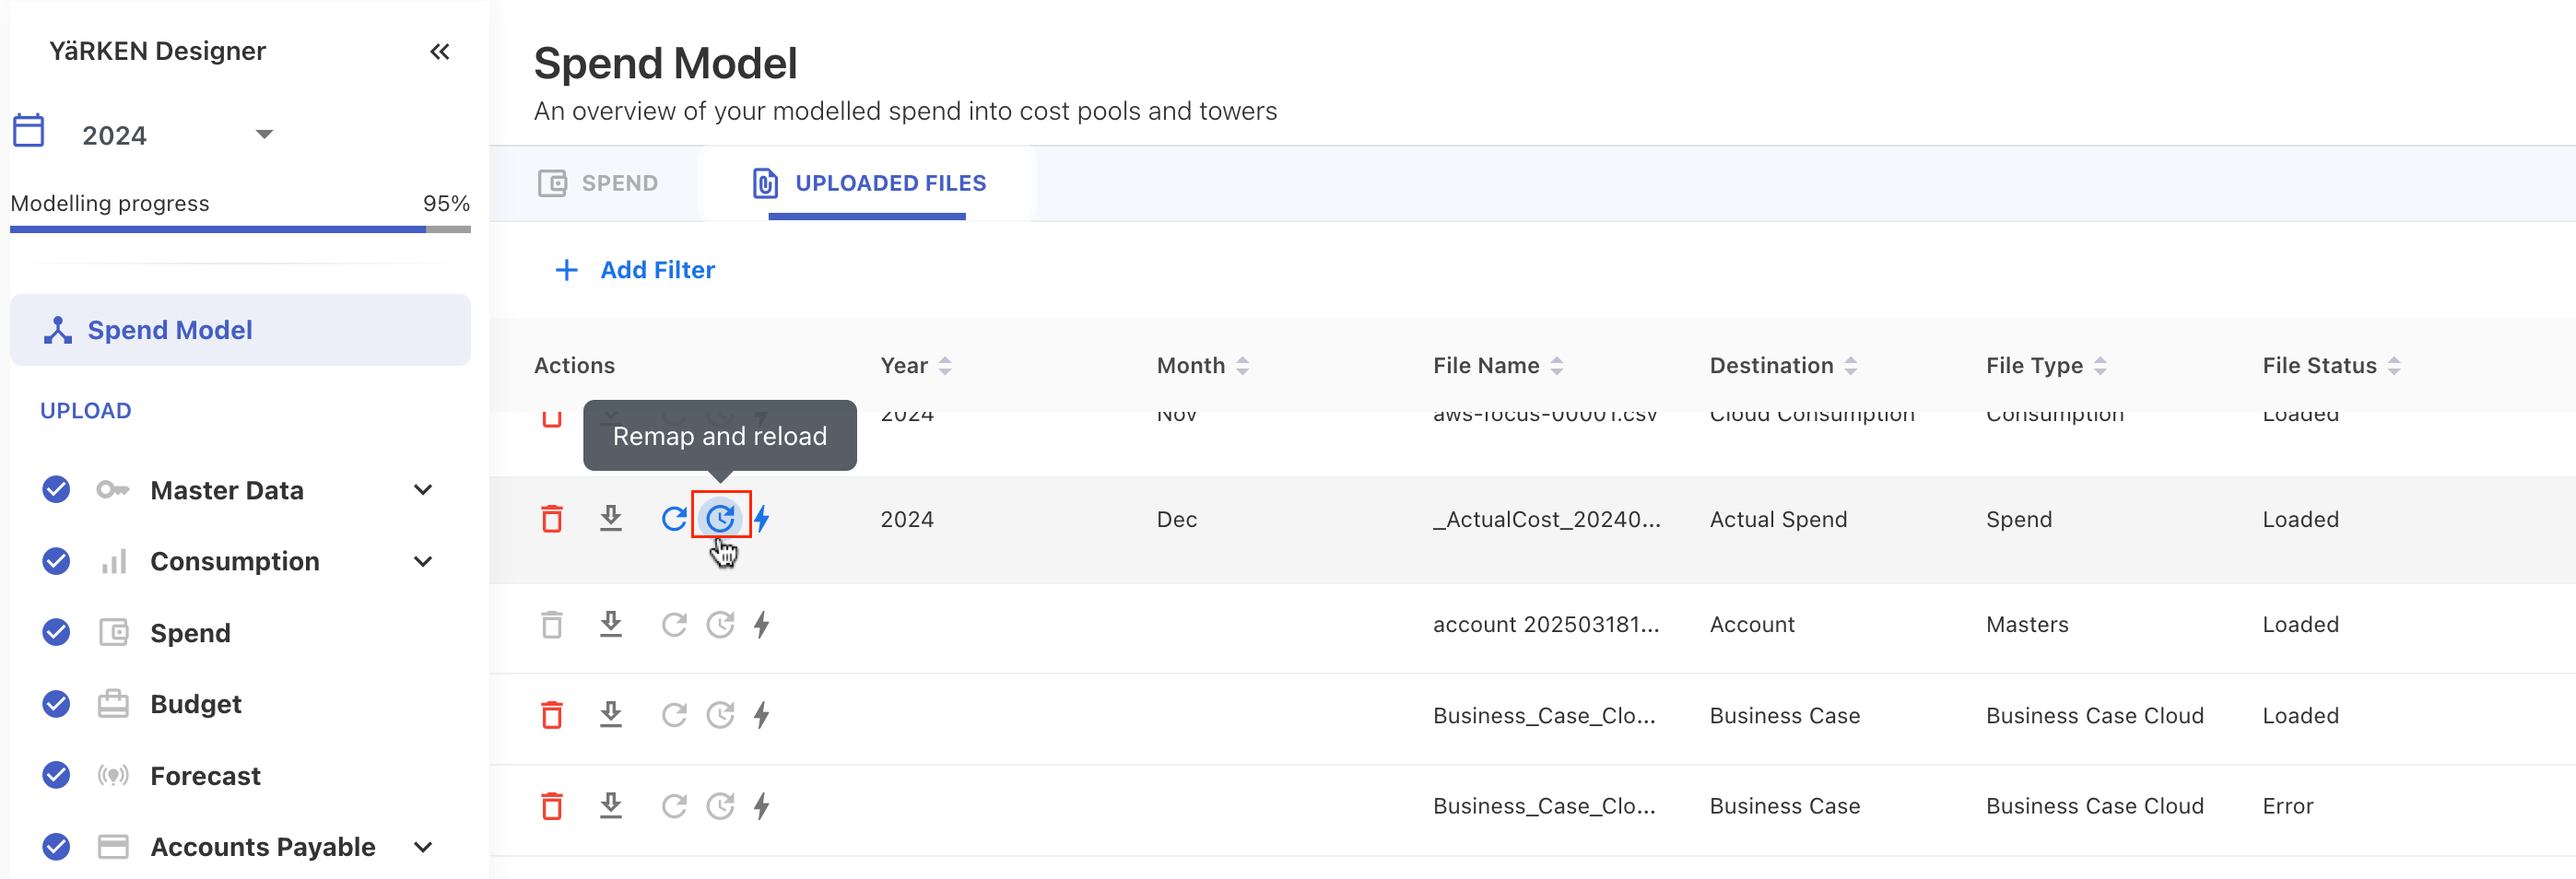
Remap and Reload Spend Files
The file reload behavior for spend data is significantly improved in the application. Previously, when reloading an existing file, the system reused the same mapping fields automatically without offering an option to modify them. With the new updates, a new Remap and reload capability is enabled on UPLOADED FILES section that allows users to reupload the file with the ability to edit or update the mapping fields before processing.
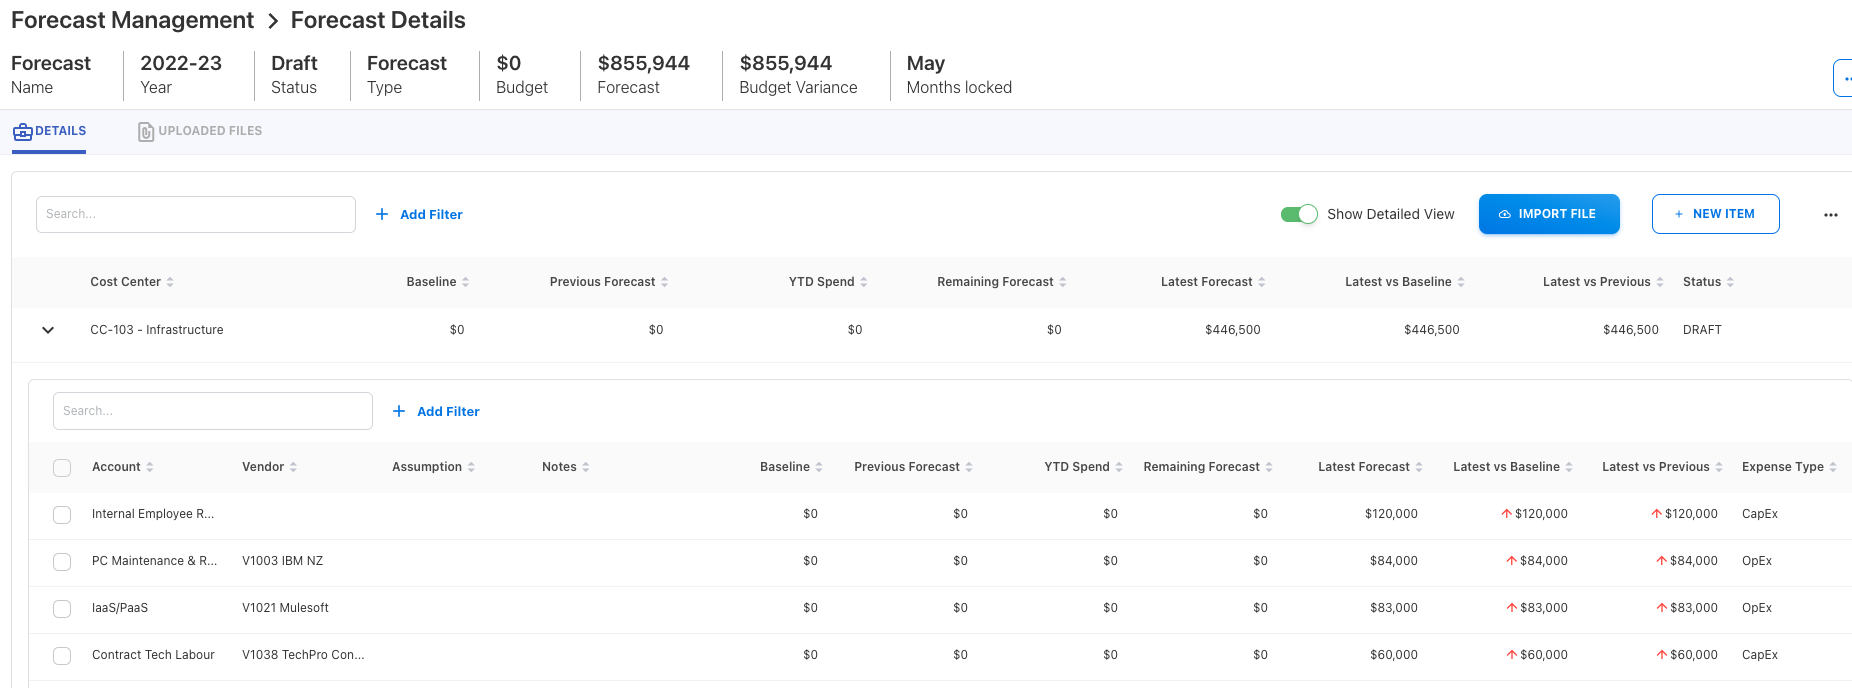
Budget and Forecast Management Column Updates
Following updates are made in the forecasting and budgeting view:
-
Expense Type: The column is now hidden by default and can be viewed by enabling the Show Detailed View toggle button.
New columns added
-
Baseline: Displays the baseline amount sourced from Cost Transparency (CT).
-
Latest vs Baseline: Shows the variance between the latest forecast and the baseline value.
Renamed forecast columns:
-
Budget -> Previous Forecast
-
Remaining Budget -> Remaining Forecast
-
Forecast -> Latest Forecast
-
Variance -> Latest vs Previous
May 05, 2025
Enhancements
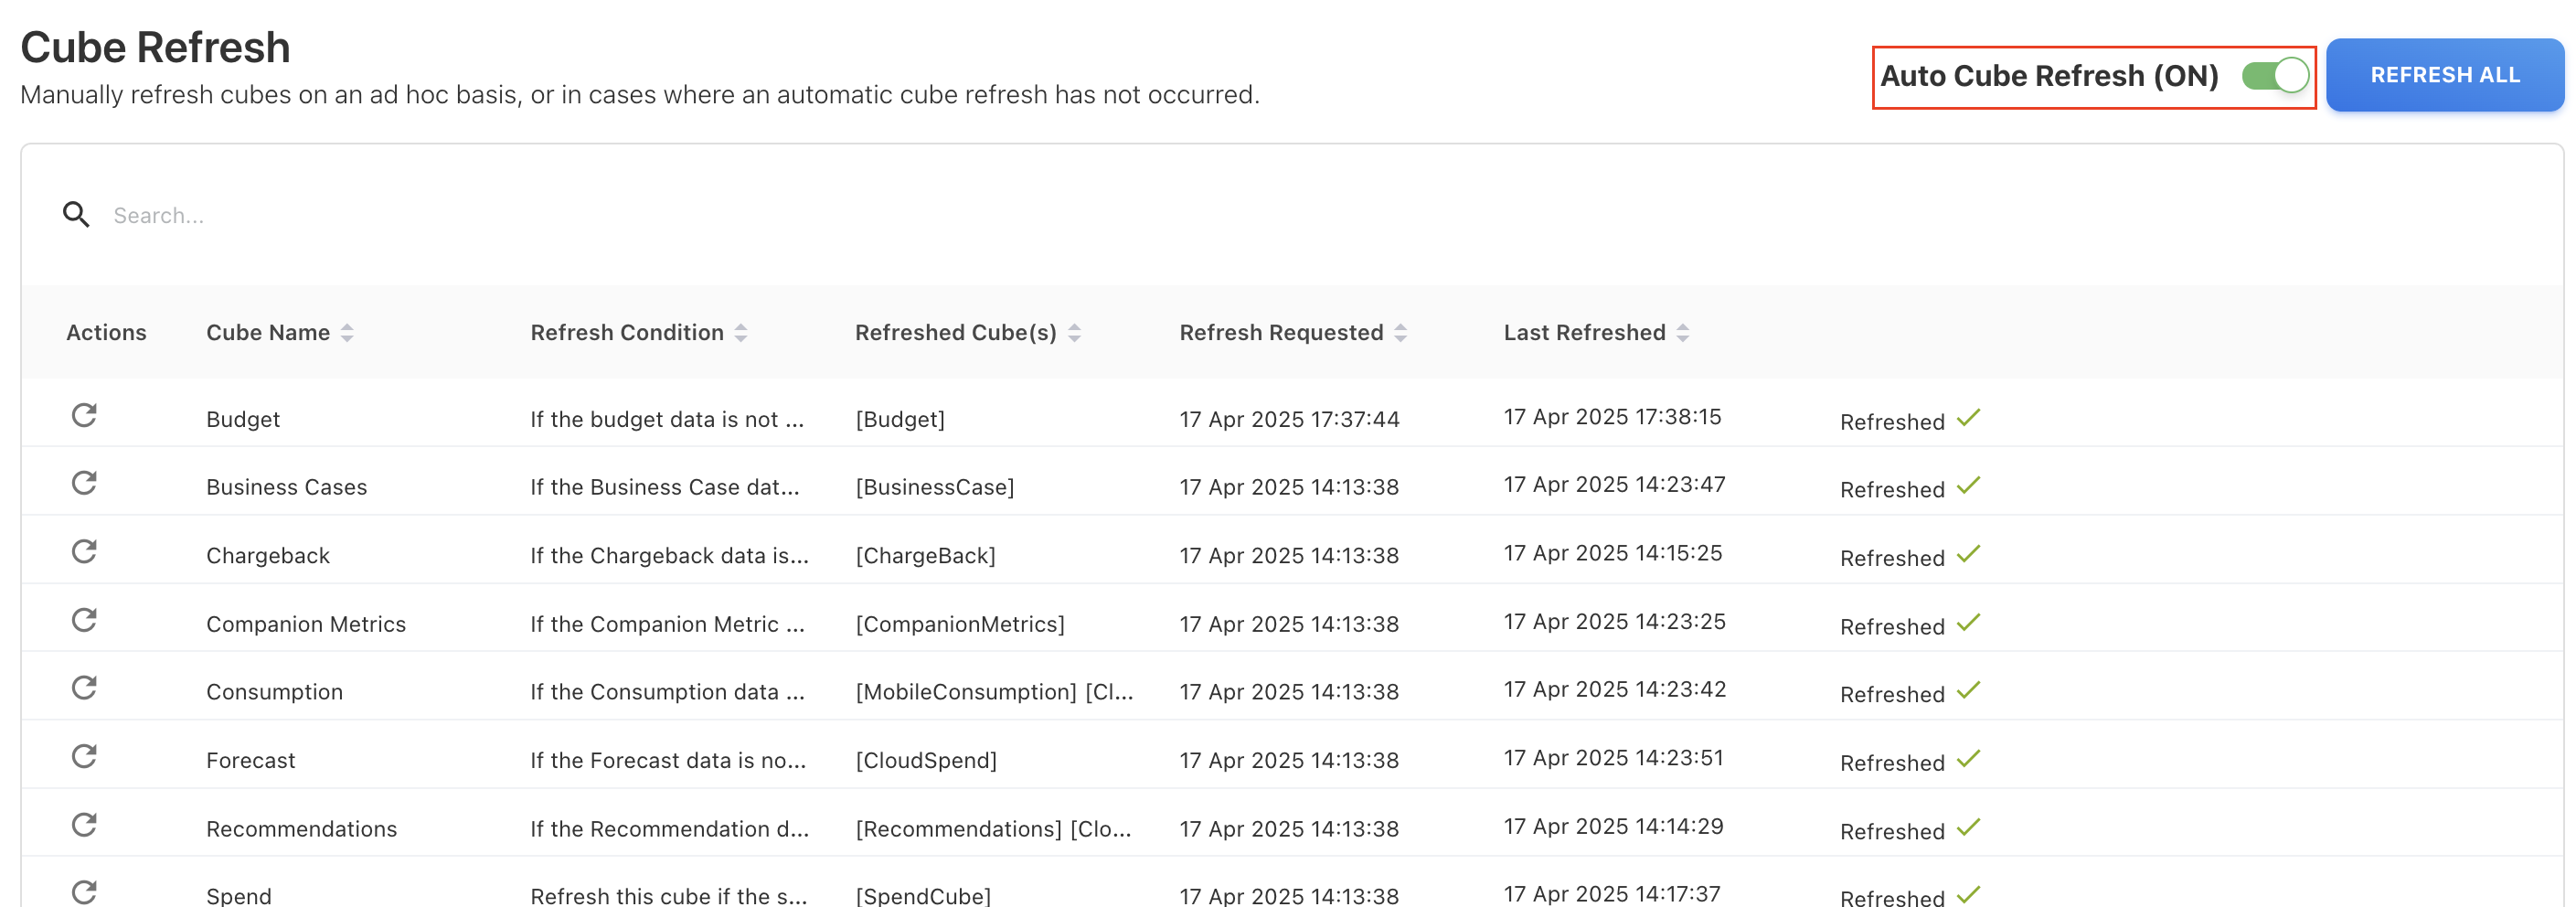
Cube Refresh Enhancements
Cube Granularity
We have enhanced the cube refresh capability to provide better visibility and control in managing cube refresh operations.
-
Detailed Cube Listing: Instead of summarizing cubes, the UI now displays each cube at its actual granularity—Cube, Aggregation, and Partition.
-
All cube availability: The Cube Refresh page lists all available cubes explicitly.
-
Manual refresh option: Users now have the ability to refresh cubes at a more granular level. This means specific cube partitions can be refreshed independently without triggering a full cube refresh.
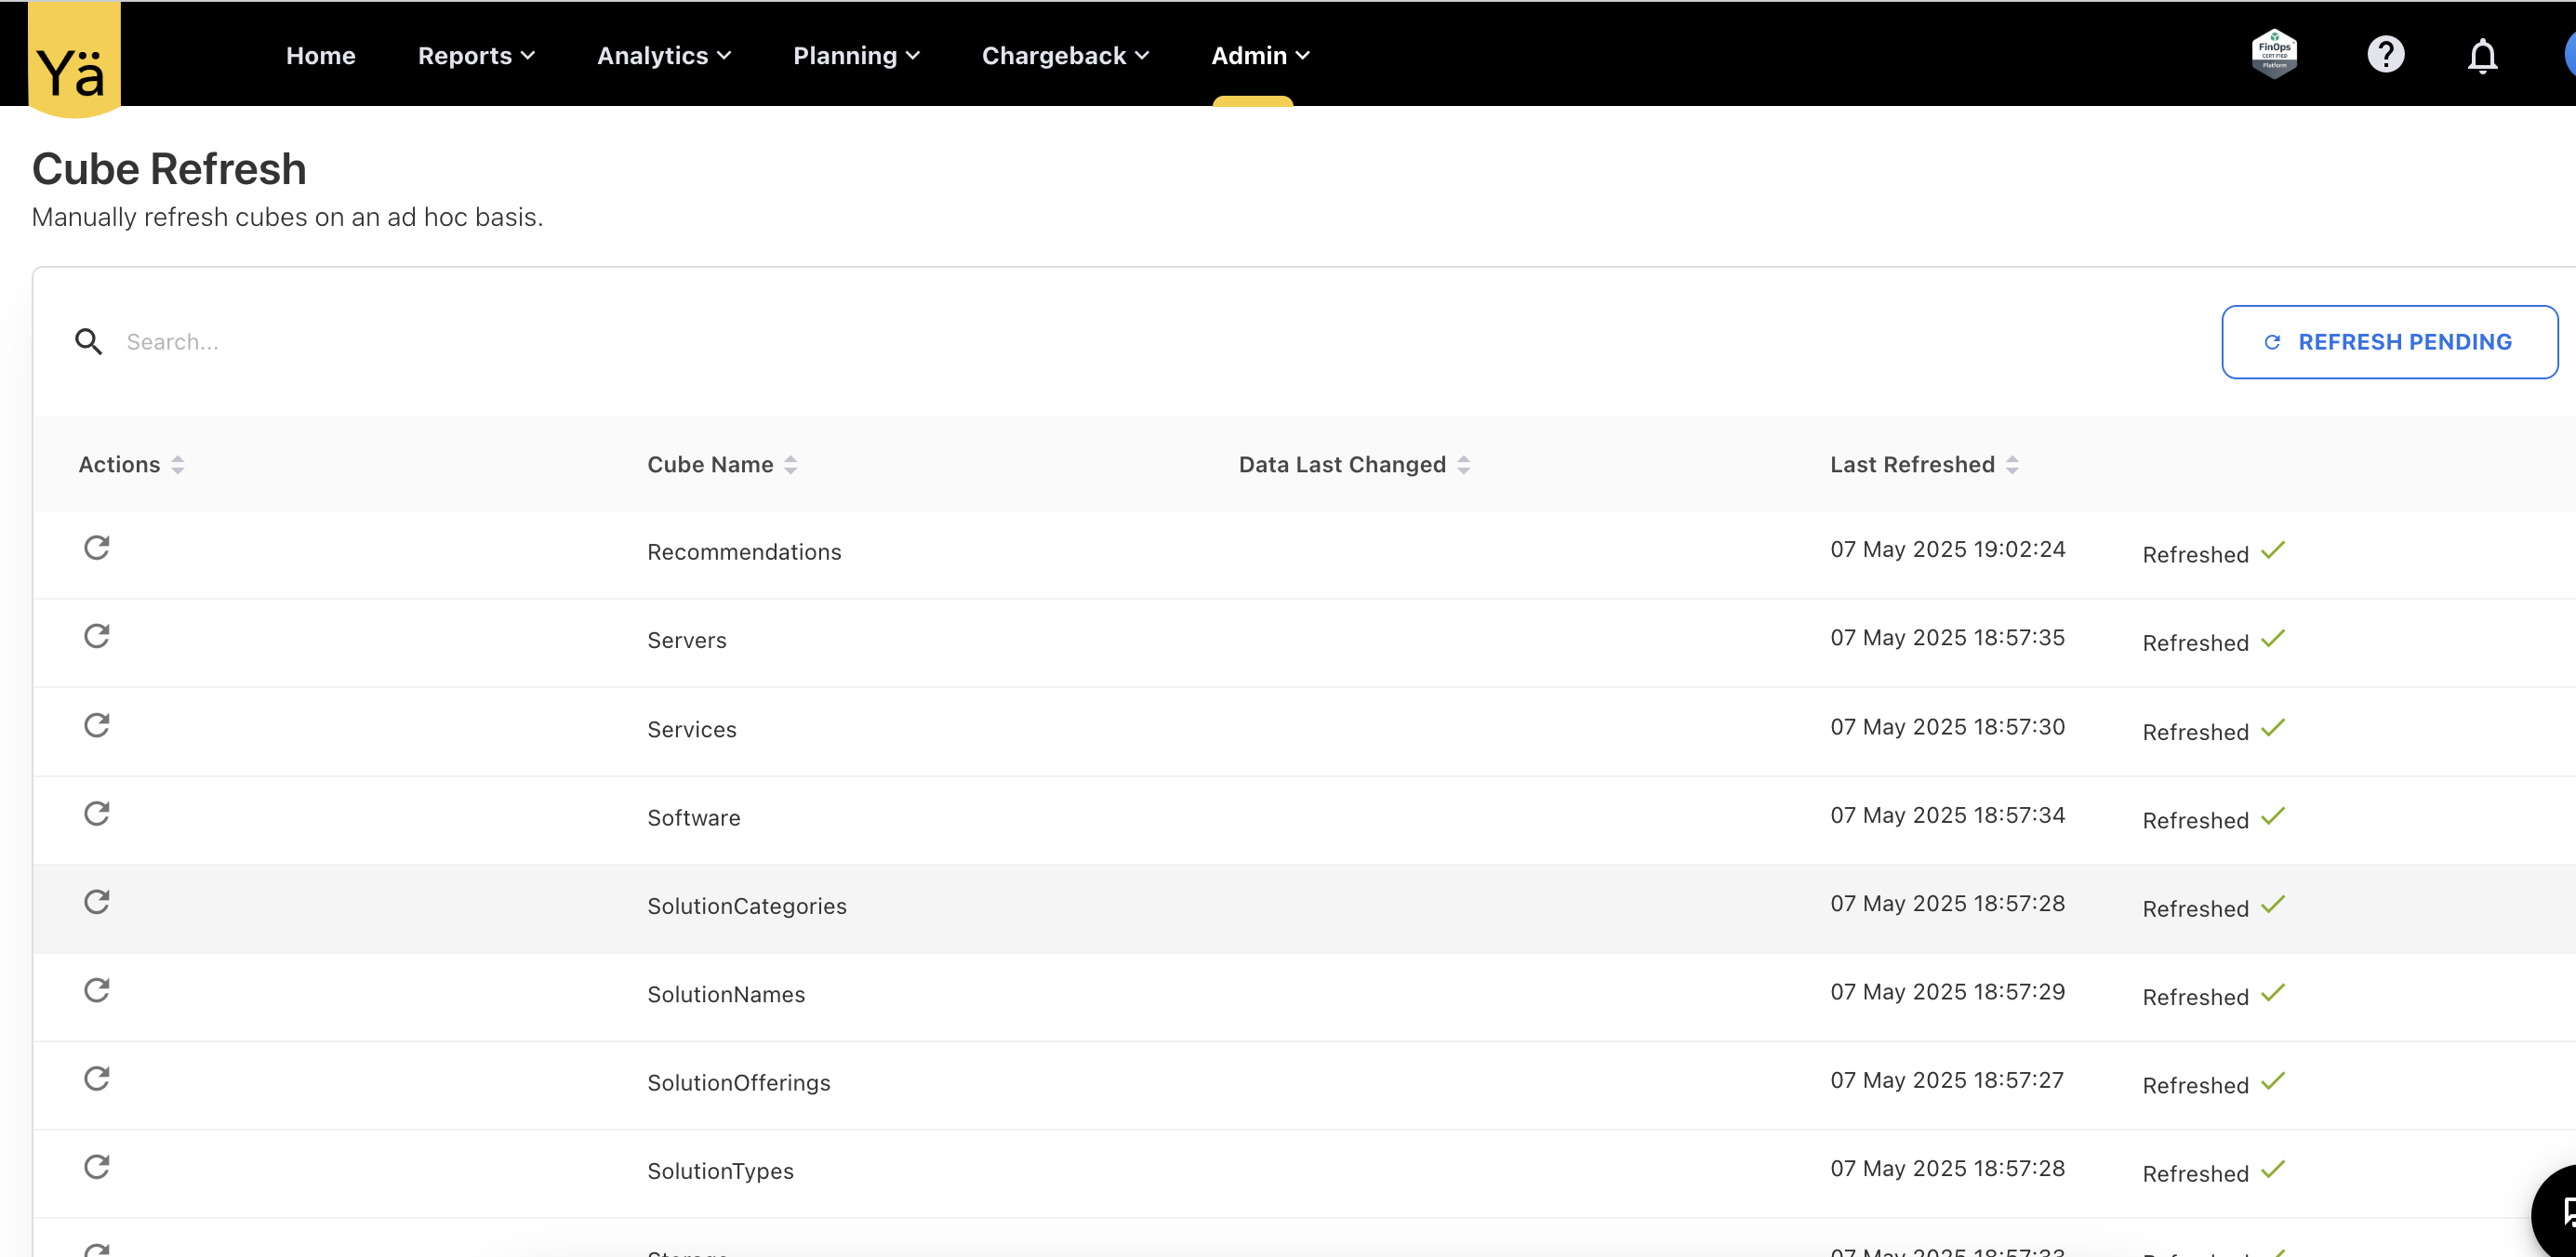
Cube Refresh Behaviour
The cube refresh behaviour is modified to manage the system performance more efficiently. Auto cube refresh is now paused immediately after a data change, and corresponding dependent cubes move to pending status, indicating that new or updated data has not yet been processed. Users must manually refresh the pending cubes to reflect the latest data changes or wait for the system to auto-refresh them after 24 hours. Any cube in a pending state will not reflect the latest data in dashboards, reports, or analytics.
User can manually refresh individual cubes directly from the screen or choose to refresh all pending cubes at once.
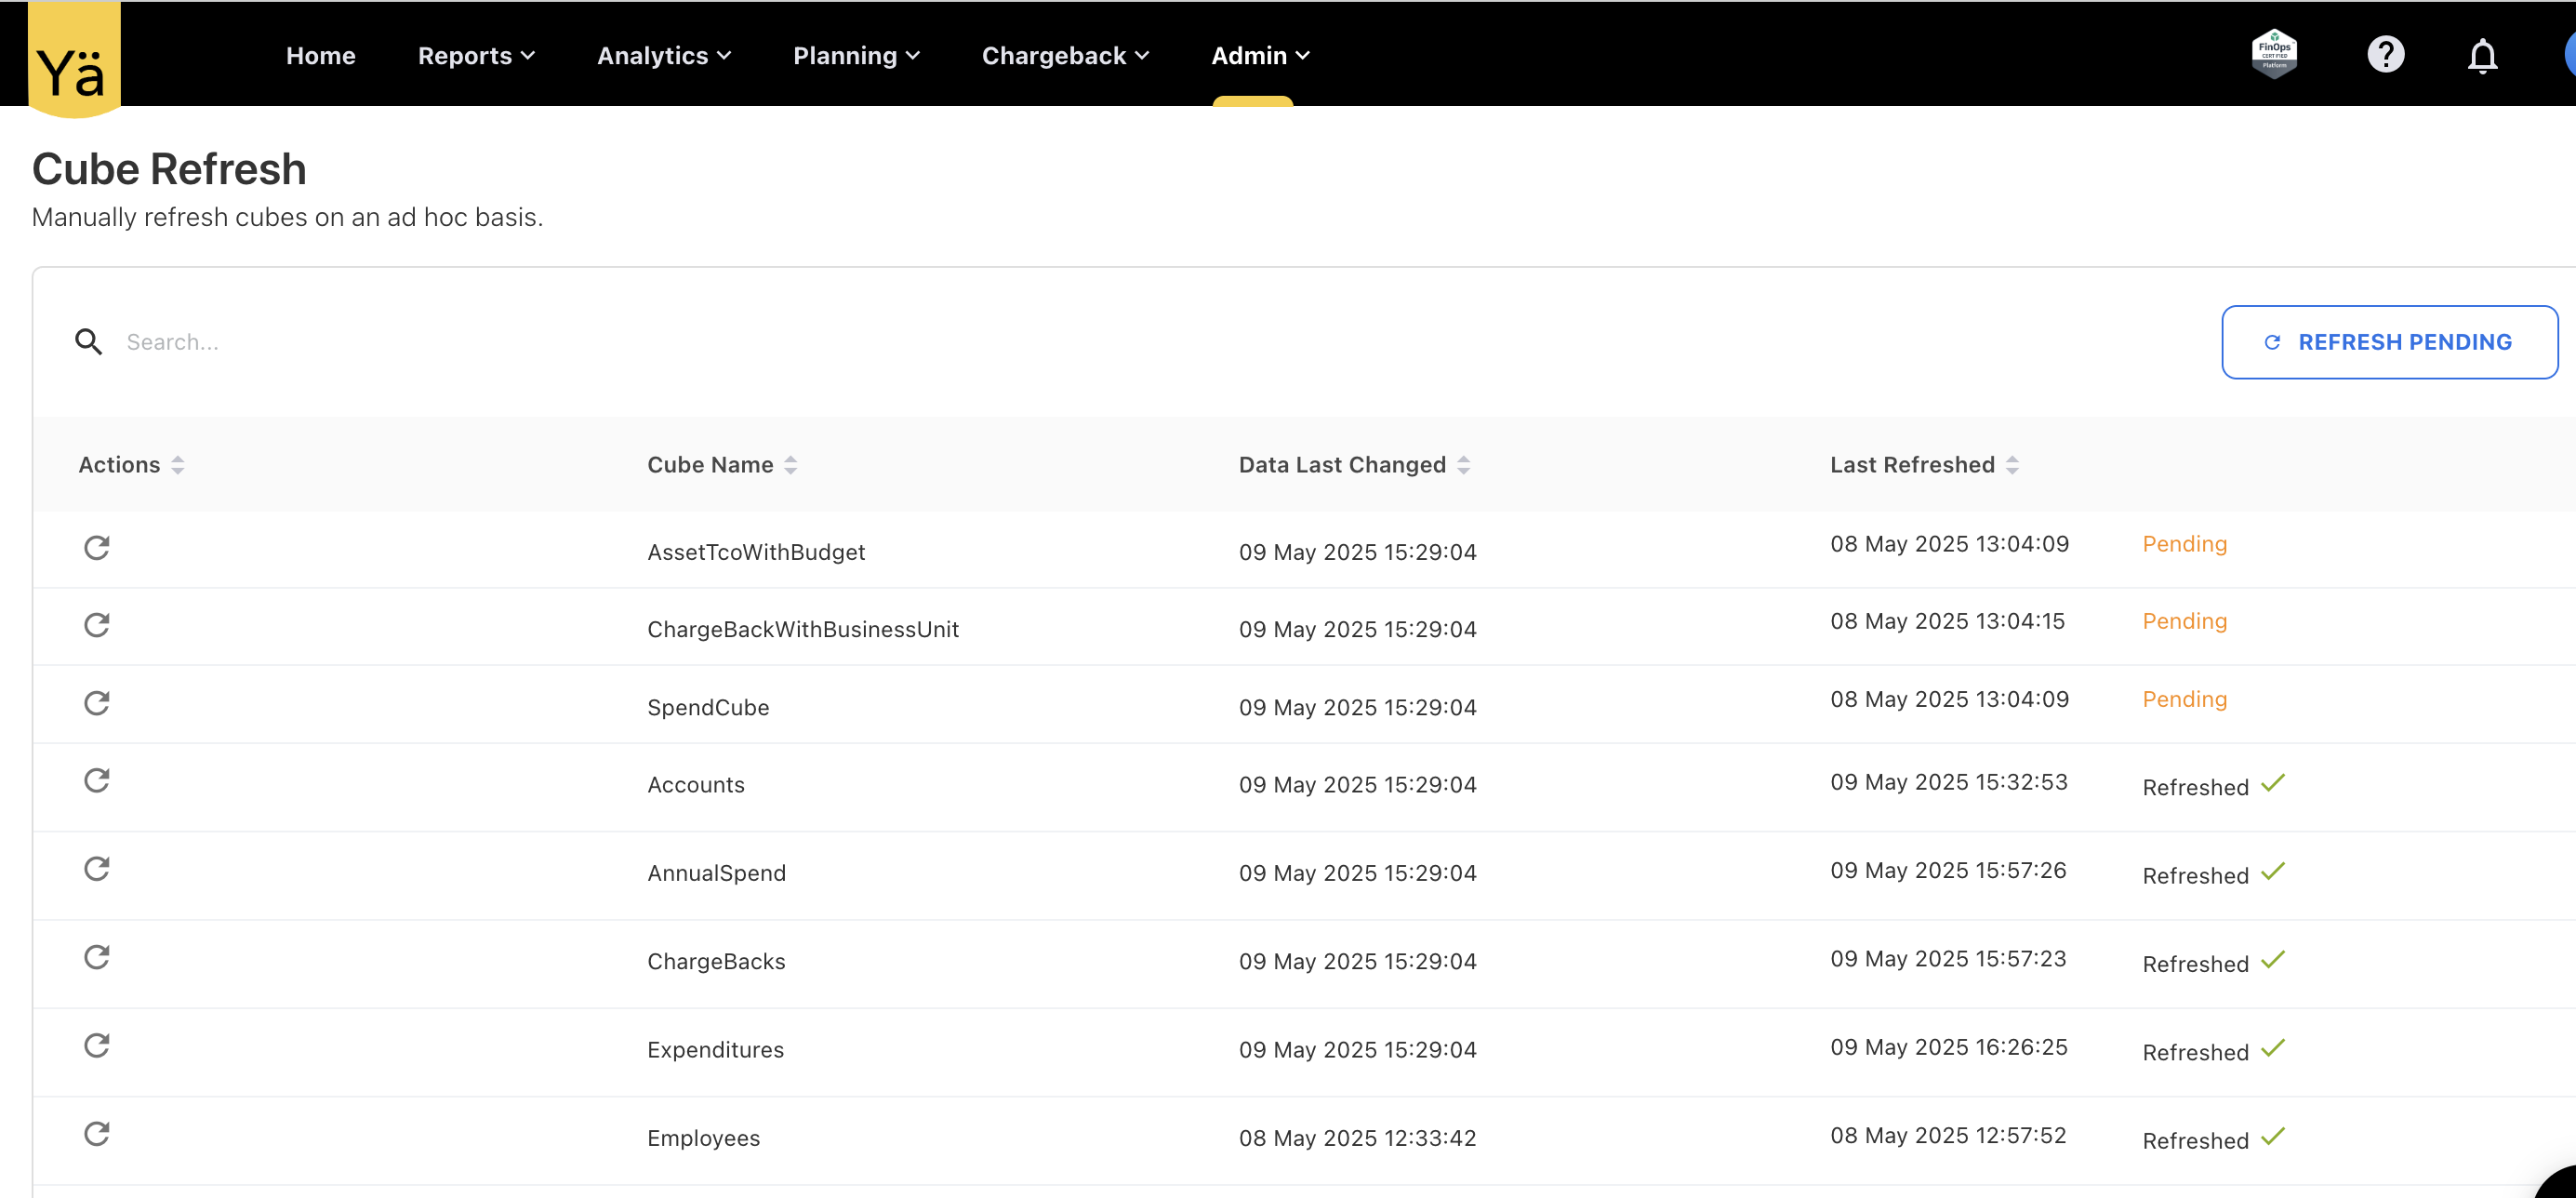
New columns in the Cube Refresh page:
-
Data Last Changed: Displays the most recent date when data was updated in the corresponding cube.
-
Last Refresh Date: Indicates the last time the cube was refreshed (sourced from the cube API).
This change gives more control over cube refresh operations and helps avoid unnecessary system loads.
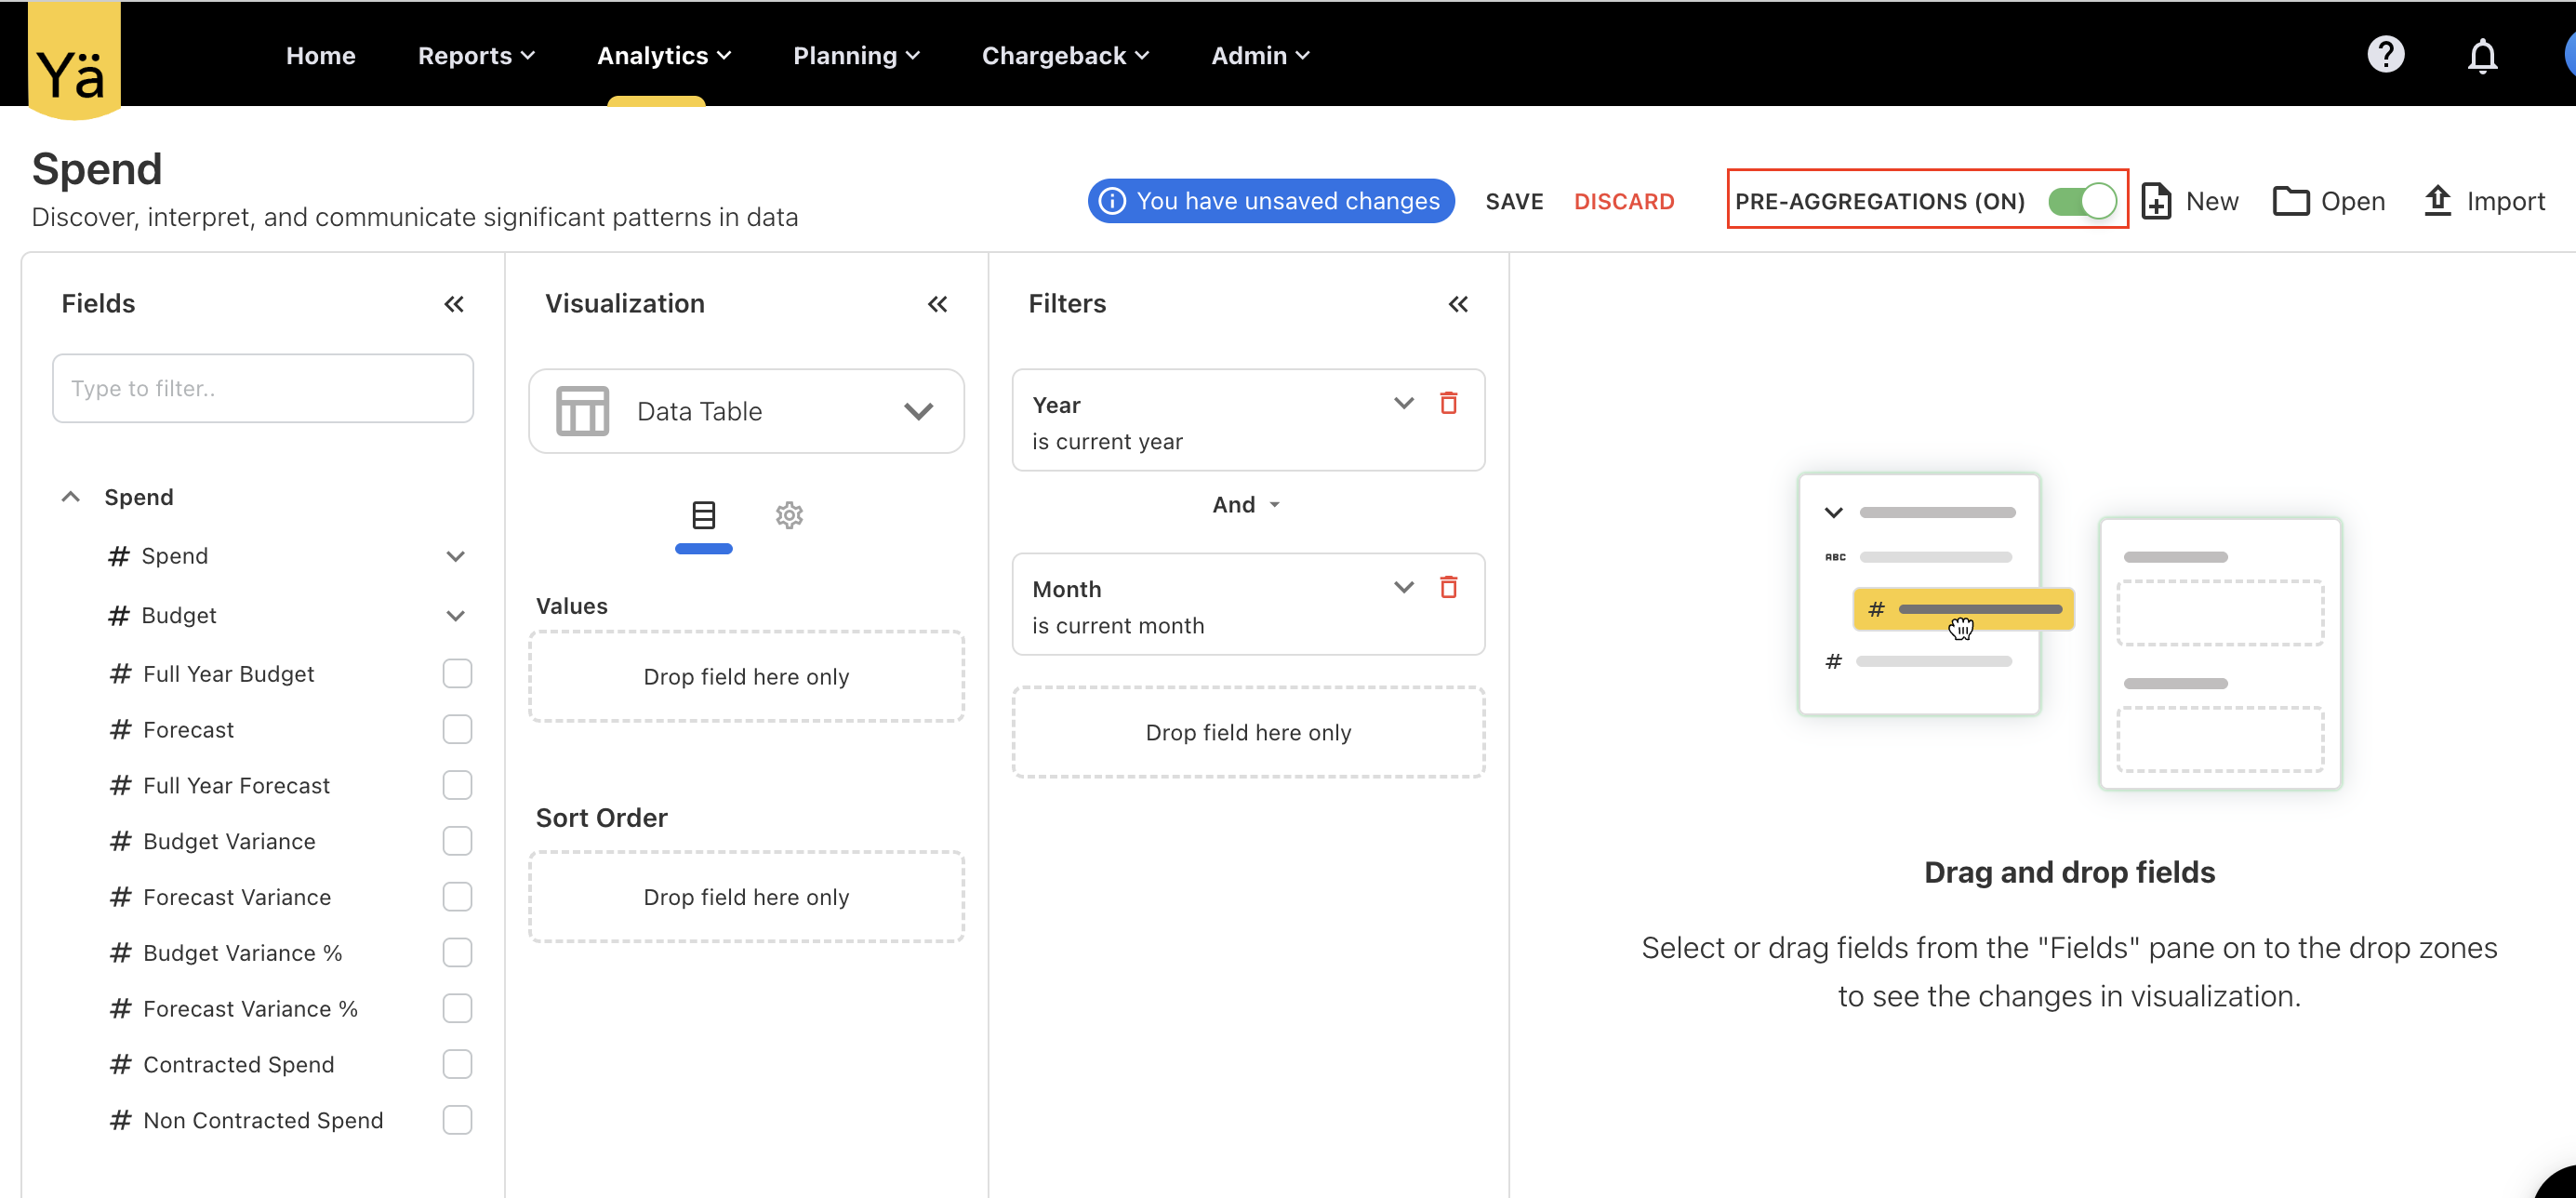
Pre-Aggregation Toggle in Analytics for Admin
A new PRE-AGGREGATIONS toggle button is added in the Analytics section for Admin users to control pre-aggregation behavior. When enabled, this setting allows admins to view the most recently updated or edited data from the cube directly, without requiring a manual refresh—ensuring quicker access to aggregated data.
When the toggle is turned off, data is fetched from the underlying database, which may not include the latest changes until the cube is refreshed.
Admin Role Enhancement: Full Access to Budget and Chargeback Features
The Admin role now includes full access to all budget and chargeback-related activities by default, without requiring any additional specific roles.
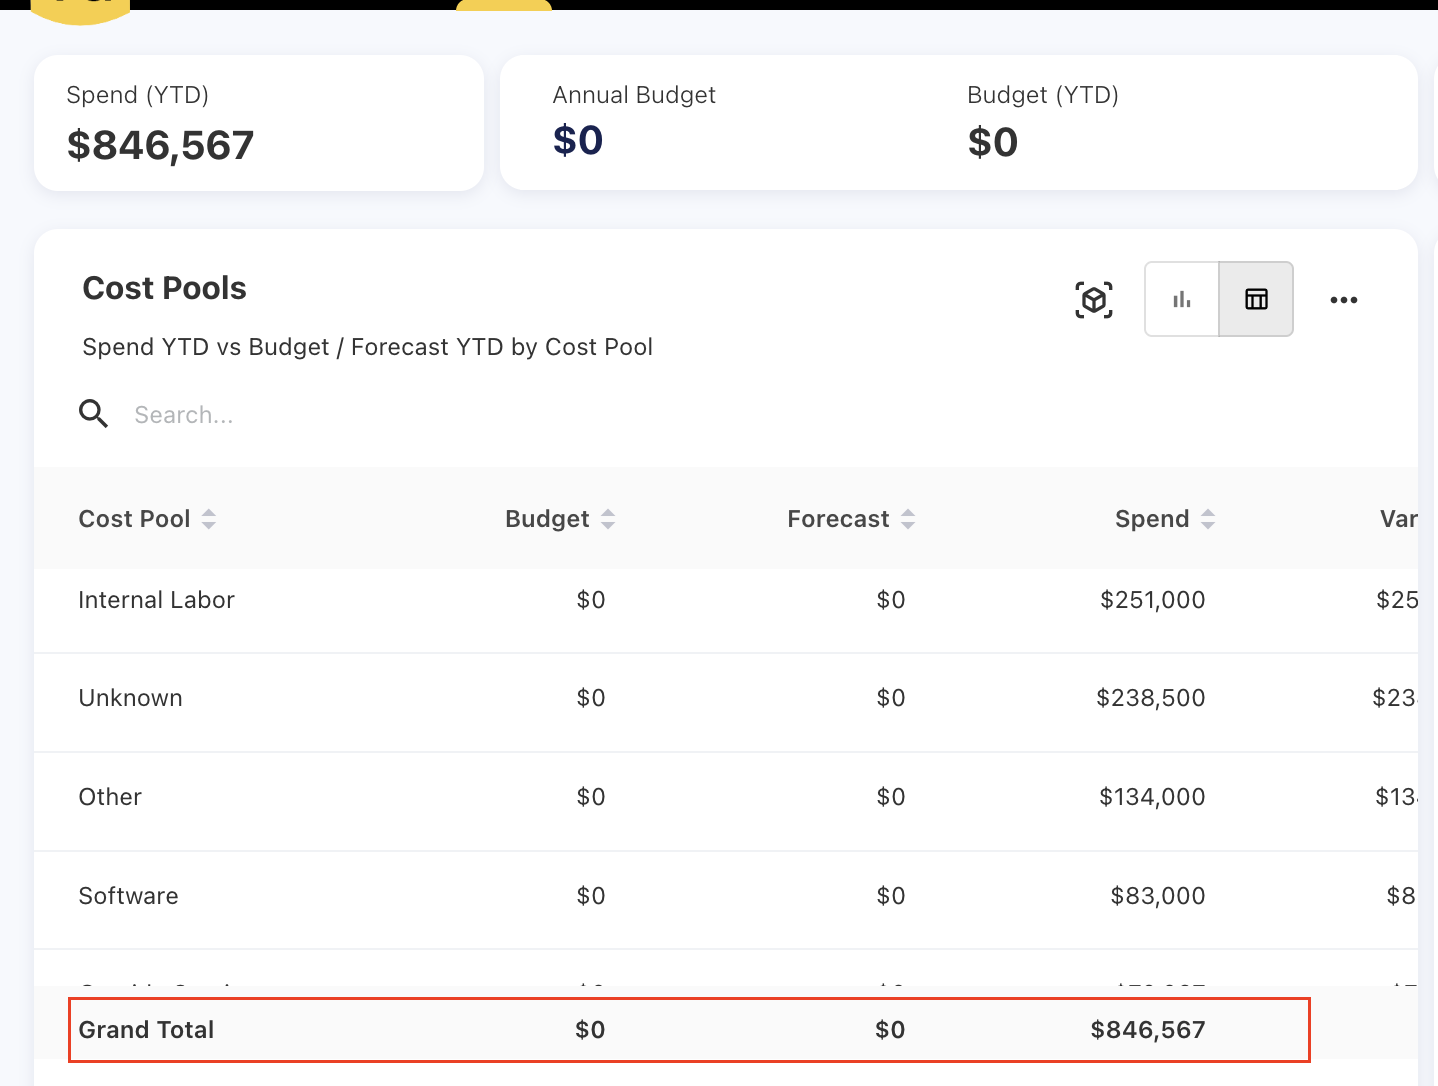
Grand Total Row in Table View
The table view for spend, forecast, and budget now includes a new Grand Total row. When users switch the data view of charts in reports or dashboards to the table format, a Grand Total row now appears at the bottom that calculates the total values across the columns.
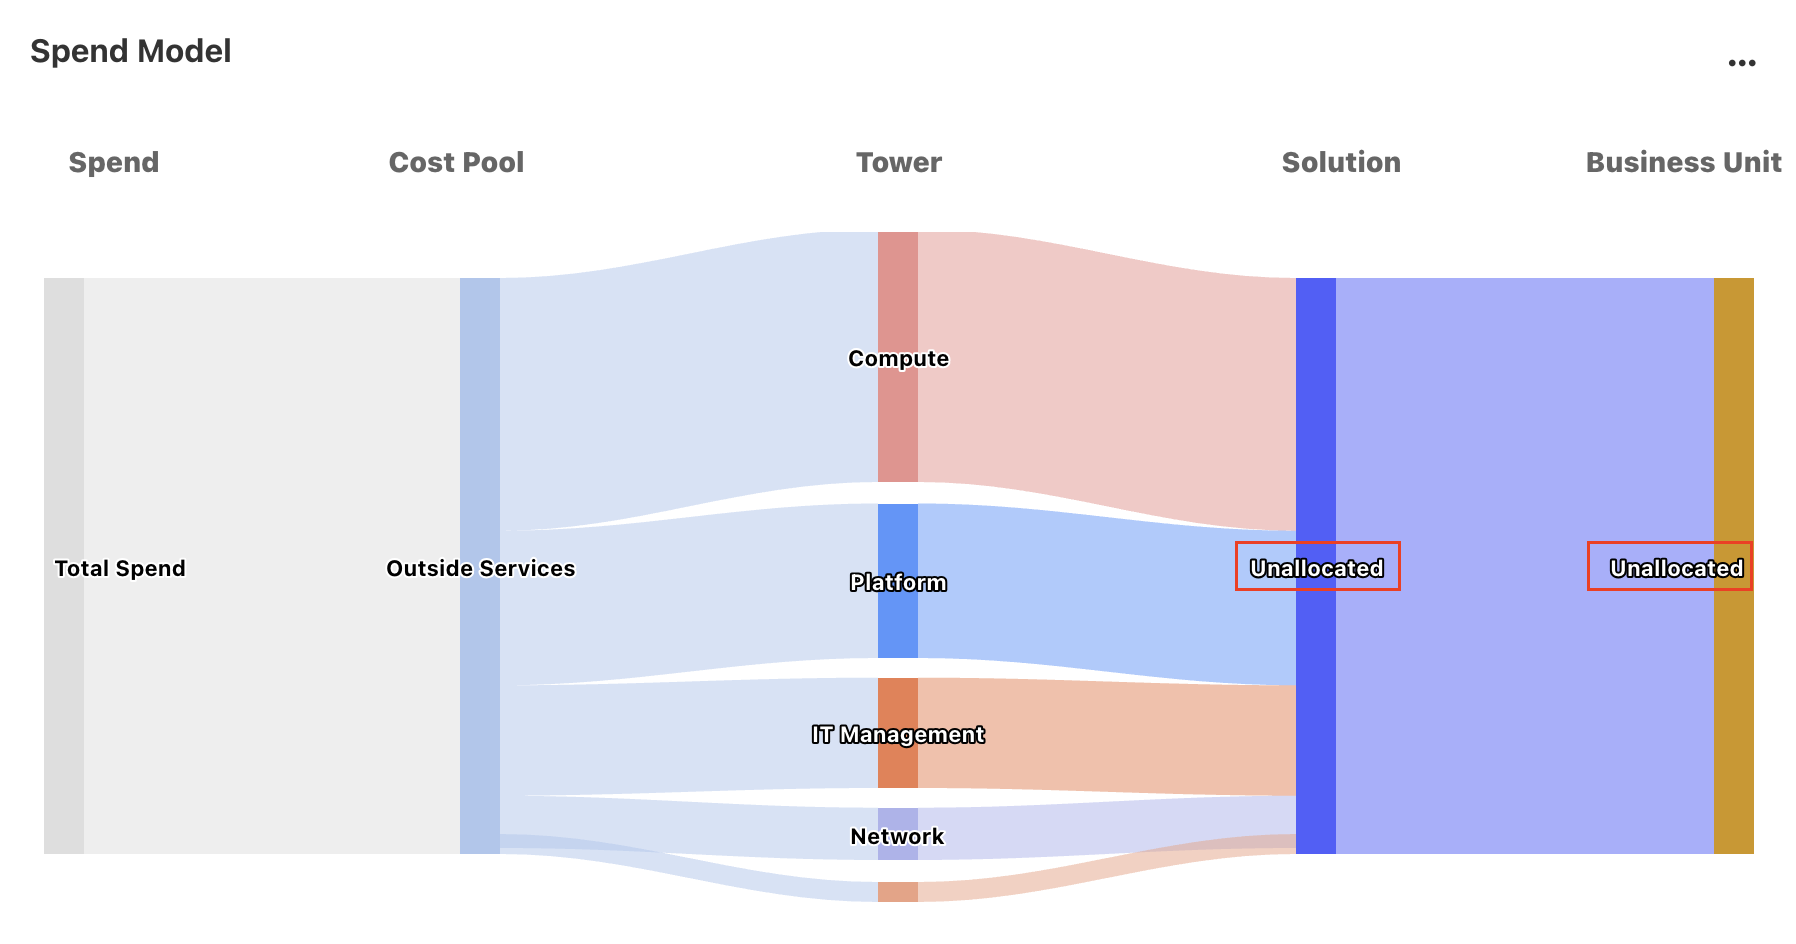
Null Handling on Sankey Chart
Null values previously appearing in the Sankey chart have now been addressed. When a TBM element is missing or undefined, the chart will now display the label Unallocated in place of null.
Scrollbar Overlap Issue Fixed
Resolved a scrollbar issue where the horizontal scrollbar overlapped the content in the last row of tabular data. Users were unable to view the bottom row while hovering to scroll left or right. With this fix, the scrollbar no longer blocks the last row view.
April 28, 2025
Enhancements
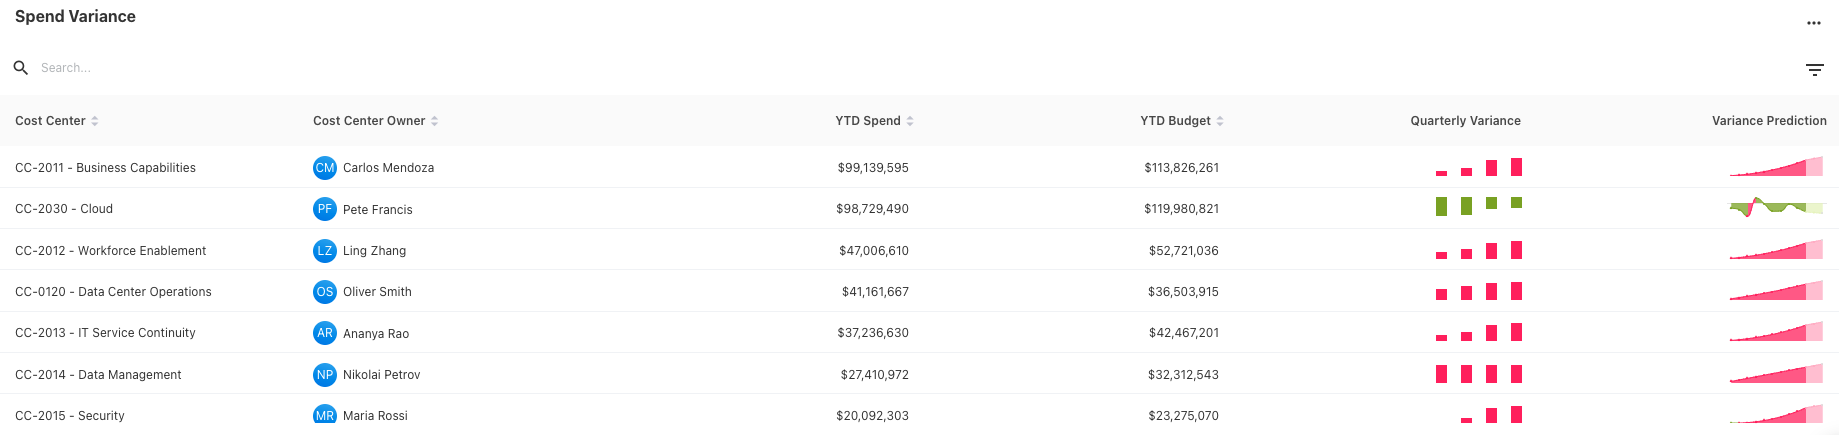
Cost Center Owner Report - Spend Variance Prediction
The Quarterly Variance and Variance Prediction columns from the Spend Variance chart are now color-coded.
-
Positive variance is shown in red
-
Negative variance is shown in green
Previously, these charts used a single color (blue) for all variance values.
Cost Pool or Tower Rules Priority for Cloud
Cost pool or tower rules for the cloud will take negative priority values and will not conflict with GL-based rules, whose priority is restricted to positive numbers.
Load Format - Number with Commas
The application now supports number and currency values with commas (e.g., 1,000 or $2,500.75) when uploading files. Previously, such formatted values were not correctly parsed and were treated as null.
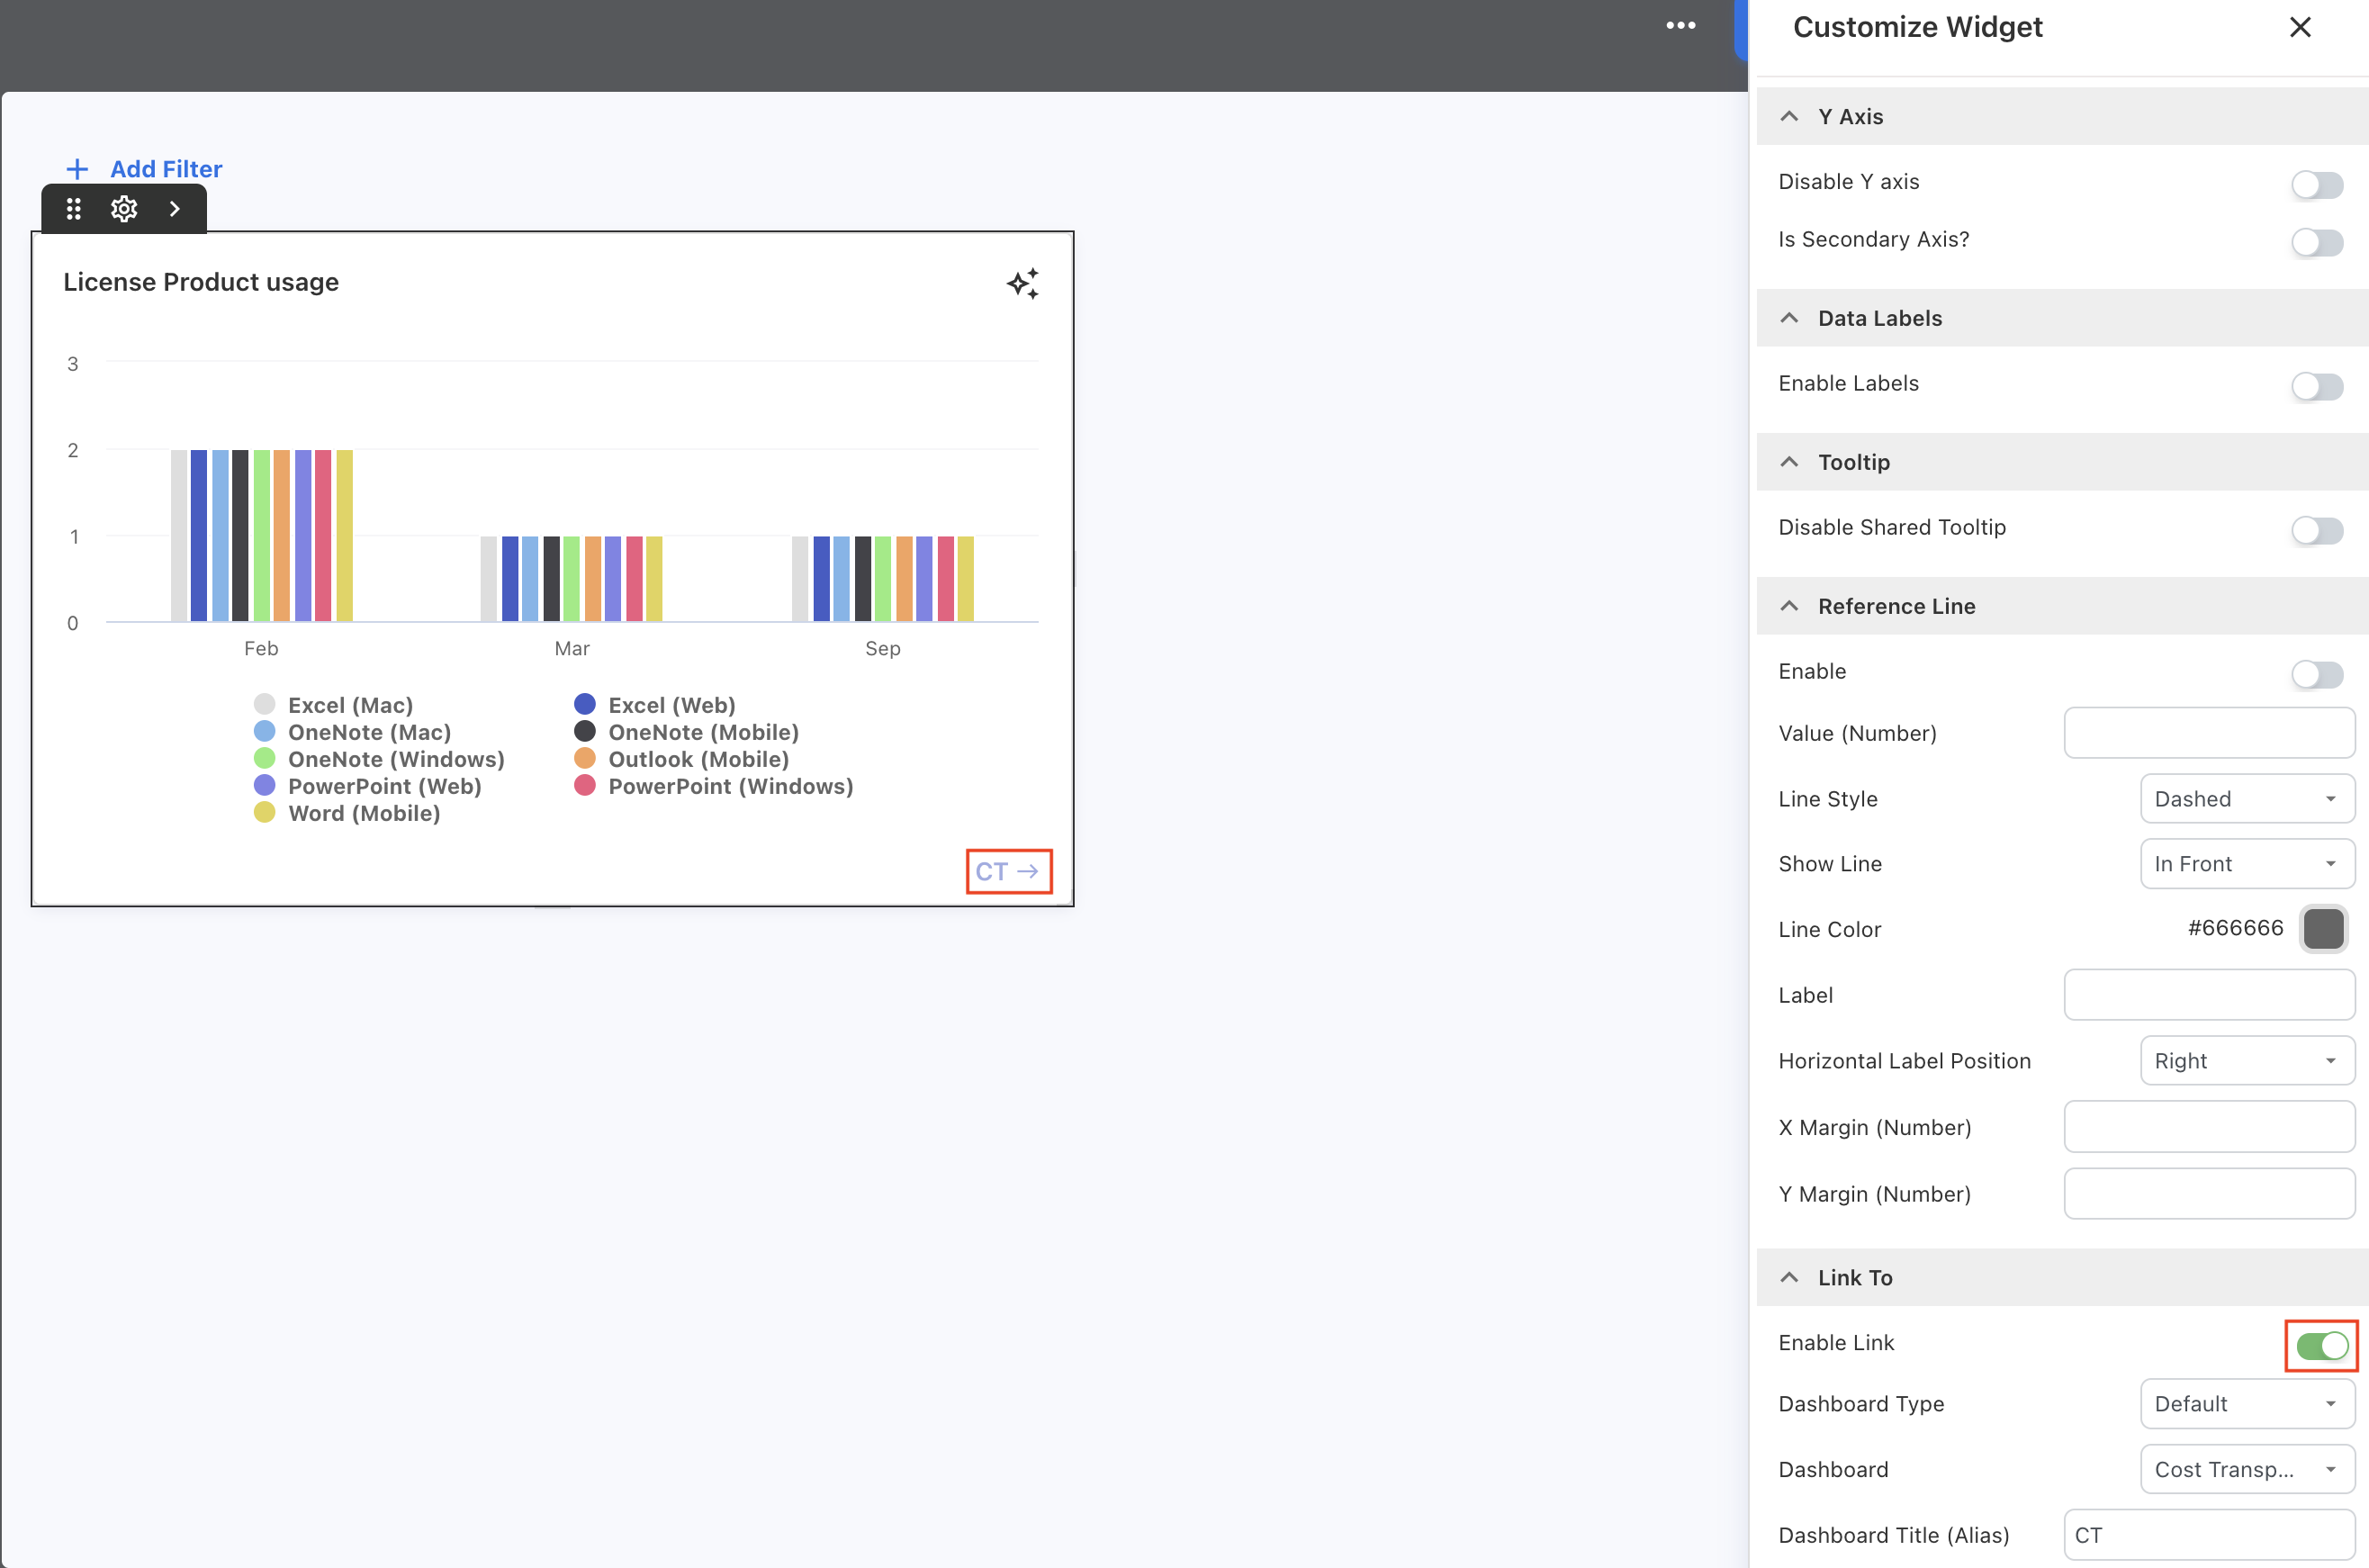
Custom Dashboard Enhancement
Link Dashboards via Widget
The custom dashboards now include a new capability to add the links for default dashboards and other custom dashboards as well.
-
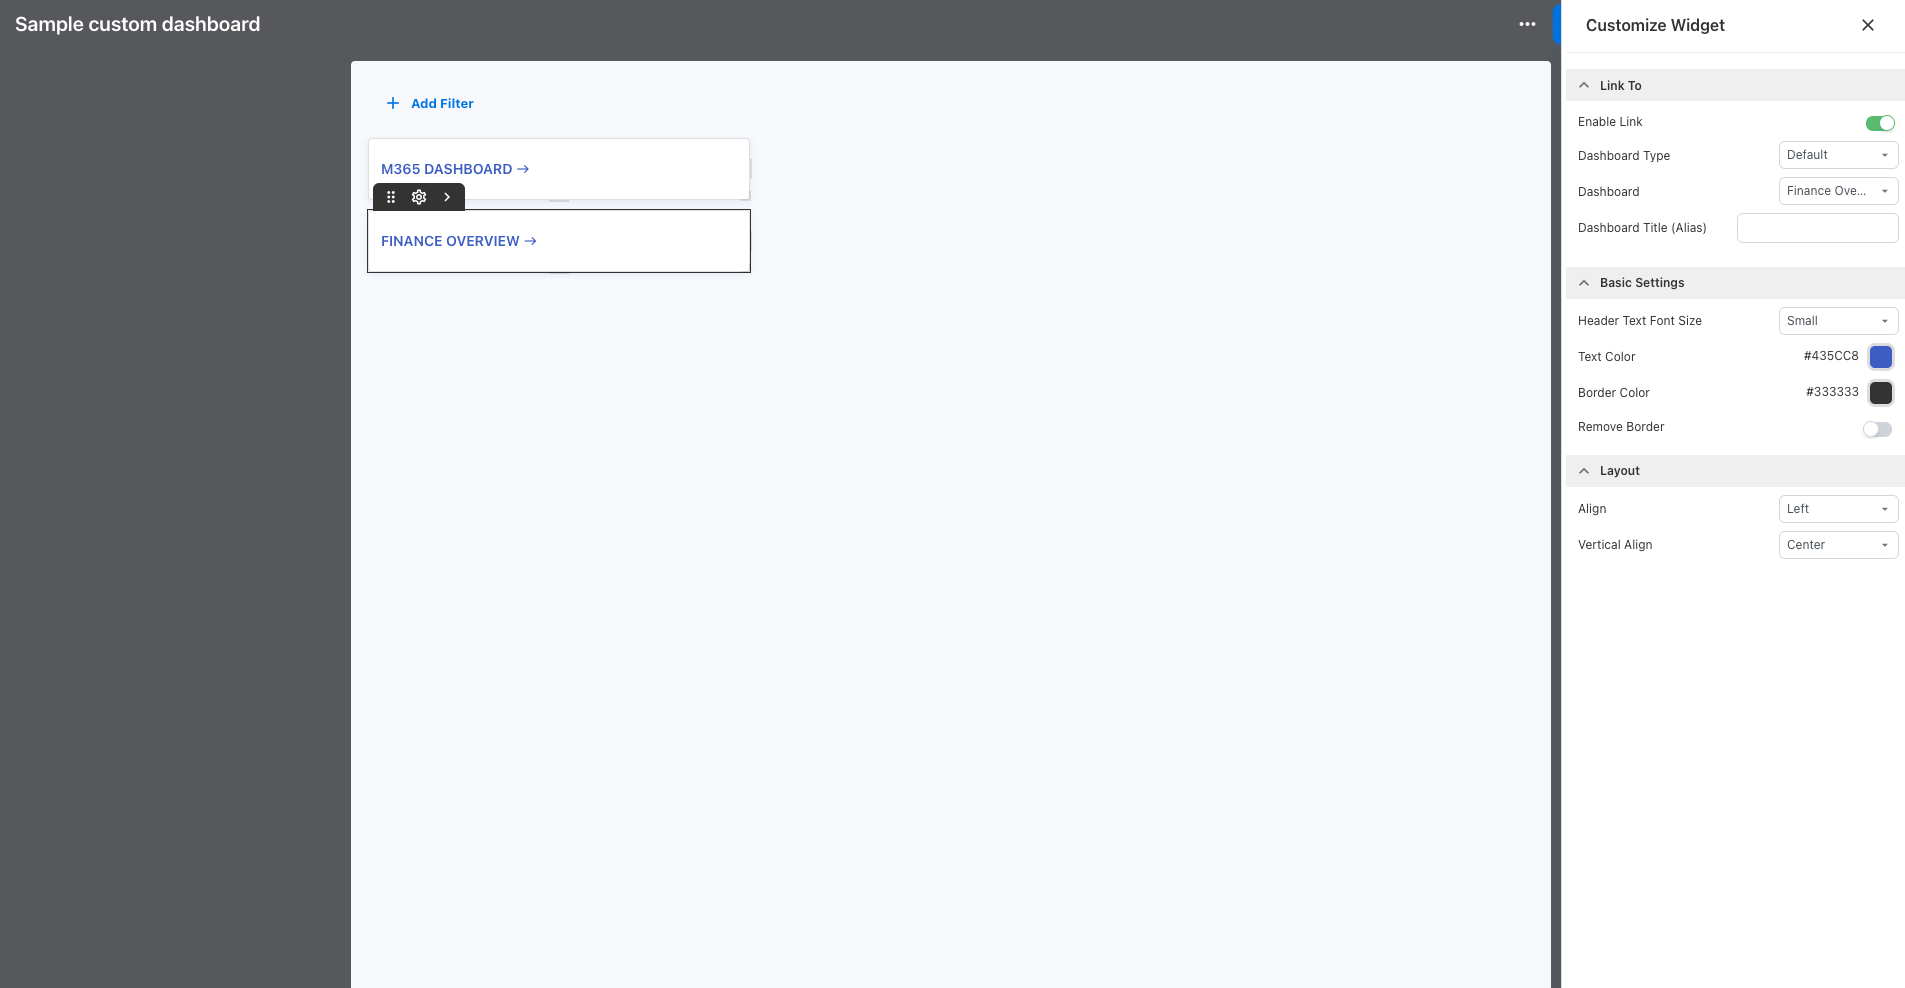
Dashboard selection: While configuring the widget, users can select the dashboard type—Custom or Default—and choose the target dashboard from a dropdown list.
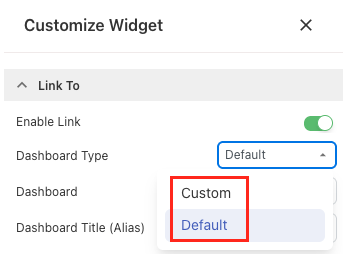
-
Drill-down: Once a link is defined, clicking on it takes the user directly to the selected dashboard.
-
Dashboard title: The dashboard title can be renamed, and users can change the text format for better visual alignment.
-
Enable/disable: A toggle switch is available to activate or deactivate the link without removing the configuration.
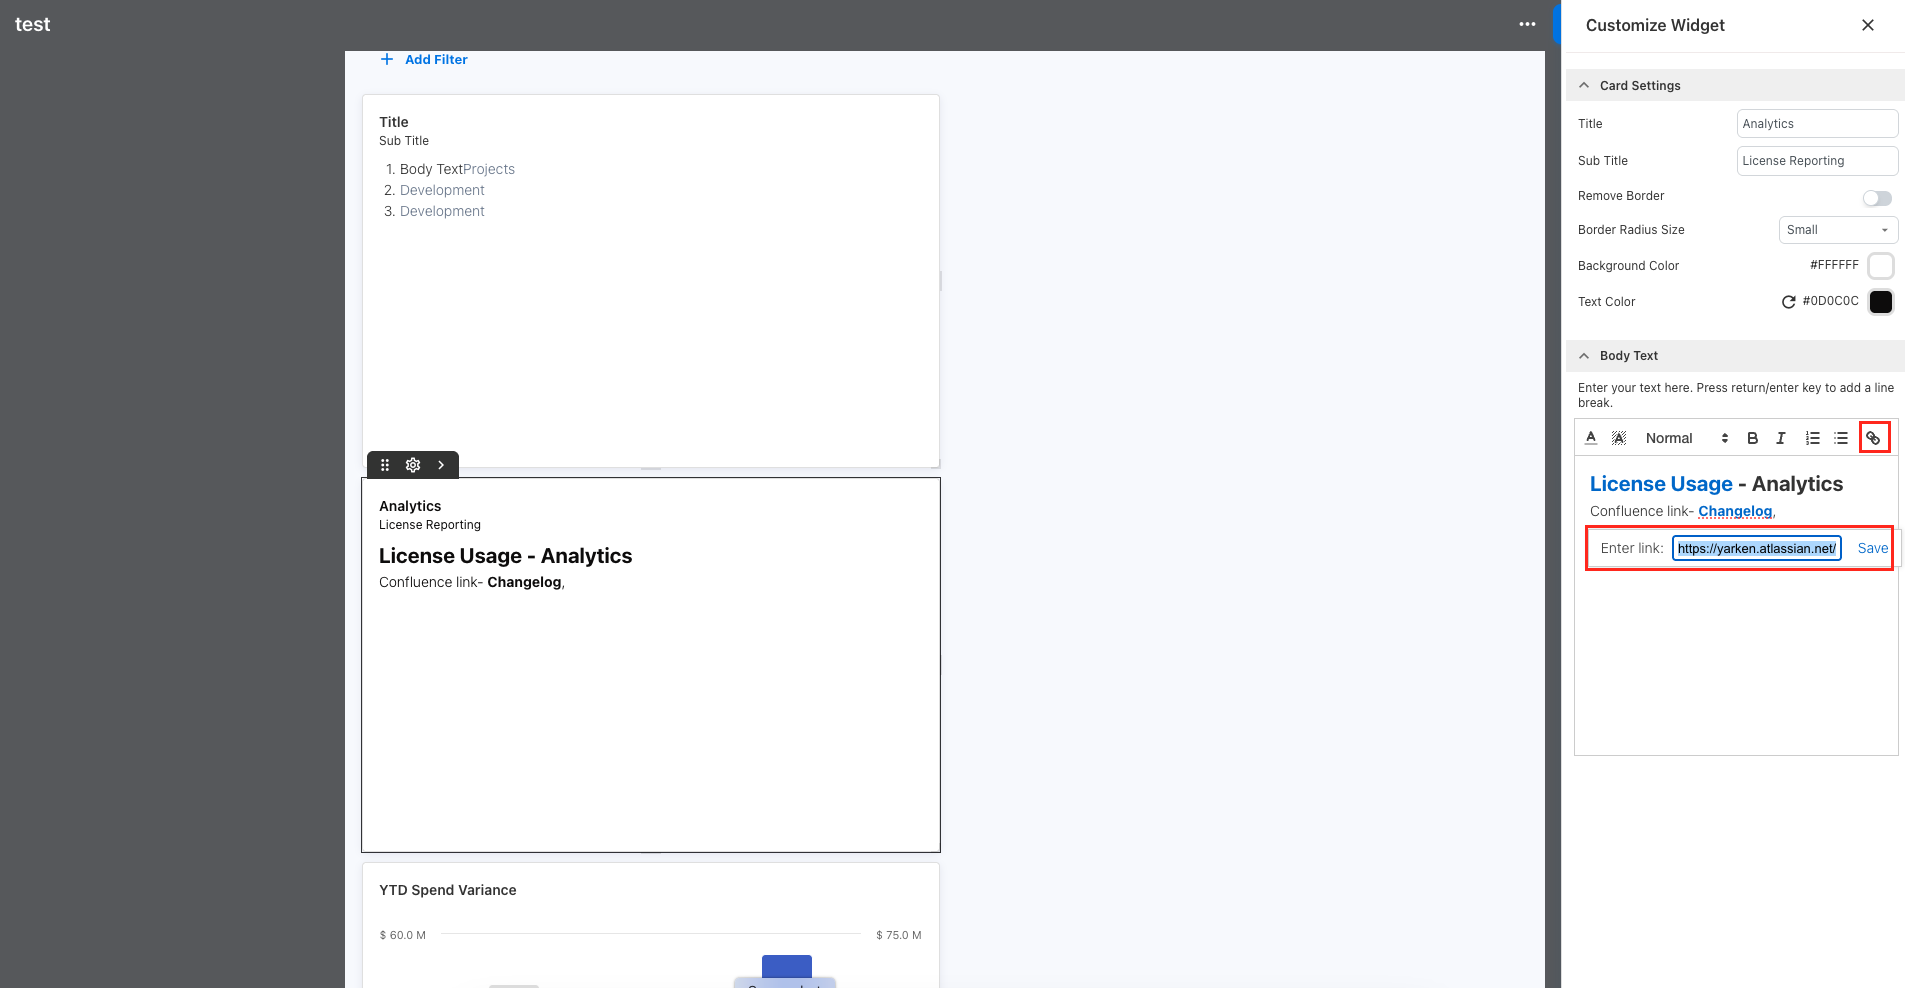
Hyperlinks in Text Widget
A new hyperlink option is added to the custom dashboard's text widget where users can now add links to external websites, internal resources, or documentation directly from the dashboard. The Body Text box allows you to insert any valid URL into the text content.
April 21, 2025
Click to expand...
What’s new
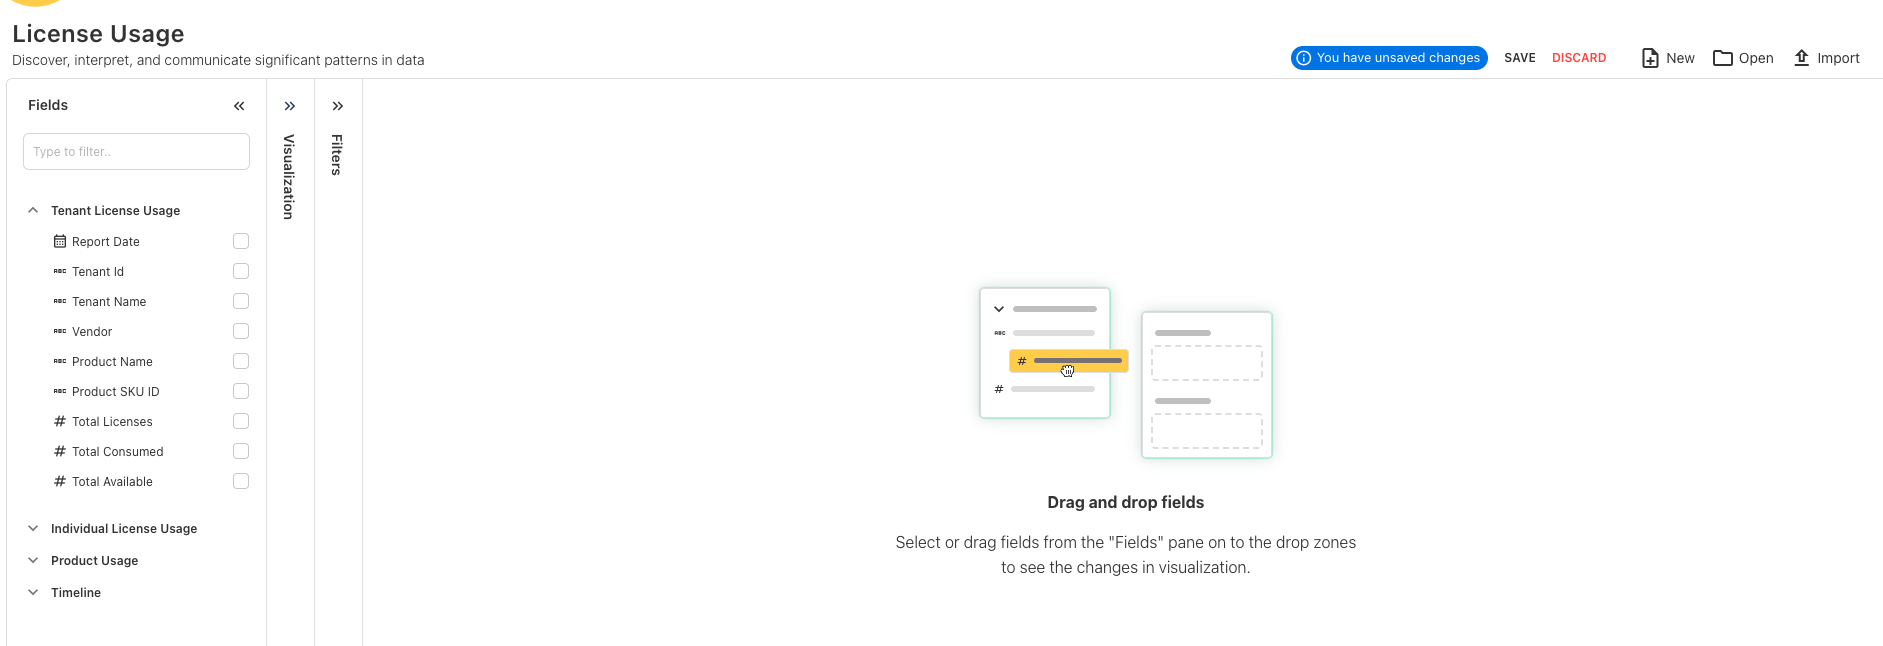
License Usage Cube in Analytics
A new License Usage cube is introduced in the Analytics. This cube is designed to provide detailed insights into tenant license usage, product usage, and individual license usage. It allows users to:
-
View and compare license usage on a monthly, quarterly, or yearly basis.
-
Track total, consumed, and available licenses at the tenant level.
-
Check product license count for individual users.
-
Analyze active users per application.
Enhancements
Contract Number on Budget
The Budget now includes a new field called Contract Number to better track budget entries related to specific contracts.
KPI order on Dashboards
The KPI order on the dashboards is updated to improve clarity and prioritization.
Forecast Renaming
The Forecast menu item under Planning is renamed to Cloud Forecast.
April 14, 2025
April 07, 2025
Enhancements
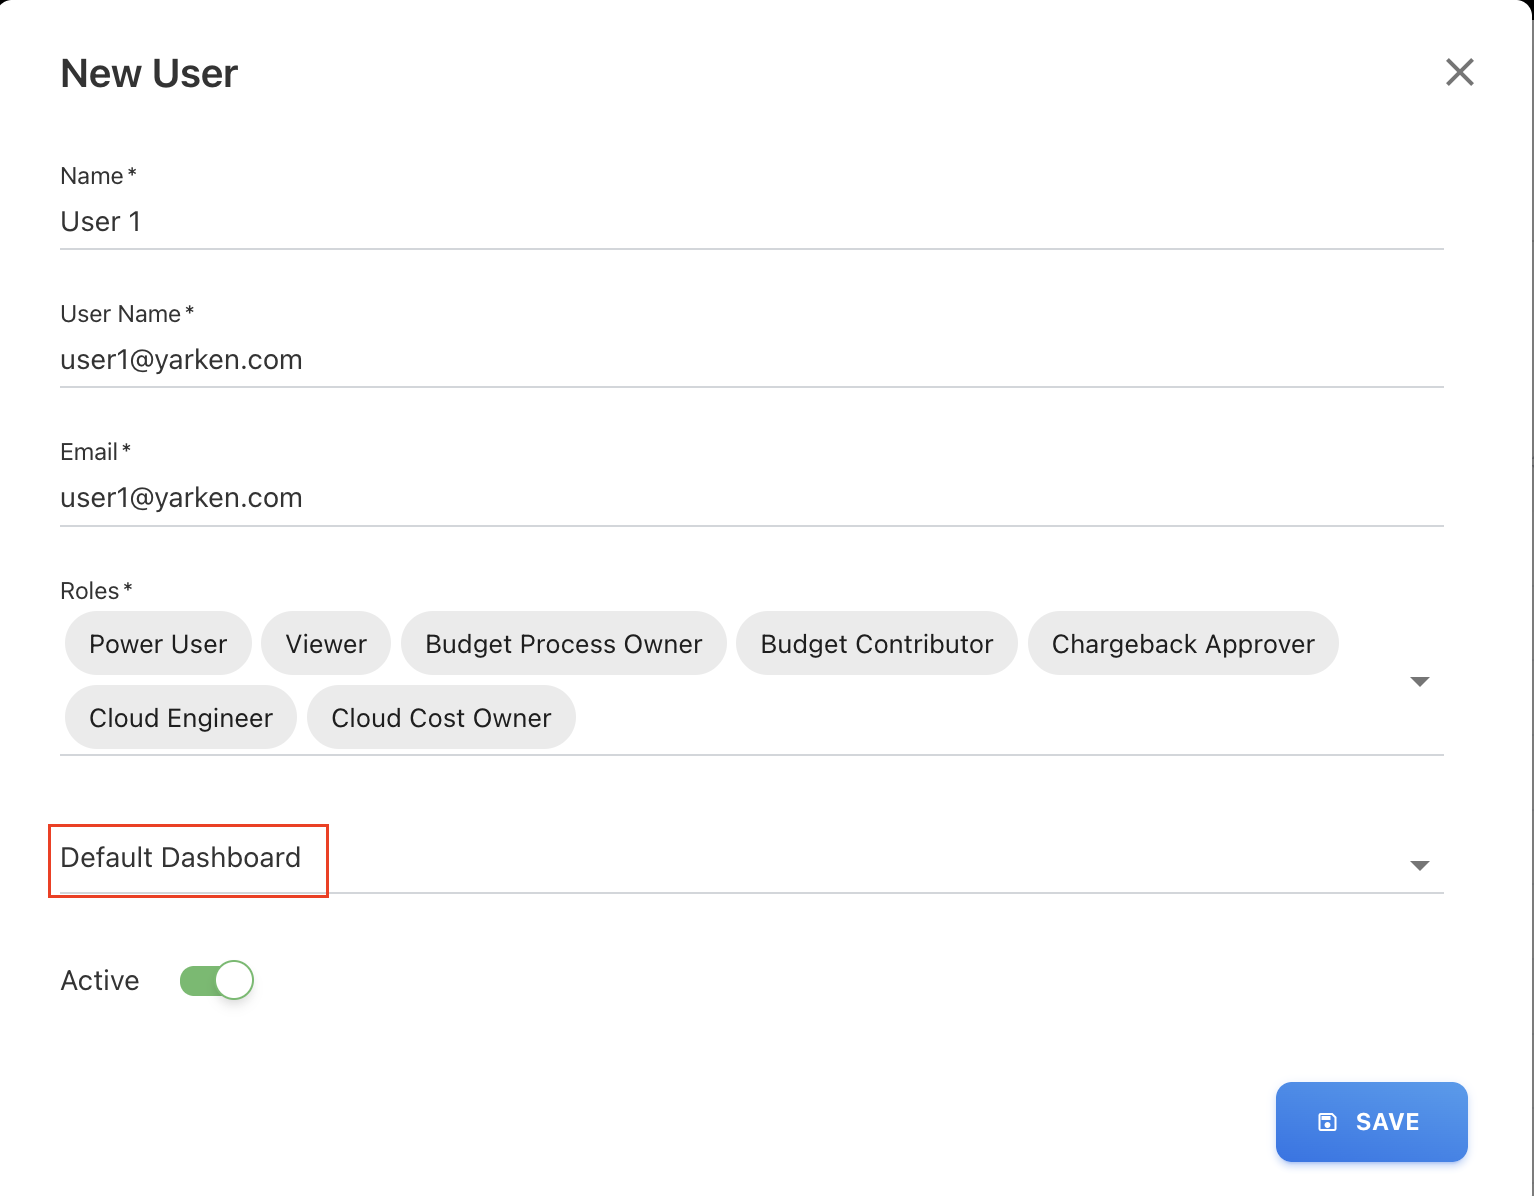
Default Dashboard Assignment
Admins can now assign a Default Custom Dashboard to users via User Management. This is especially useful for Dashboard-Only users, but is also extended to other roles.
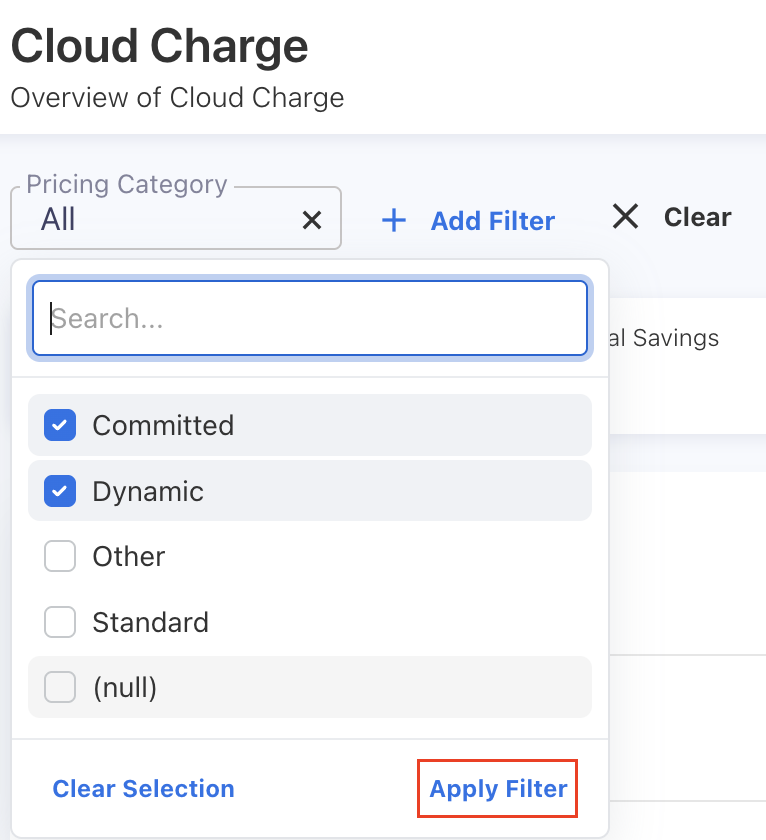
Apply Filter Button on Filters
Introduced an Apply Filter button across all filter panels. Filters now apply only after clicking this button, instead of auto-refreshing results upon selection.
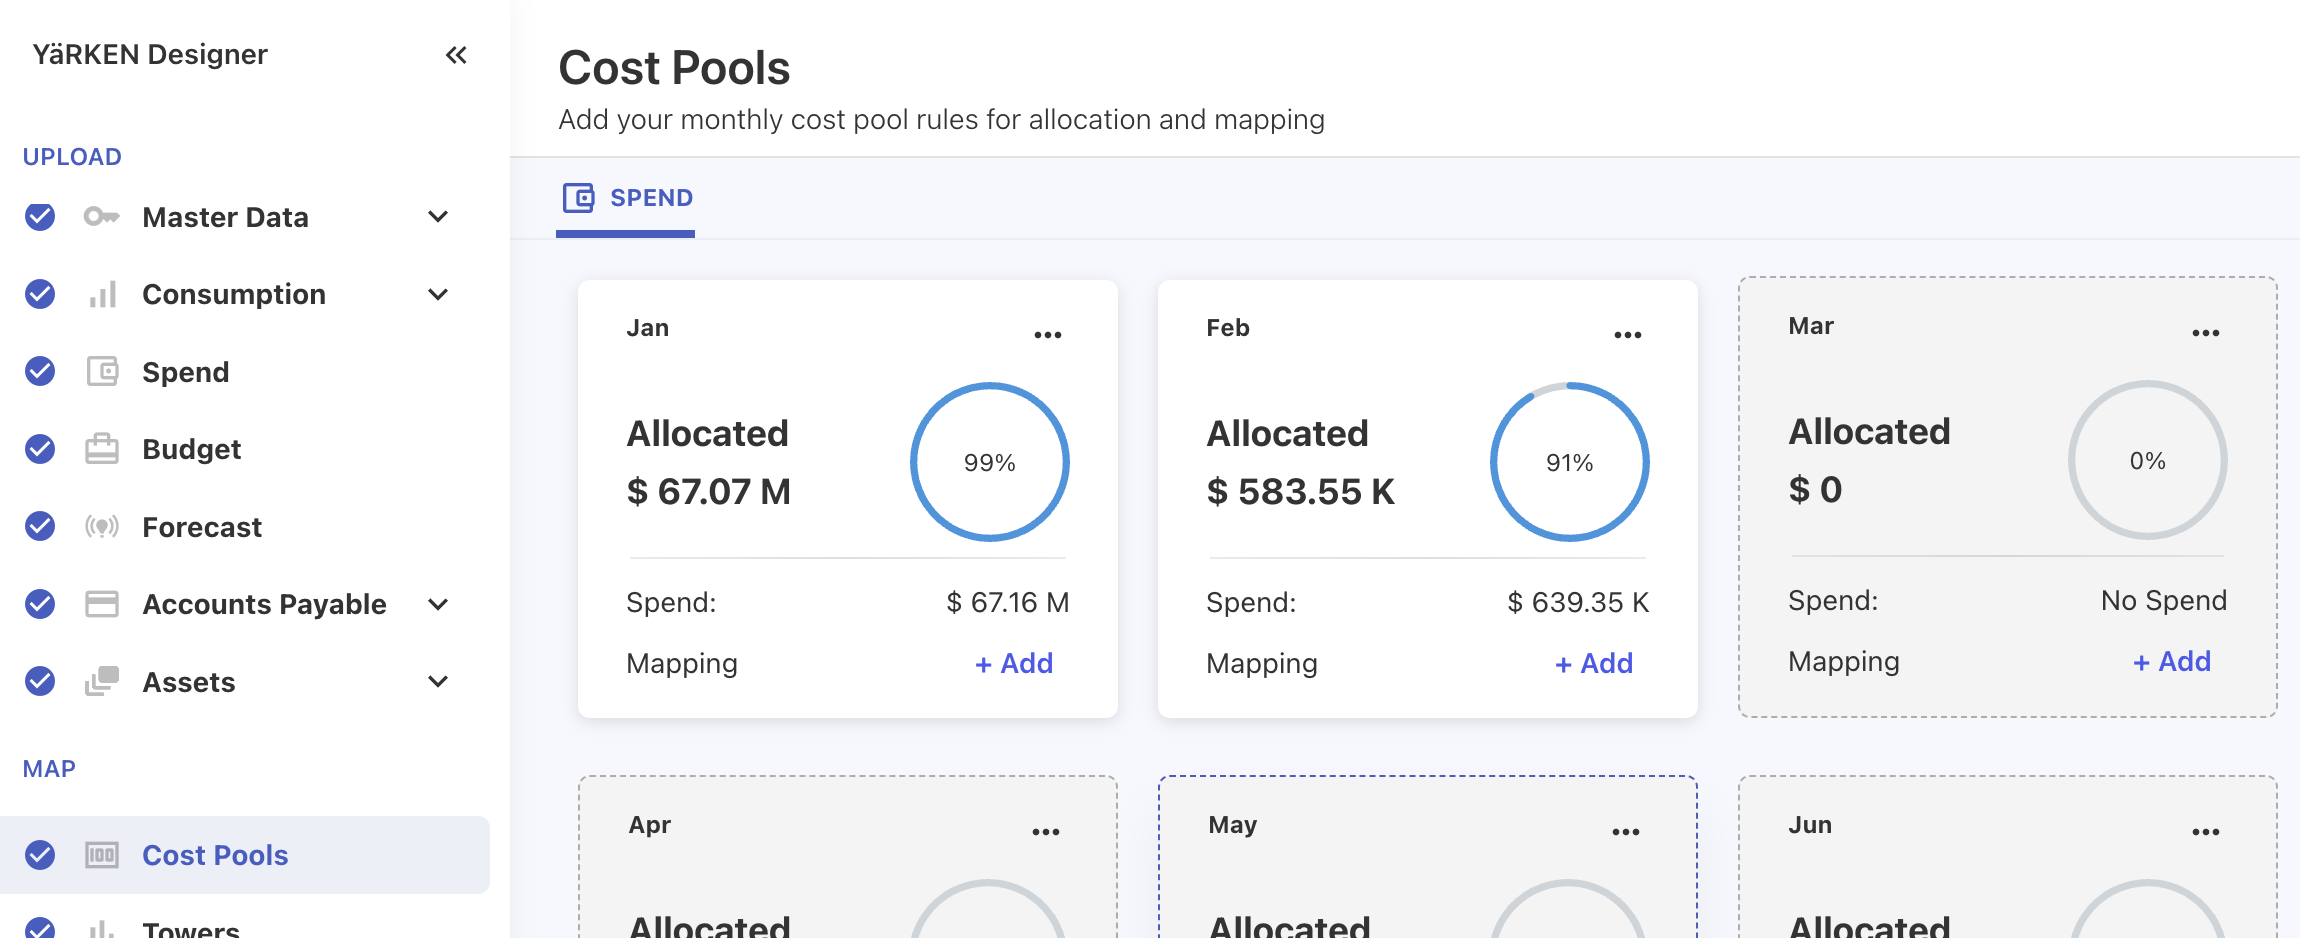
Budget Allocation
The budget allocation logic for Cost Pools, Towers, and Solution Offerings in Designer has been updated. Budget is now allocated using the same rule-based logic as spend, ensuring consistency. Previously, the allocation view in Designer relied directly on the Budget file, which has now been corrected to reflect the actual allocated values based on rules.
Auto Cube Refresh Toggle Fix
Turning Auto Cube Refresh ON/OFF no longer triggers an immediate cube refresh.
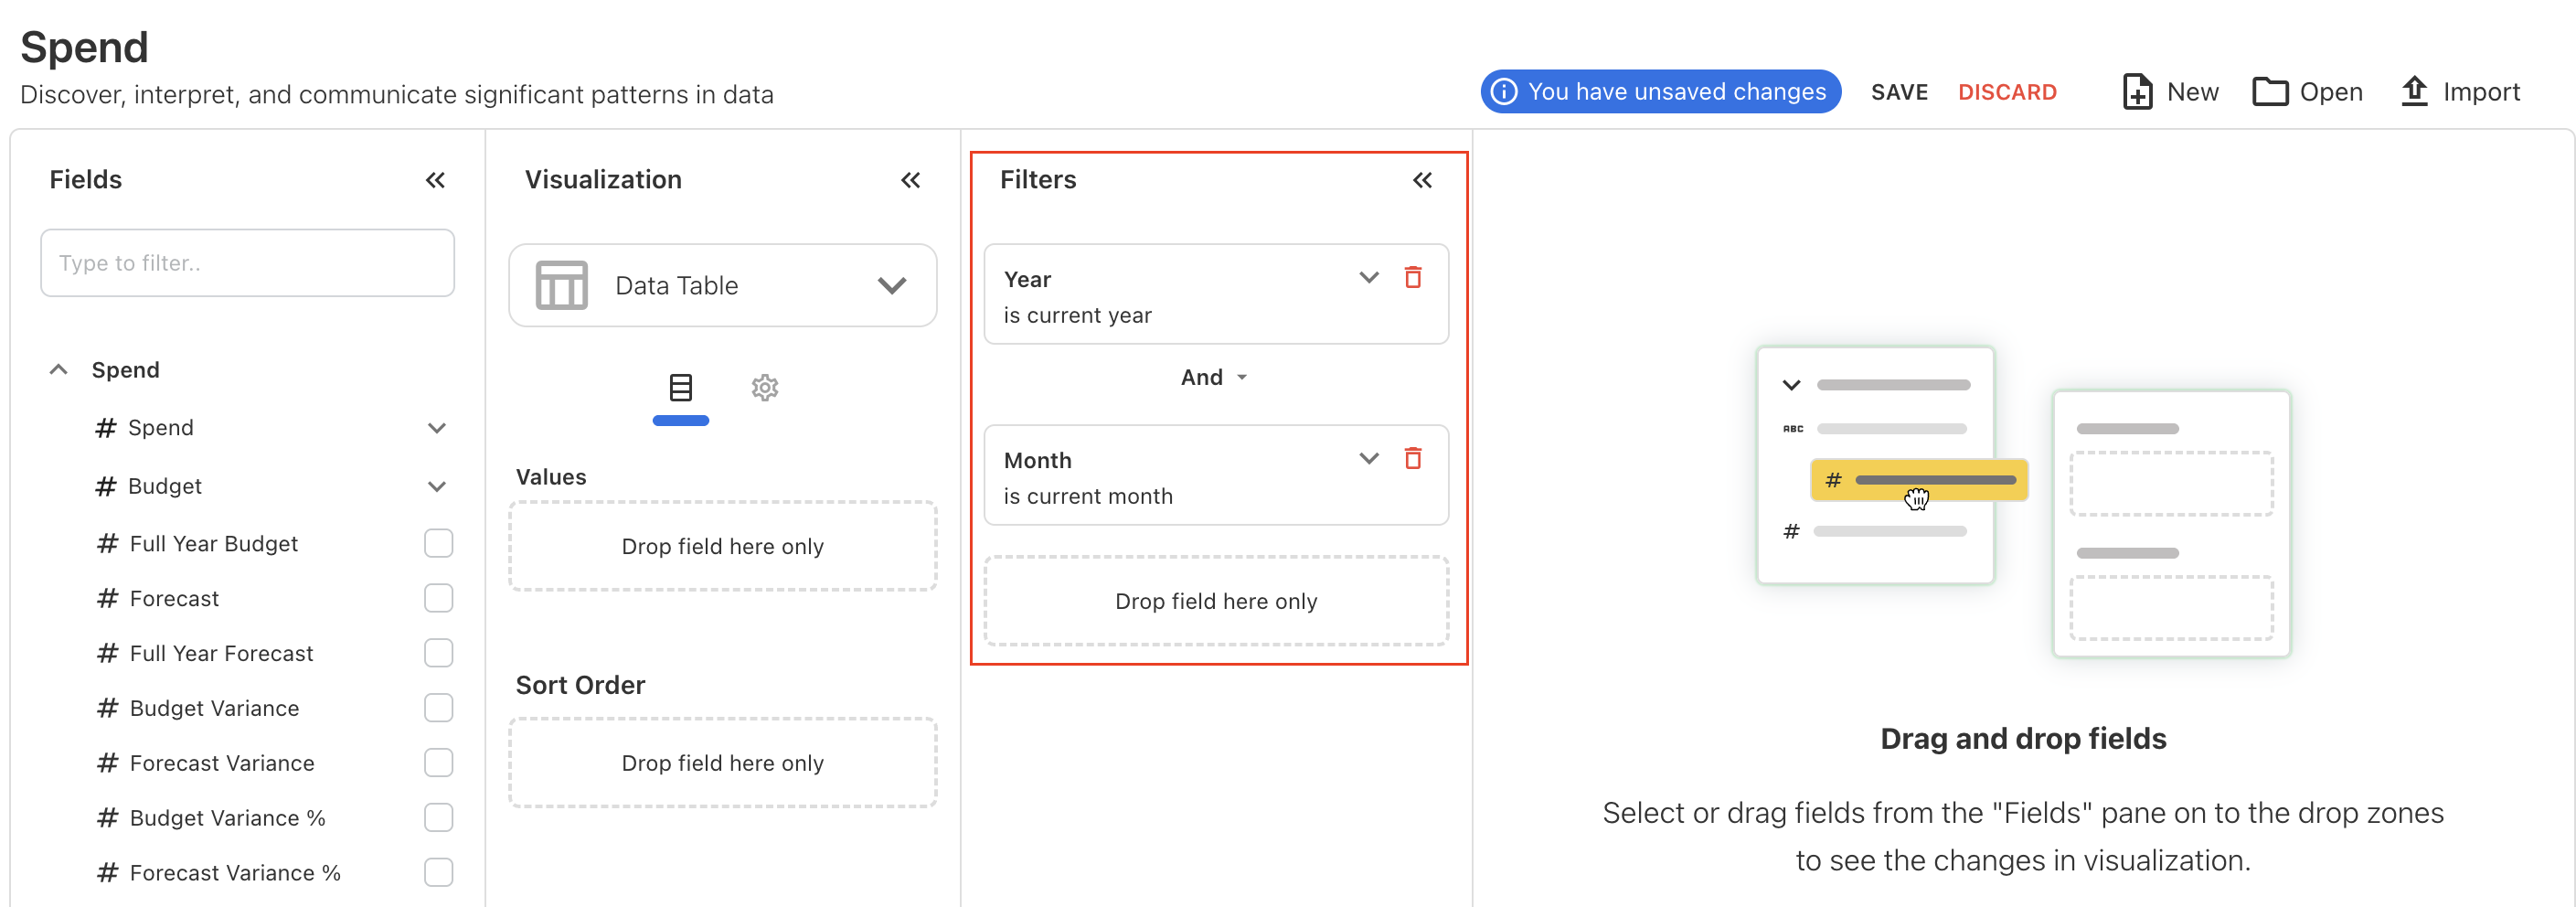
Filters Panel in Analytics
The Filters panel in the Analytics is now open by default with default selections for the current year and current month when the user accesses any cubes.
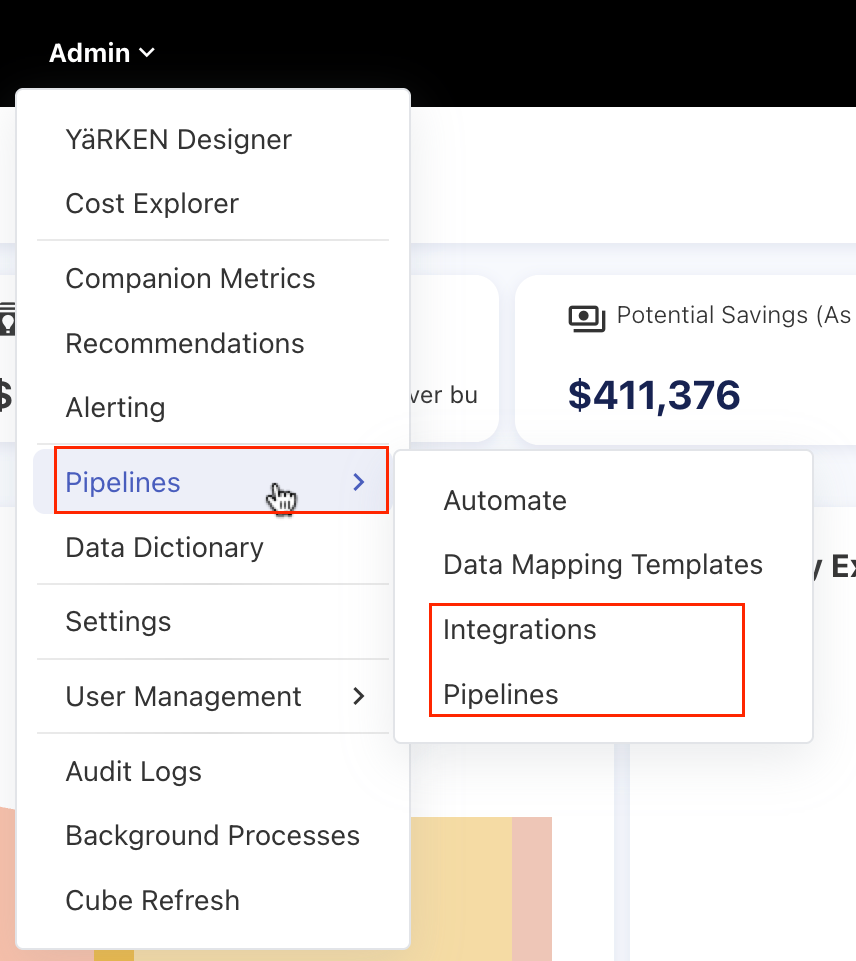
Integration Terminology Update
We have renamed Integration to Pipeline, and Storage Account to Integrations throughout the application.
Licensing Fixes
Addressed two issues related to licensing behavior:
-
Licenses will now remain active until the end of the expiry date, instead of expiring a day early.
-
The license expired banner will now be cleared immediately after a new license is applied, without requiring a server restart.
Improved GL Popup UX
The GL popup is enhanced by grouping values based on filter types, for examples, Month, Accounts, and Cost Centers.
March 31, 2025
Enhancements
Dashboard Only - A New User Role
We have introduced a new user role named Dashboard-Only. This role can be assigned by an admin and is intended for users who should only have access to a specific custom dashboard. Users with this role will not have access to other menus, and the home page will only be available. The home page will display the assigned primary custom dashboard. If no dashboard is assigned, users will see a message stating, No Dashboard Assigned.
Alerting Enhancement
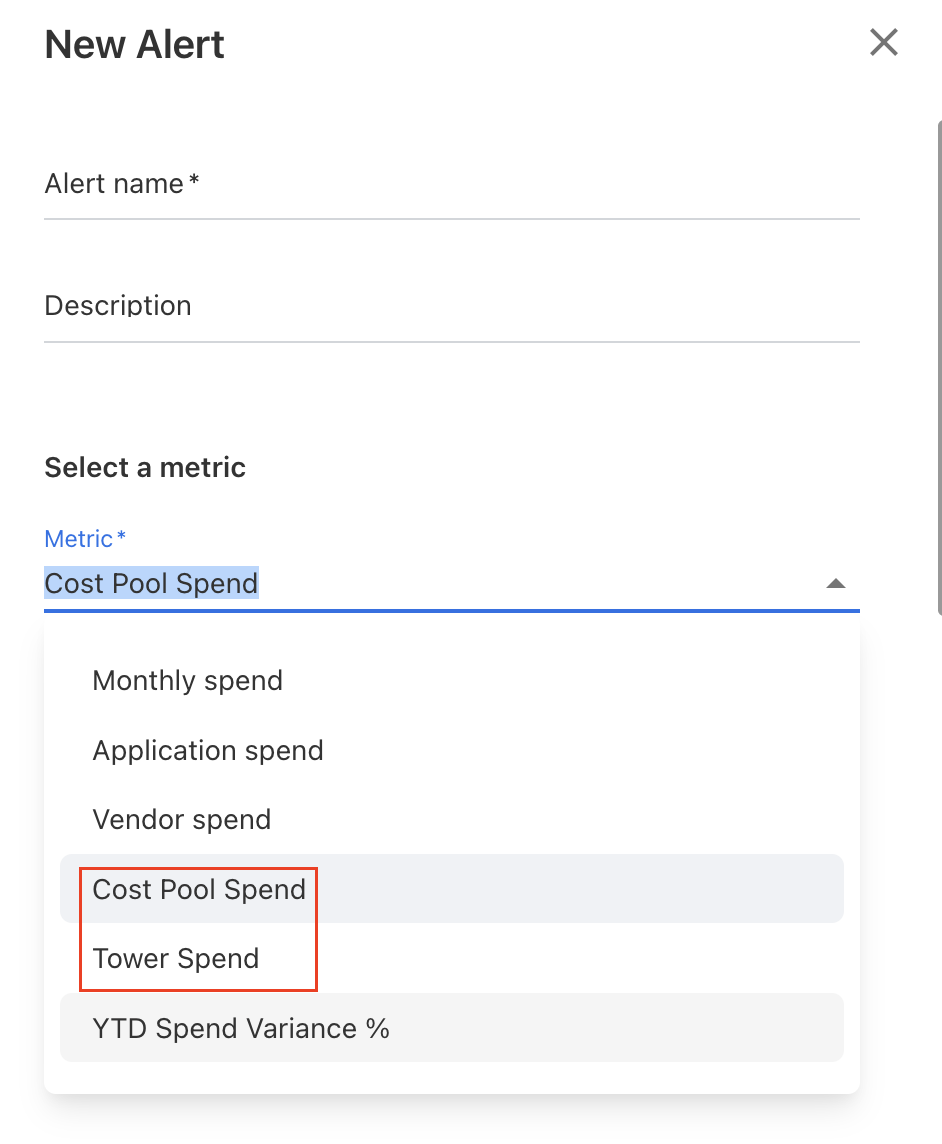
A New Metric Type
The alerting feature now allows users to set the alerts for the Cost Pool Spend and Tower Spend. These two new criteria have been added to the metric list.
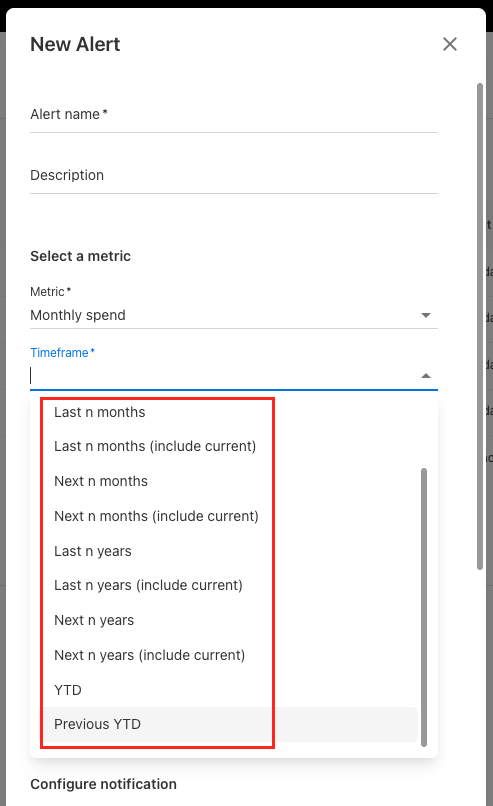
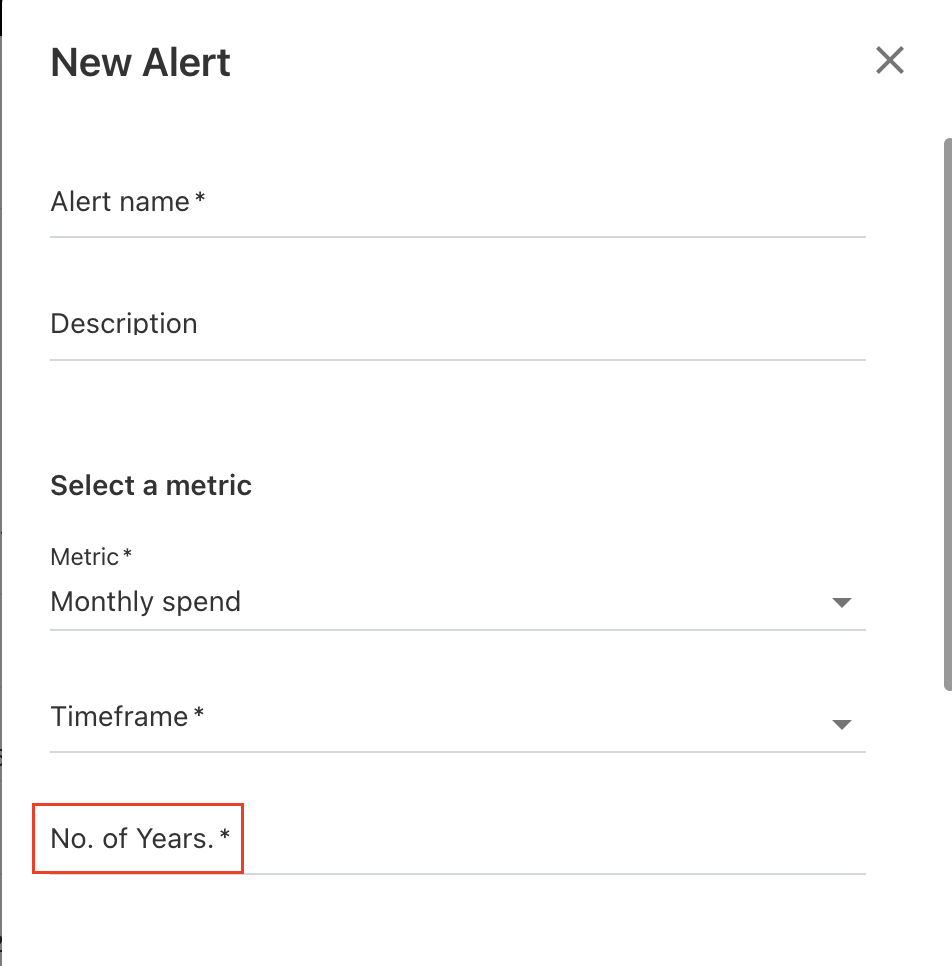
Timeframe
The Alerting feature has been enhanced to offer more flexible options in the Timeframe dropdown after selecting a metric. Previously, only the current month or year could be selected. Now, the dropdown includes additional options, such as last/next month, last/next year, YTD, and Previous YTD. When selecting last or next month/year, users are required to specify the number of months or years to evaluate.
March 24, 2025
Enhancements
Expense Type on Home Page
An Expense Type filter has been added to the home page, with the default value set to OpEx. This filter applies to all widgets on the home page.
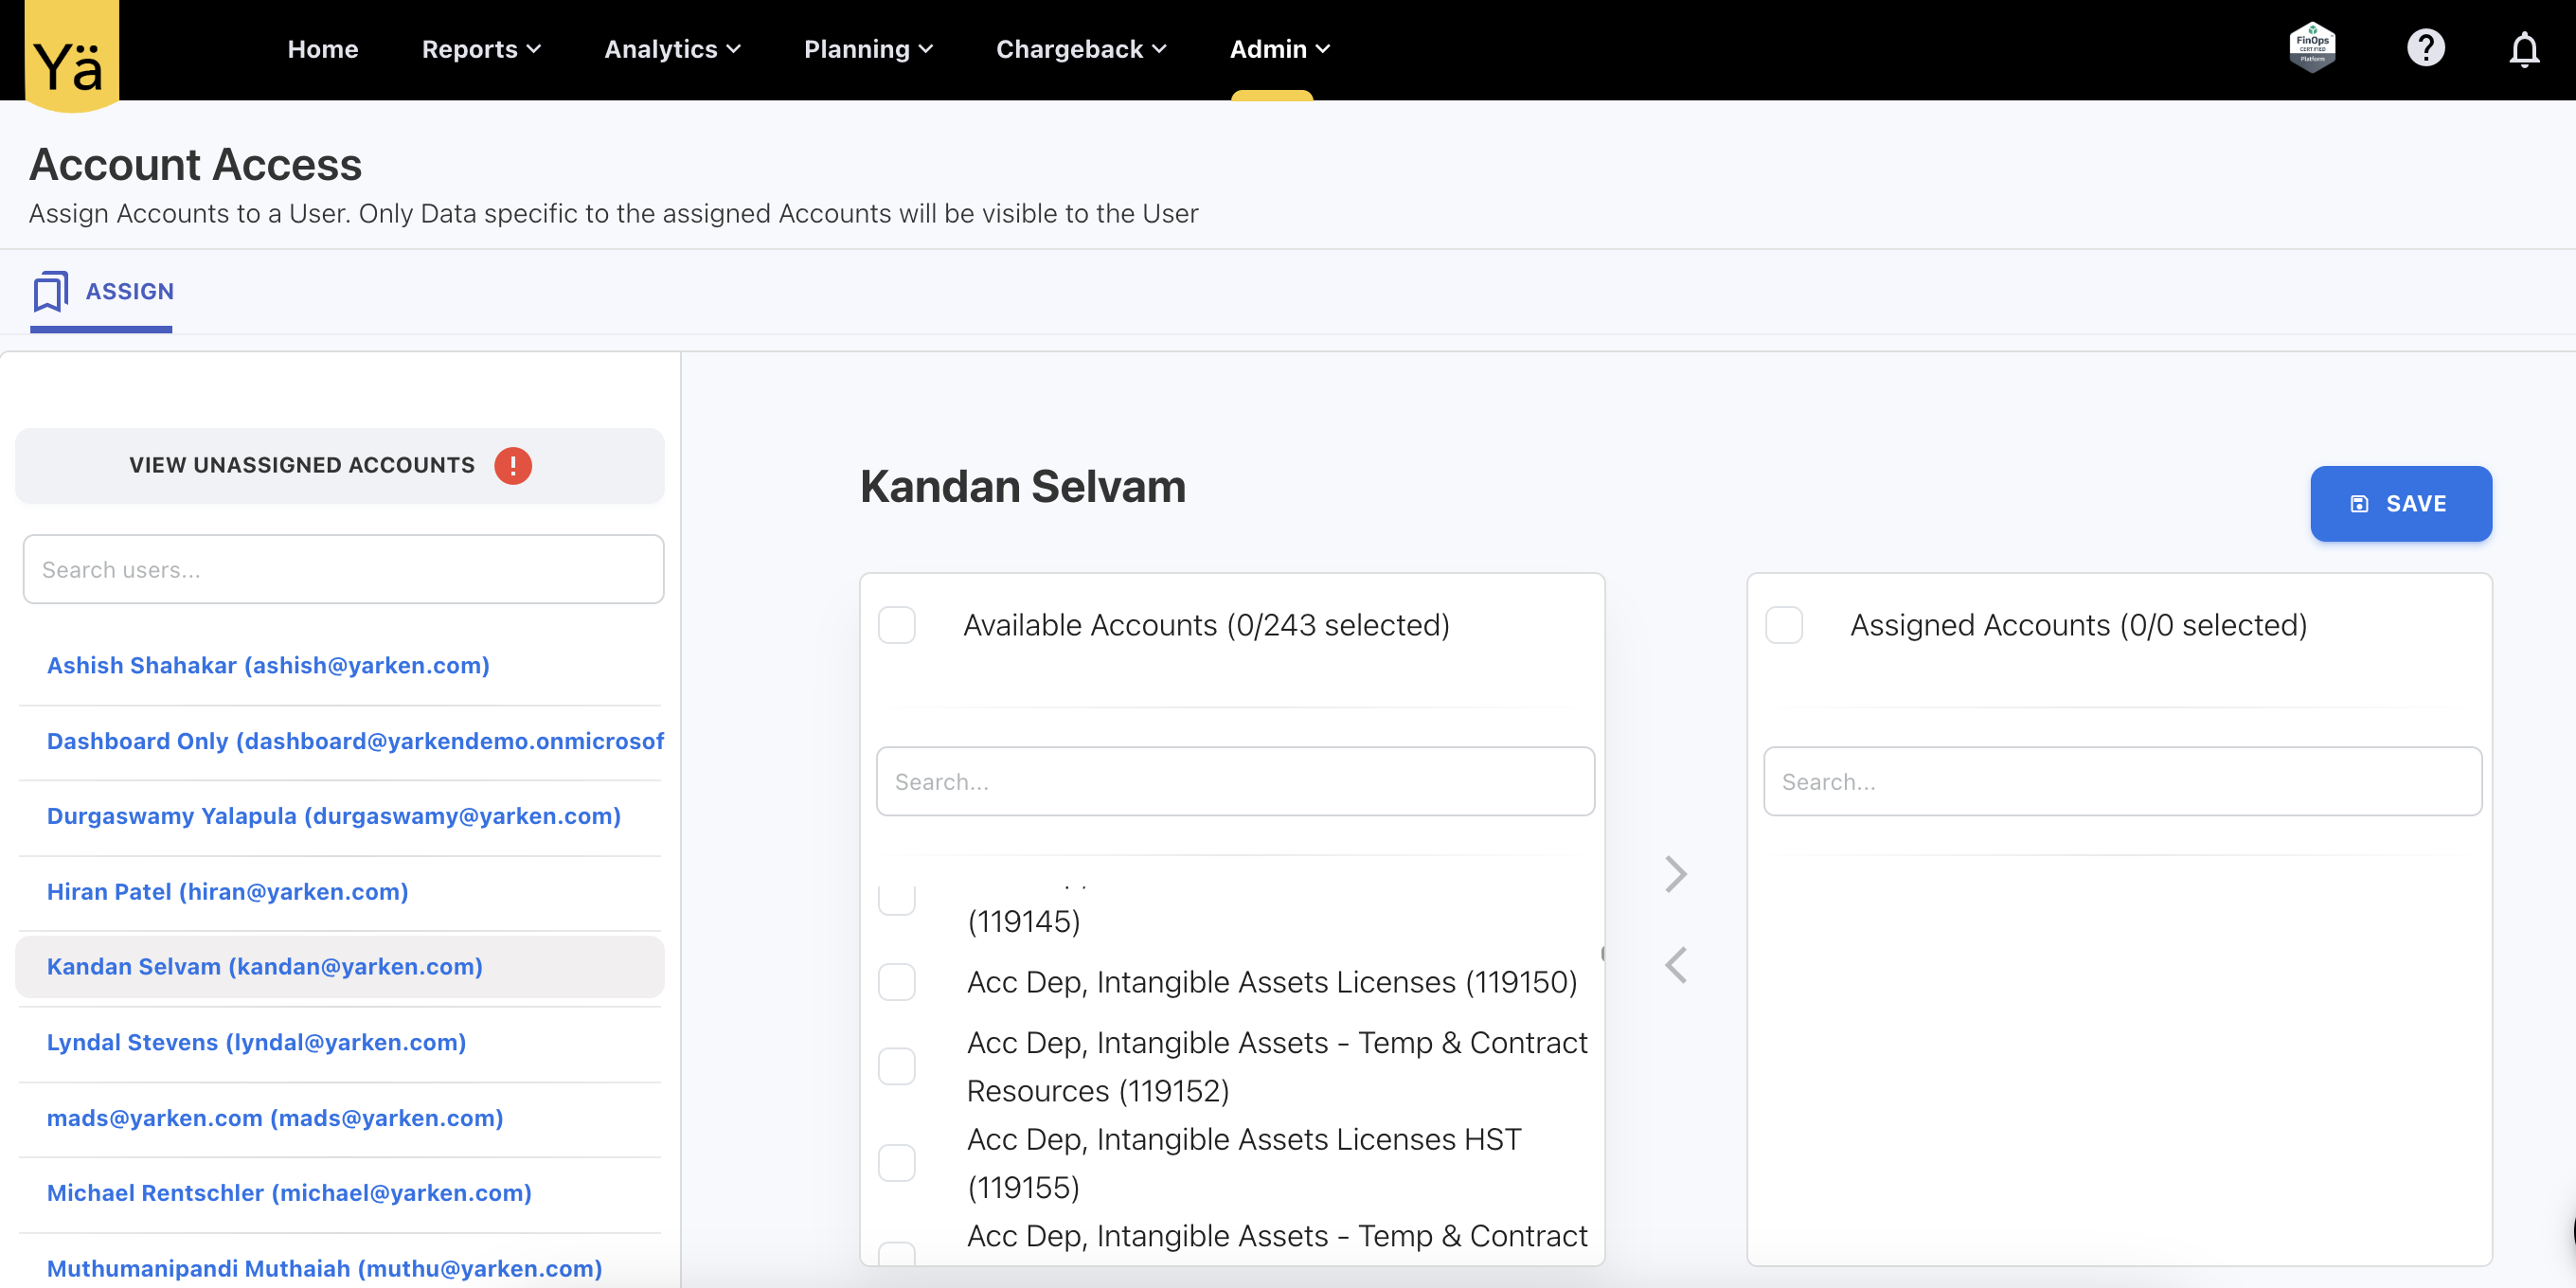
Account Level Access
We’ve introduced a new capability that allows administrators to assign specific accounts to users. This enhancement ensures that users only have access to data relevant to those accounts. Admins can now manually assign accounts to users from User Management > Account Access. Once an account is assigned to a user, only data linked to that account will be accessible to the user across dashboards, reports, and any applicable views. To access data, users must have both account and cost center permissions. For newly created users, no accounts will be assigned by default.
Data Mapping Template
A clear notifications will be shown at each step to inform you if a data mapping template or integration with the same name already exists.
-
If the strategy is different, you’ll see a prompt: A data mapping template named [template name] already exists with different fields. Do you wish to replace it or create a new data mapping template?
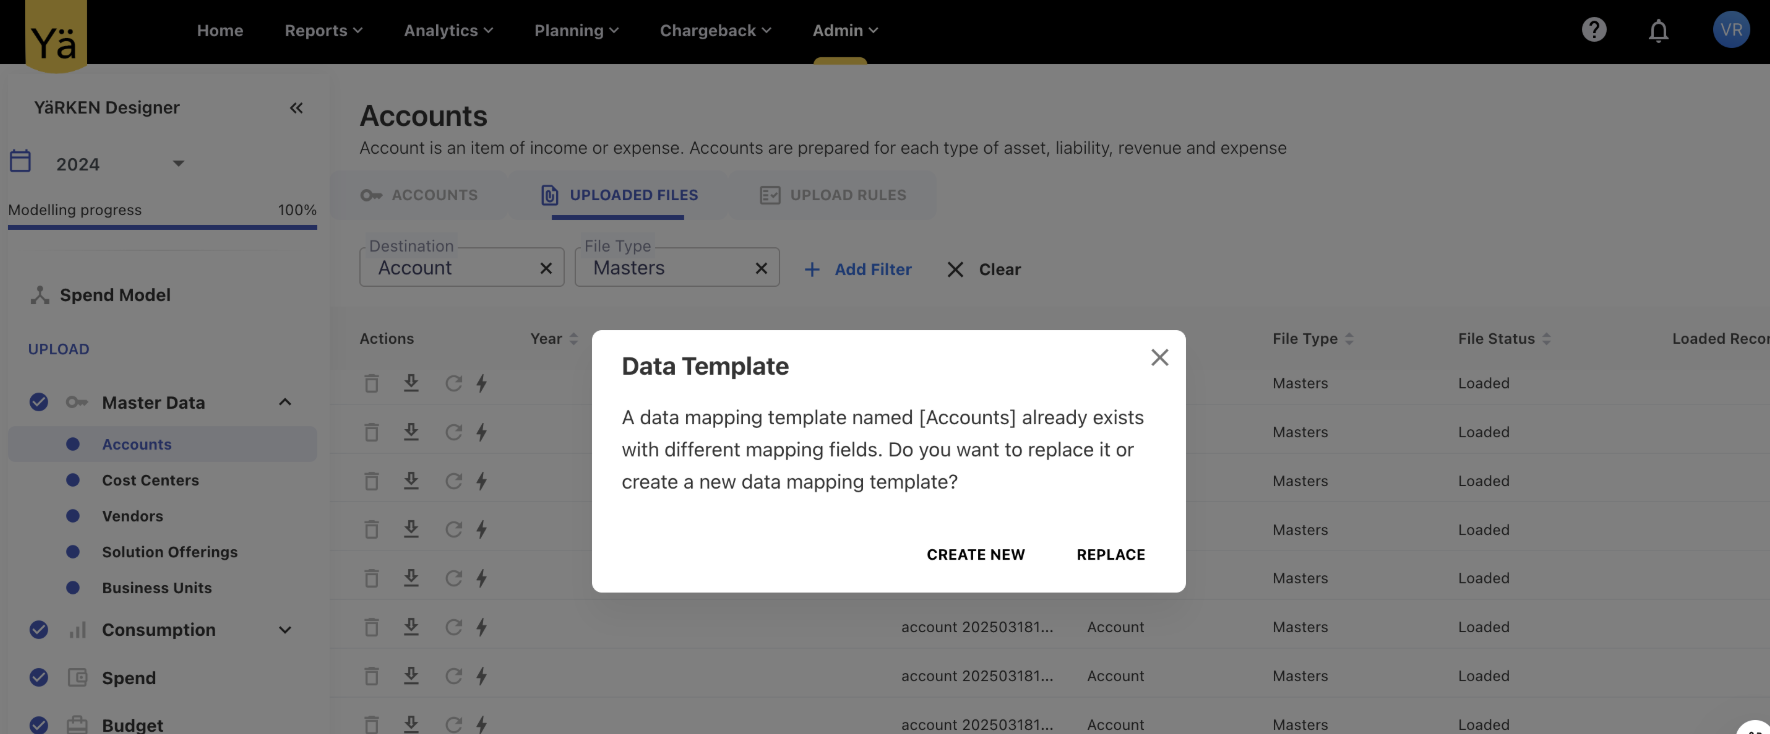
You can then choose to either update the existing template or create a new one.
-
If the strategy and name are the same, the system will skip the template prompt and take you directly to the integration creation form.
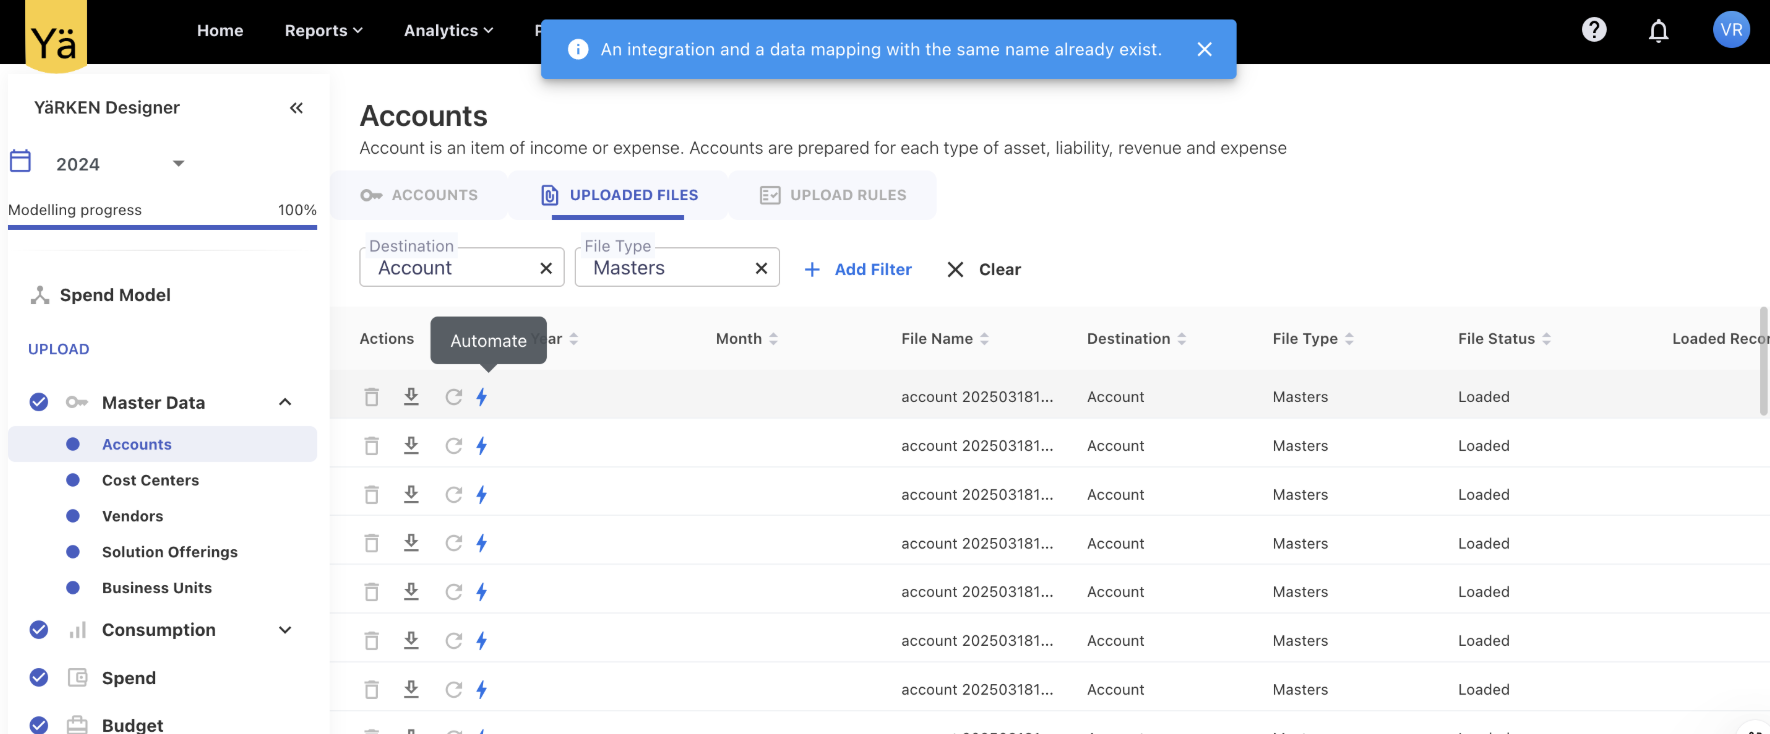
Integration checks:
Before initialising the create integration form, the system checks if an integration with the same name already exists. If it does, an informational message will appear:
An integration and a data mapping with the same name already exist.
March 17, 2025
Enhancements
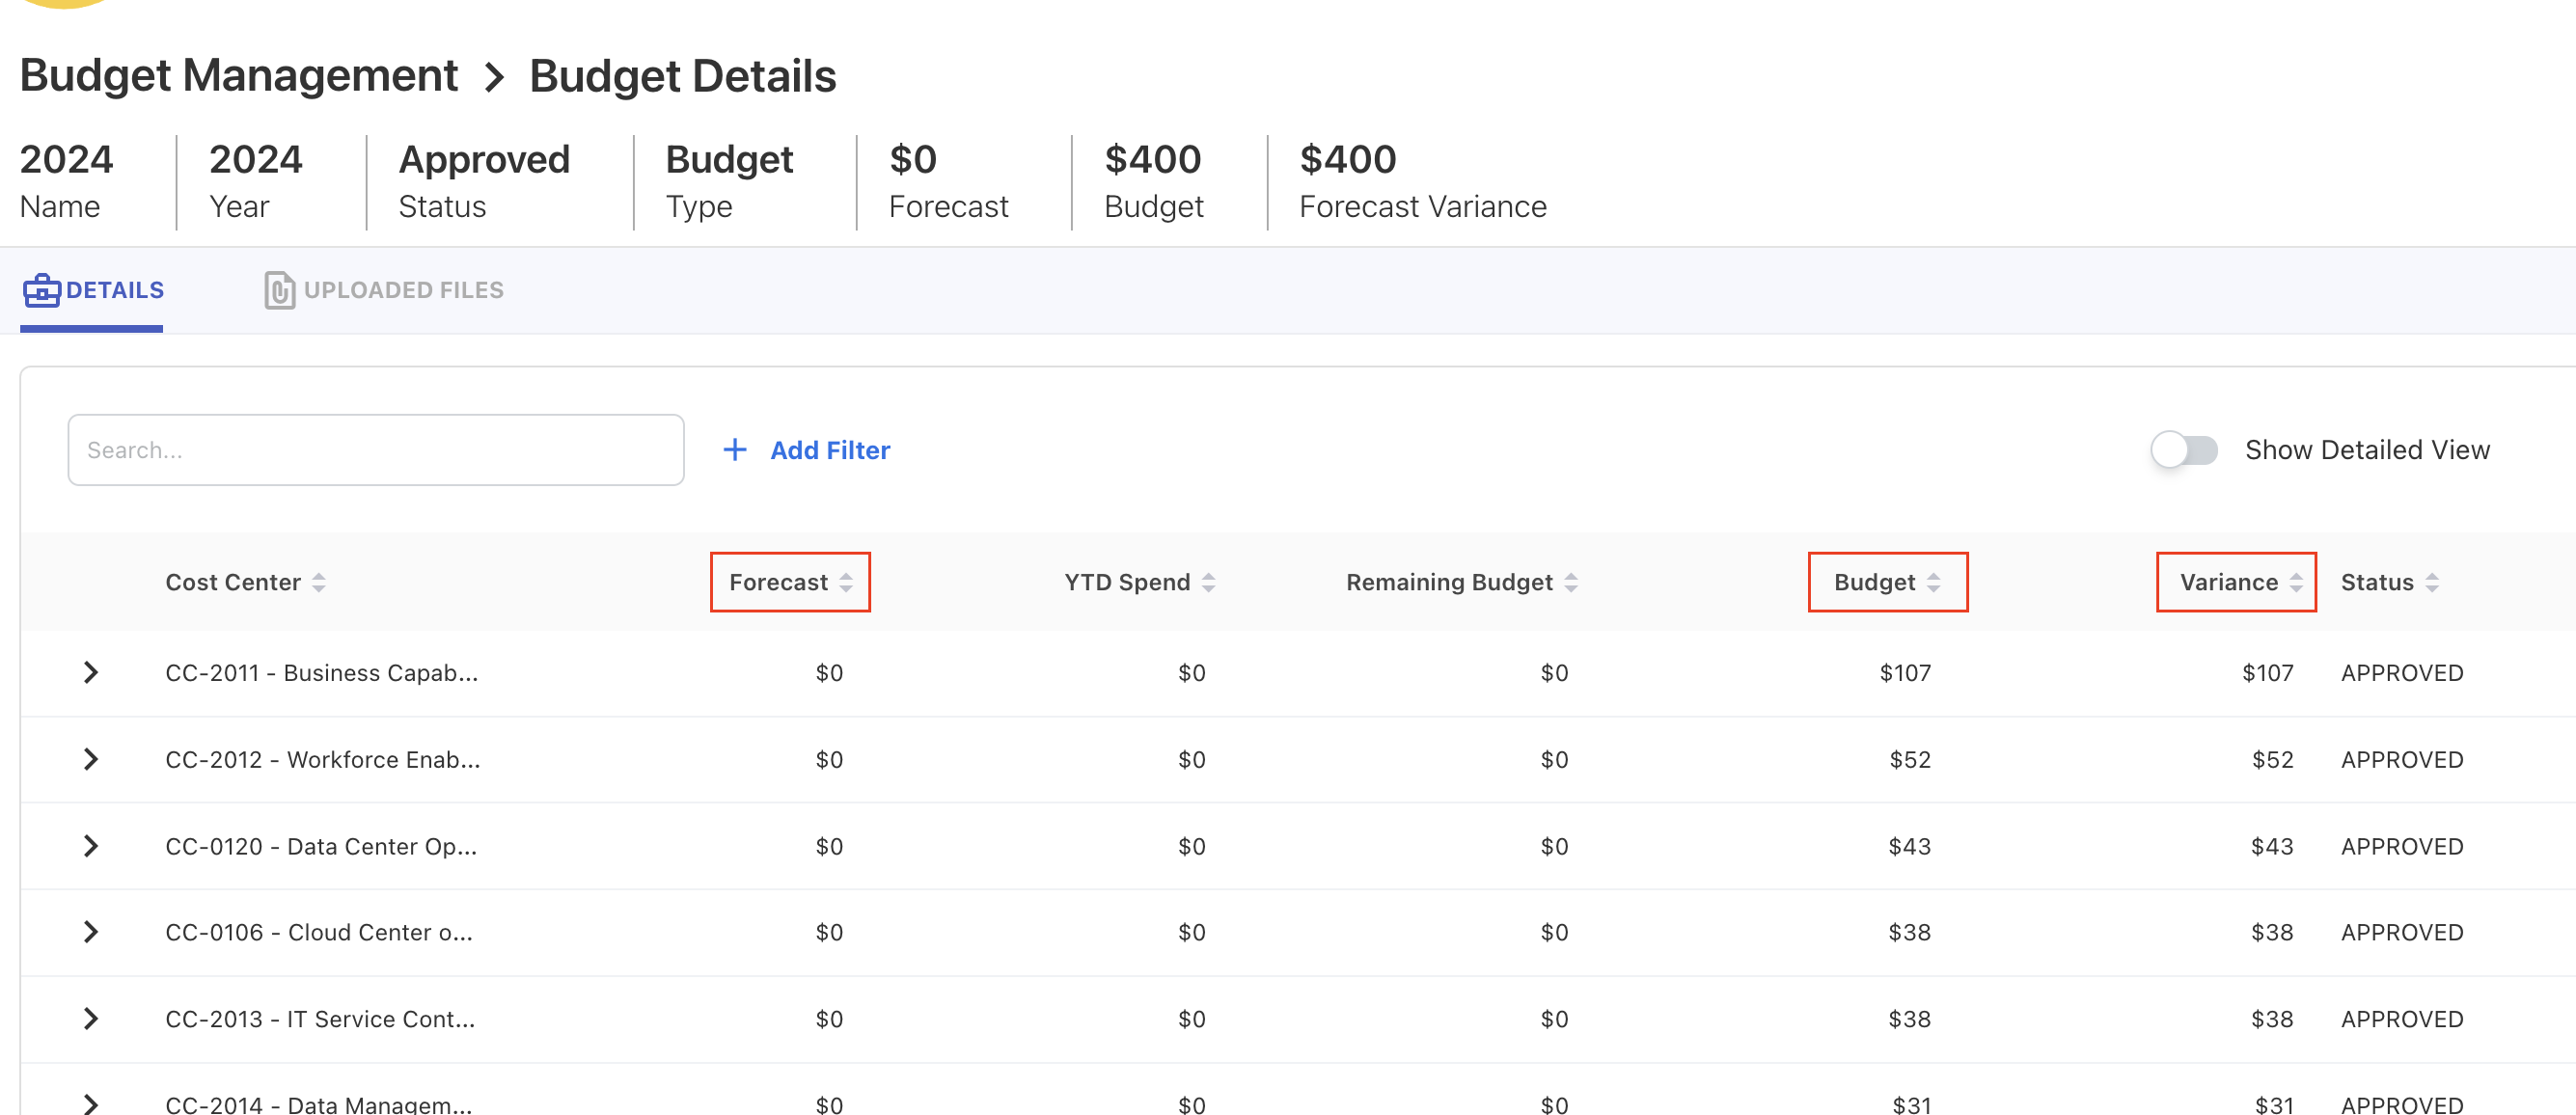
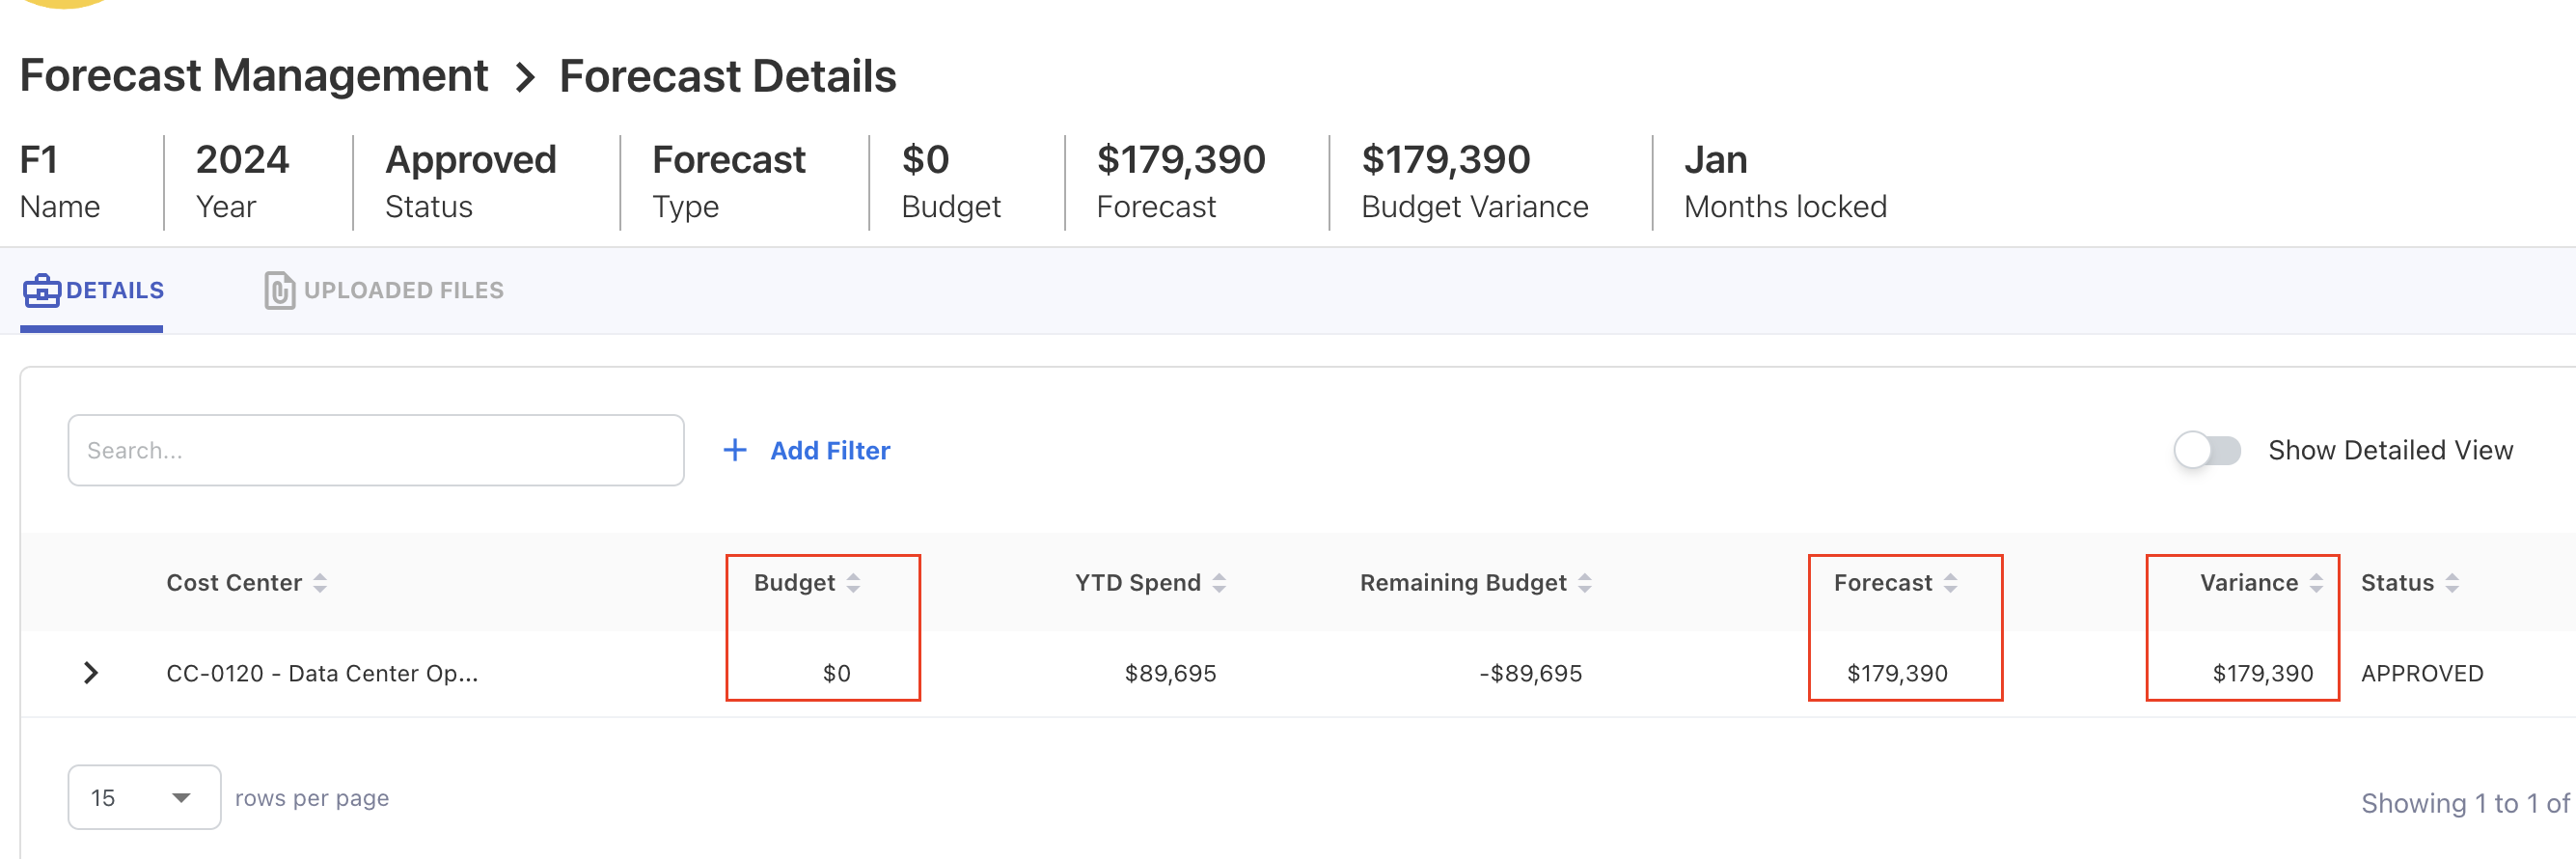
Budget and Forecast Values
On the Budget Details page, the forecast value is now displayed alongside the budget data. Similarly, on the Forecast Details page, the budget value appears along with the forecast data. Additionally, a Variance calculation has been introduced on both pages.
March 10, 2025
Enhancements
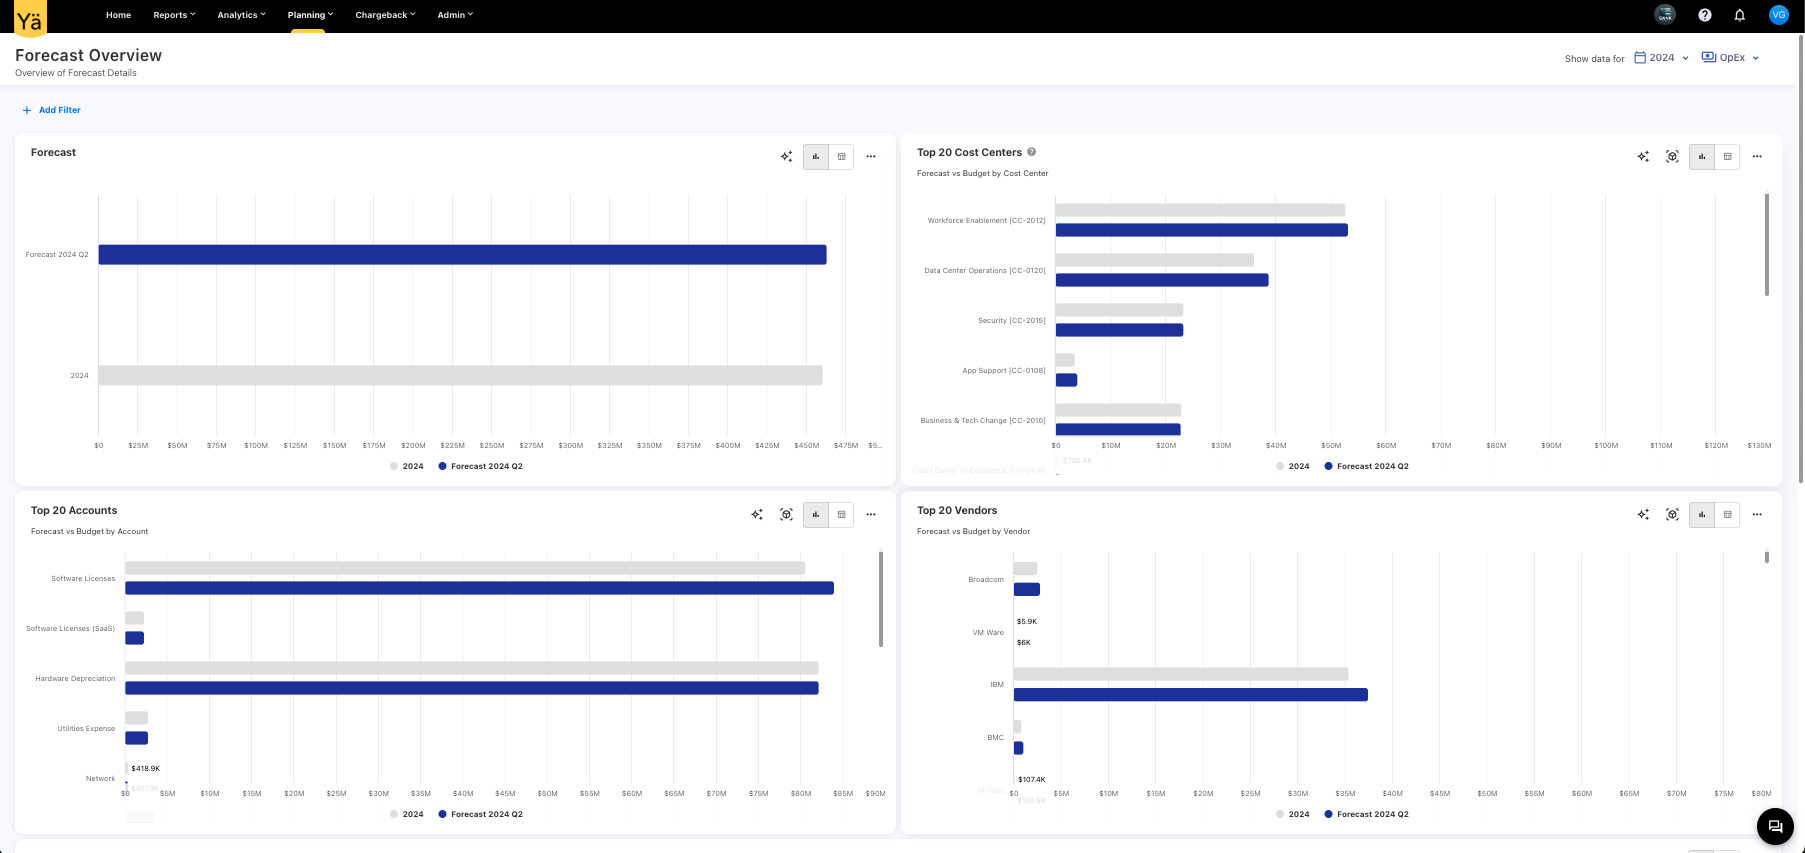
Forecast Overview
We have introduced a new Forecast Overview dashboard under the Planning menu to provide a comprehensive analysis of forecasted spending. This dashboard compares the forecasted values against the approved budget, visualizing monthly forecasted trends for better financial planning. The charts on this dashboard allow you to identify the top 20 vendors, cost centers, accounts with the highest forecasted spend. The Monthly Forecast Details charts provide a forecasted spending pattern on a month-by-month basis.
Top Values on Tooltip
We’ve improved the manual mapping experience with the value preview feature. On the manually mapping screen, the application now displays the top three unique values as a tooltip when hovering over the field. This helps you to quickly identify the most relevant values mapping without searching through the field.
February 24, 2025
Enhancement
Upload Rules - Comment Box
We have enhanced upload rules by adding a commenting feature on it. Users can now add optional comments when creating or modifying rules. These comments are also included in the downloaded and uploaded file for reference. Additionally, two new columns—Updated On and Updated By—have been introduced to track the updates in the upload rule.
February 10, 2025
Enhancements
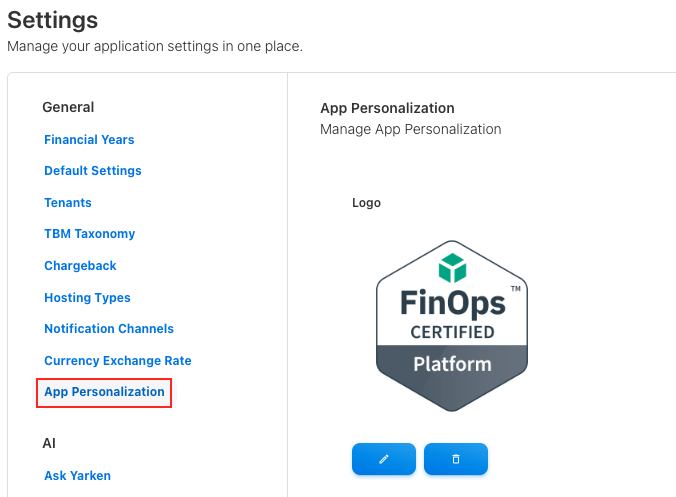
Custom Logo on Menu bar
Our platform now includes a new personalization option that enables you to load a custom logo on the menu bar. This enhancement provides businesses more flexibility to personalize their interface within the applications. With this update, you can upload your company logo or any custom image to the menubar.

Users can easily upload their preferred logo or image through the platform’s settings menu. The uploaded logo will replace the default icon and appear prominently on the menu bar. The platform supports a variety of image formats and automatically adjusts the logo’s size to fit the menu bar.
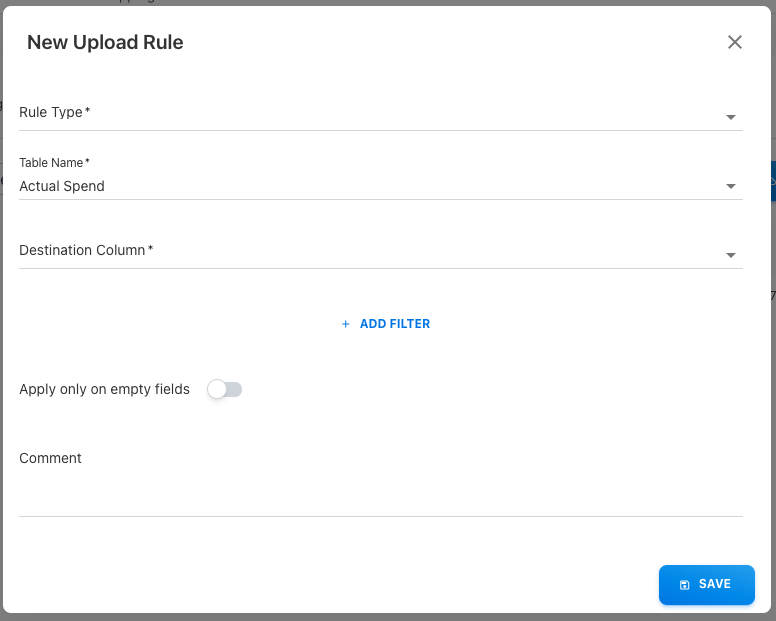
Extract Column - A New Rule Type
A new rule type called Extract Column has been introduced in the upload rules functionality. This rule type allows users to extract specific data during file uploads. The data is extracted from text fields by defining a Regex Pattern (regular expression).
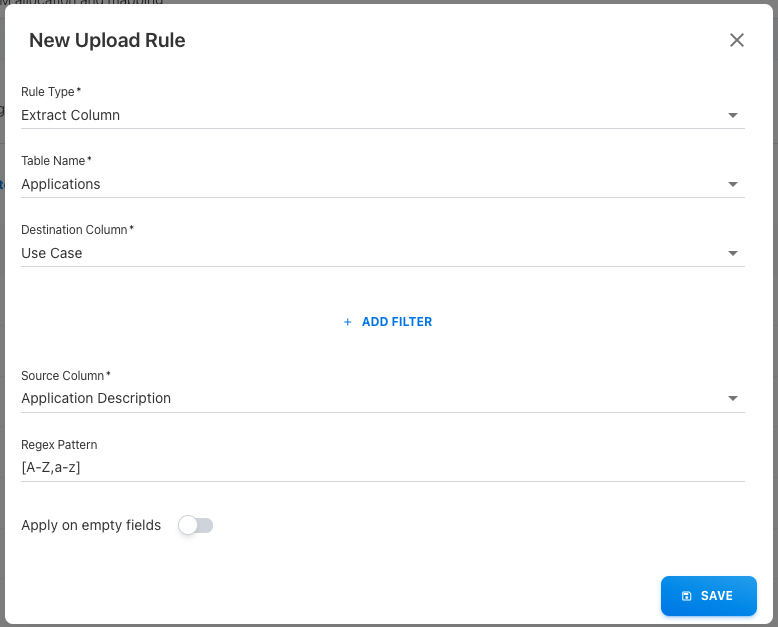
By specifying a regex pattern, users can target and extract specific portions of text or any custom data format. The extracted data can then be mapped to the destination column. This new rule type provides flexibility in the data extraction process by identifying the data patterns.
Forecasting on Standard Dashboards
The bar, column, and cumulative charts that compare spend against budget now includes a third parameter for forecast comparison. If no forecast or budget values are available, the chart will not display any values.
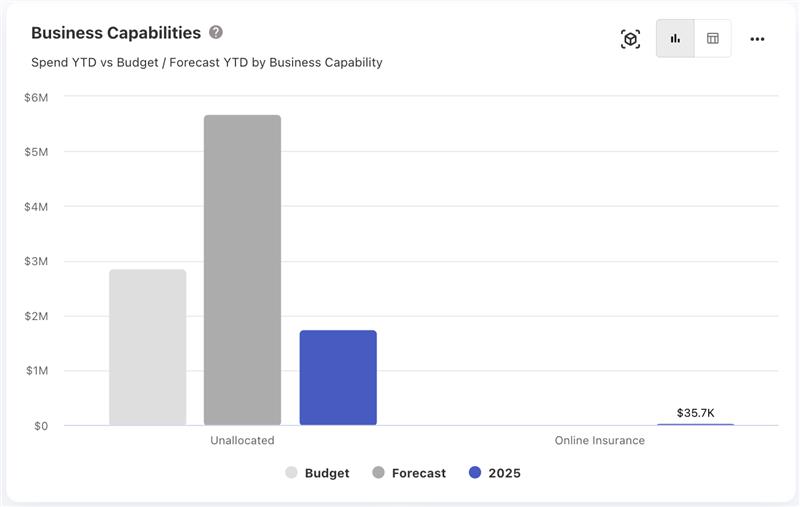
If no forecast or budget values are available, the chart will not display any values. For cumulative prediction charts, the forecast values will be used for spend predictions if available. If no forecast is provided, the system will revert to the usual logic of predicting spend based on the average.
January 27, 2025
January 06, 2025