
December 16, 2024
Cloud Usage File
When loading the multiple cloud usage files in a single month using Integration feature, the system now appends the data rather overwrites. This applies only when file are loaded from same folder within container or bucket storage using integrations.
December 09, 2024
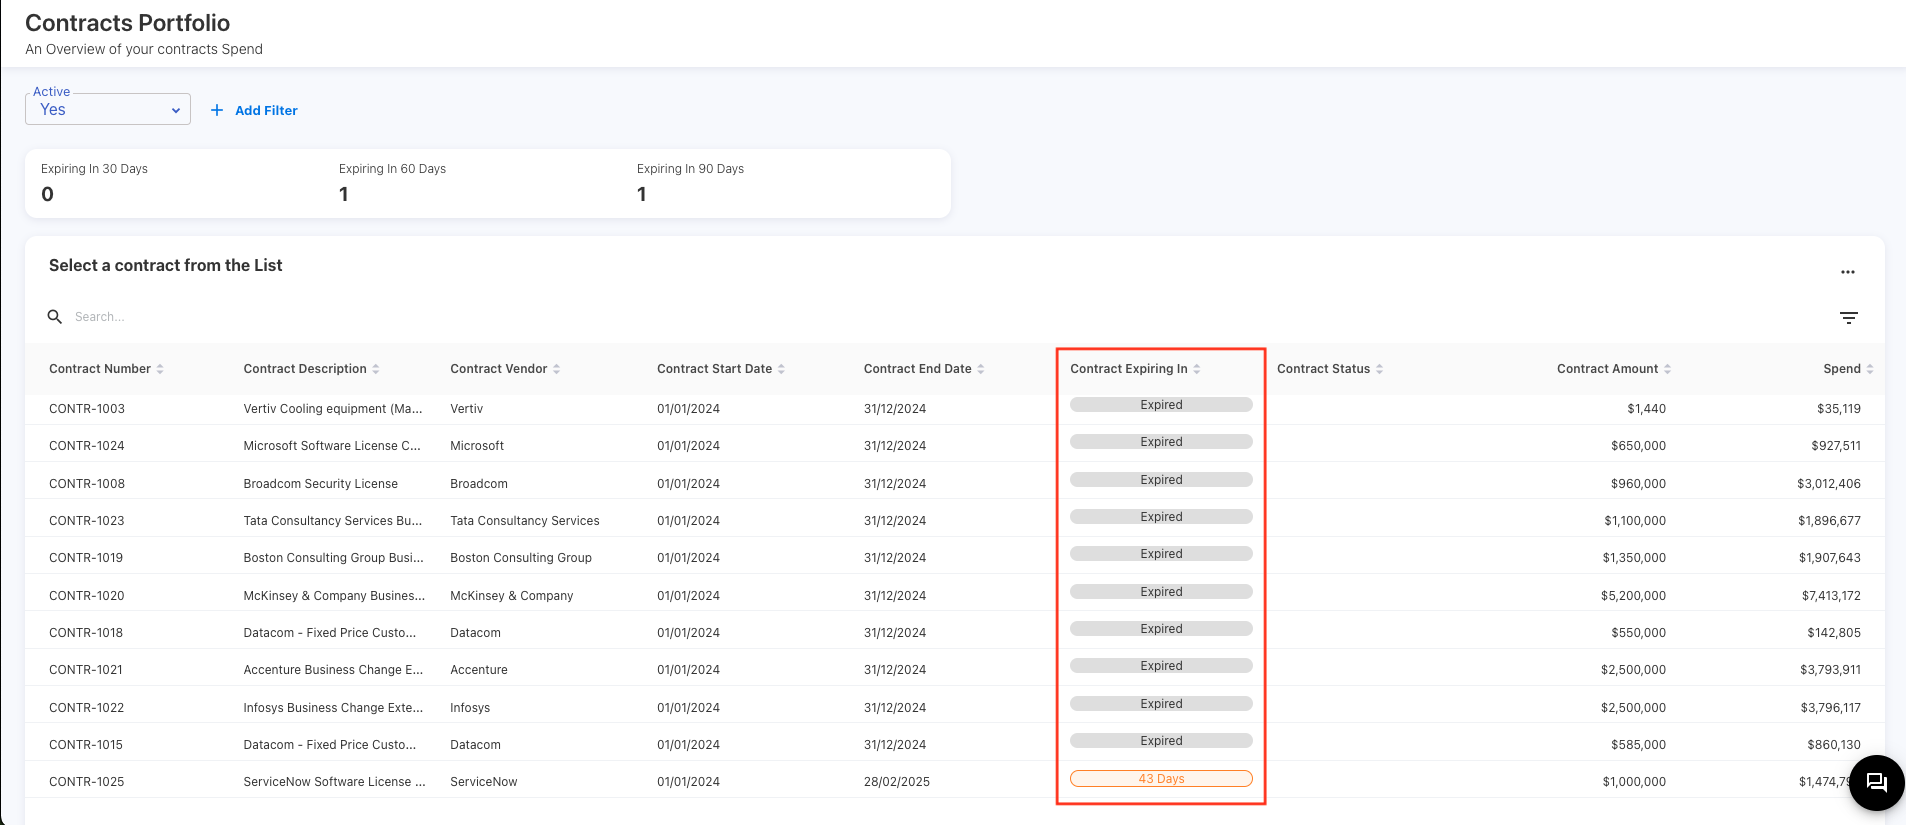
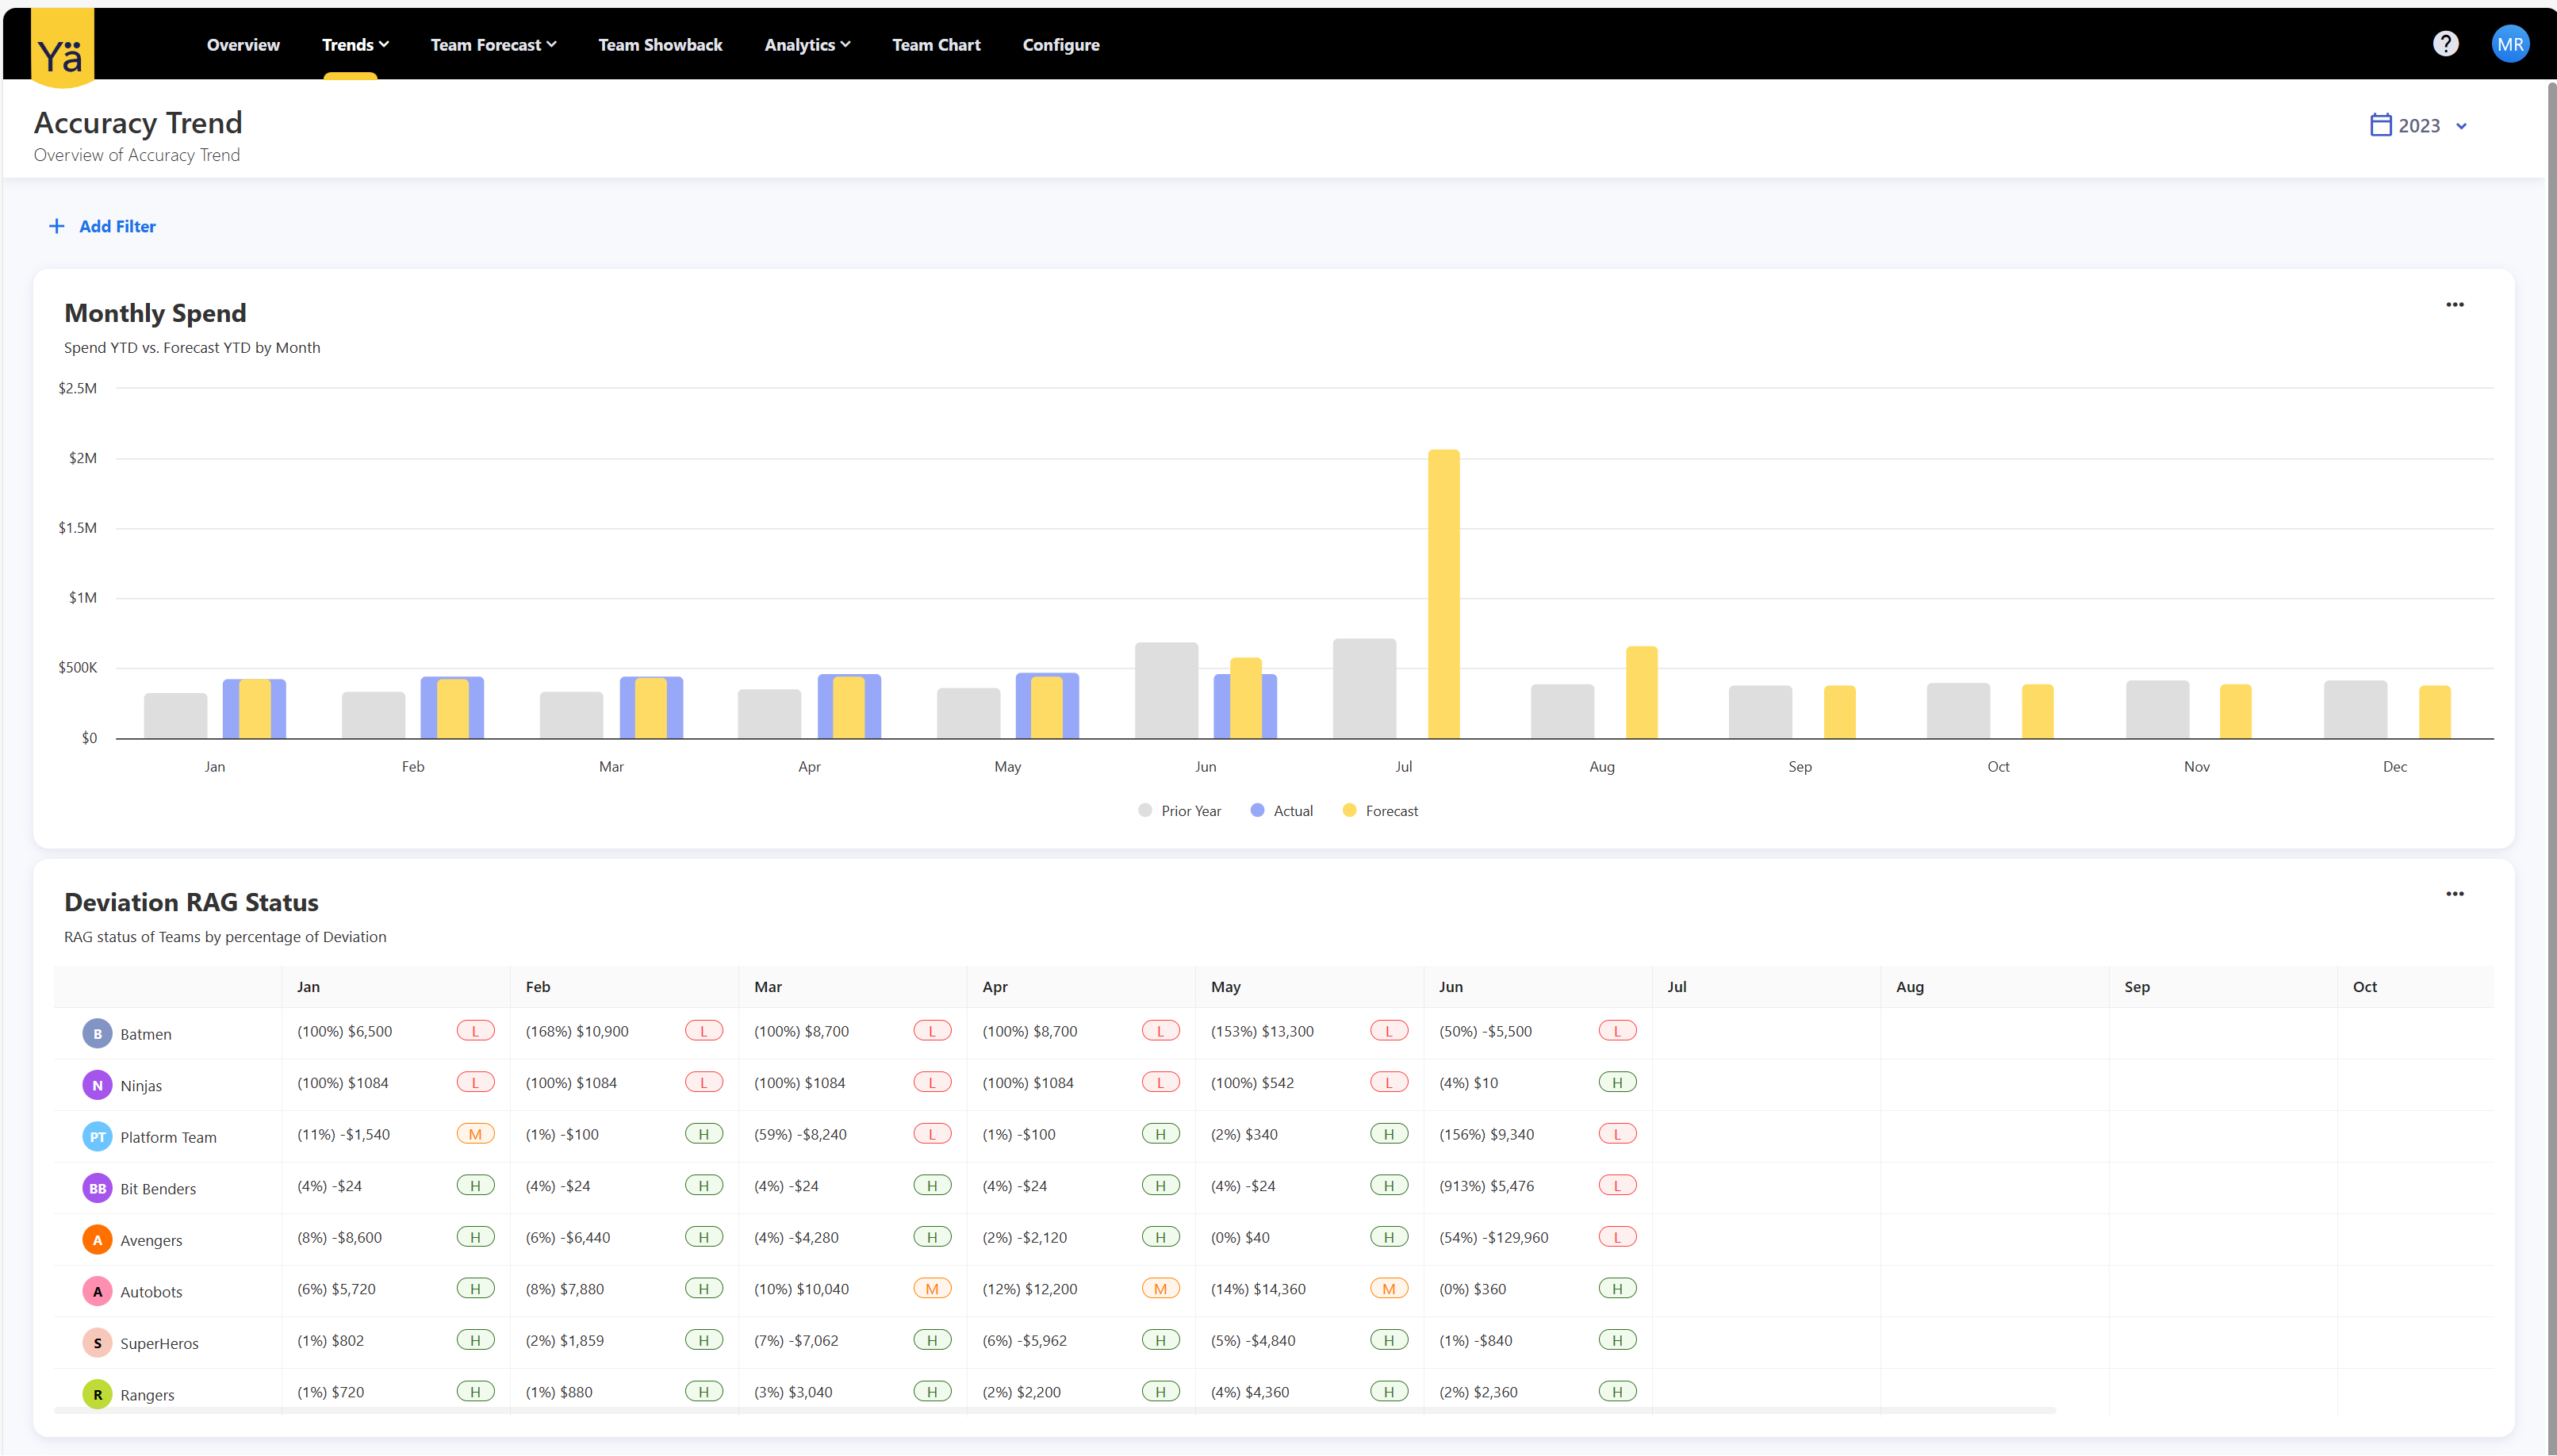
Contracts Portfolio - Expiry Dates
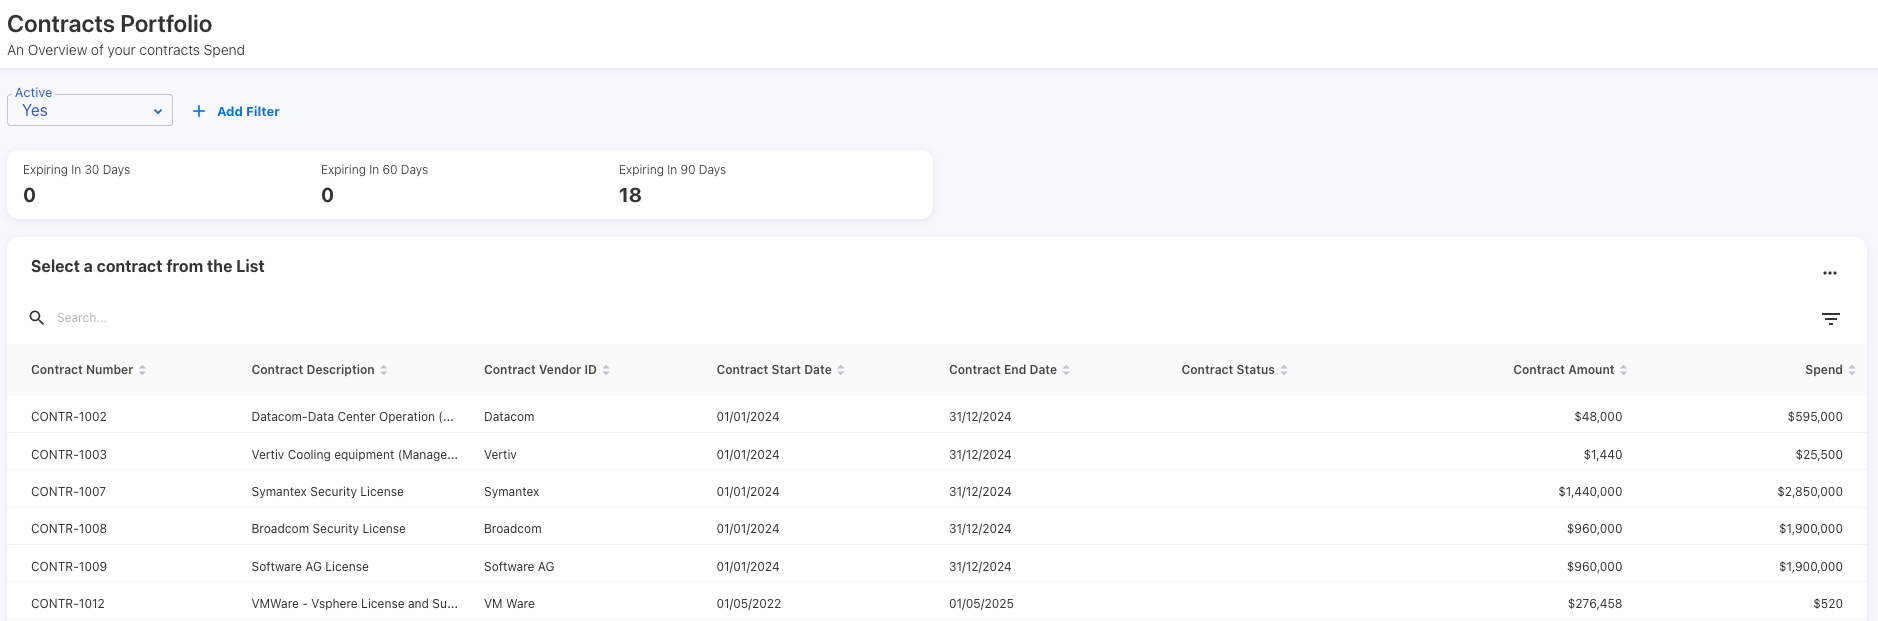
A new column called Contract Expiring In has been added to the Contracts Portfolio dashboard. This column displays the number of days for the contract to be expired.
December 02, 2024
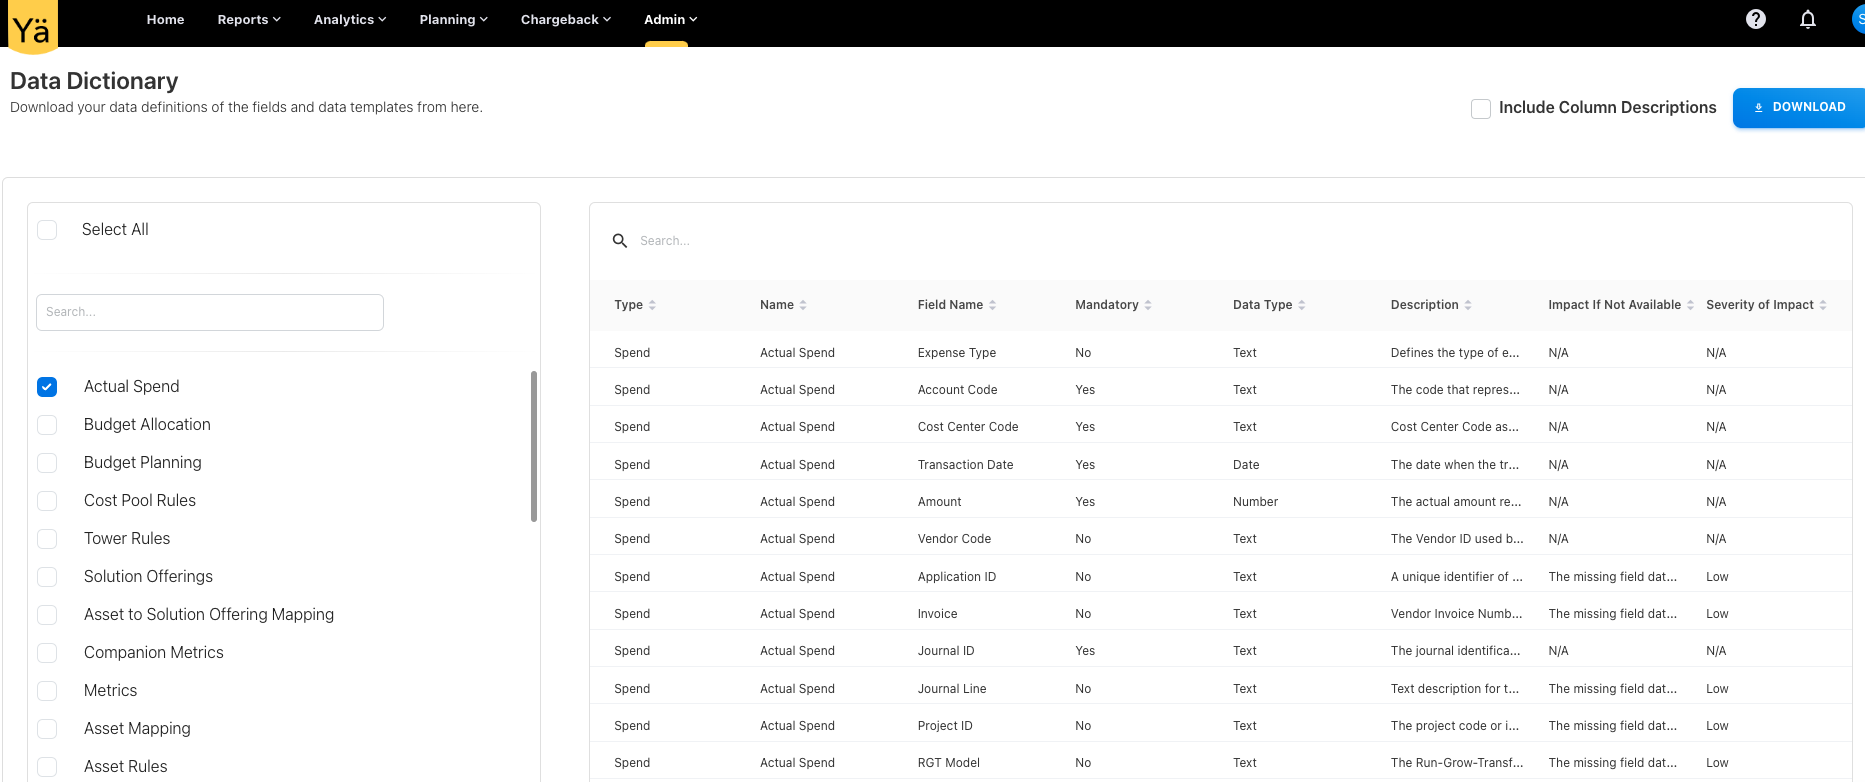
Data Dictionary
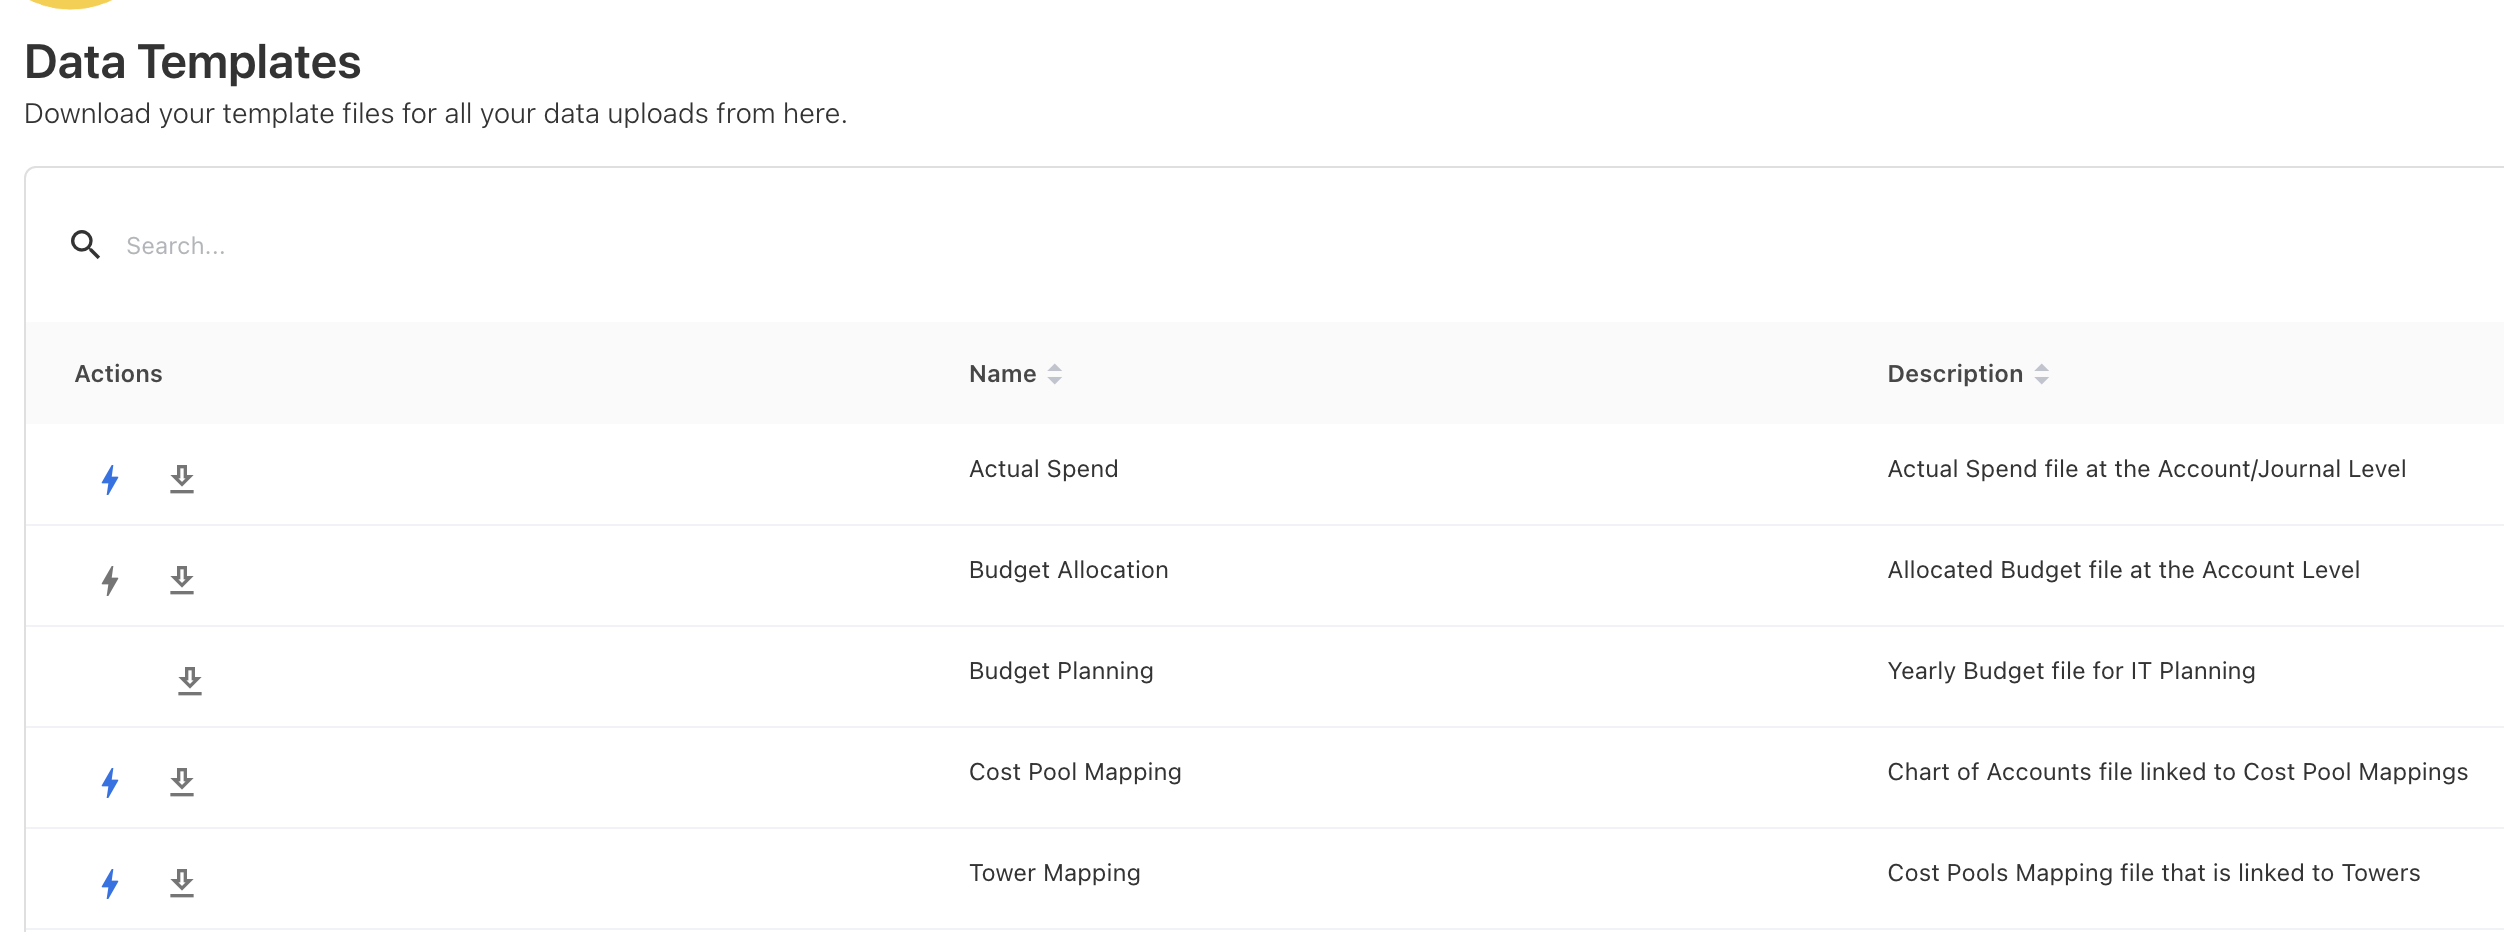
Data Dictionary is now part of the data definitions. An option to view and download the data fields is made available in the application. The data dictionary includes the information about the field description, mandatory or non-mandatory fields, data types, impact if field not mapped, and severity of impact.
The previous functionality for downloading data template files has been incorporated into this data dictionary.
November 18, 2024
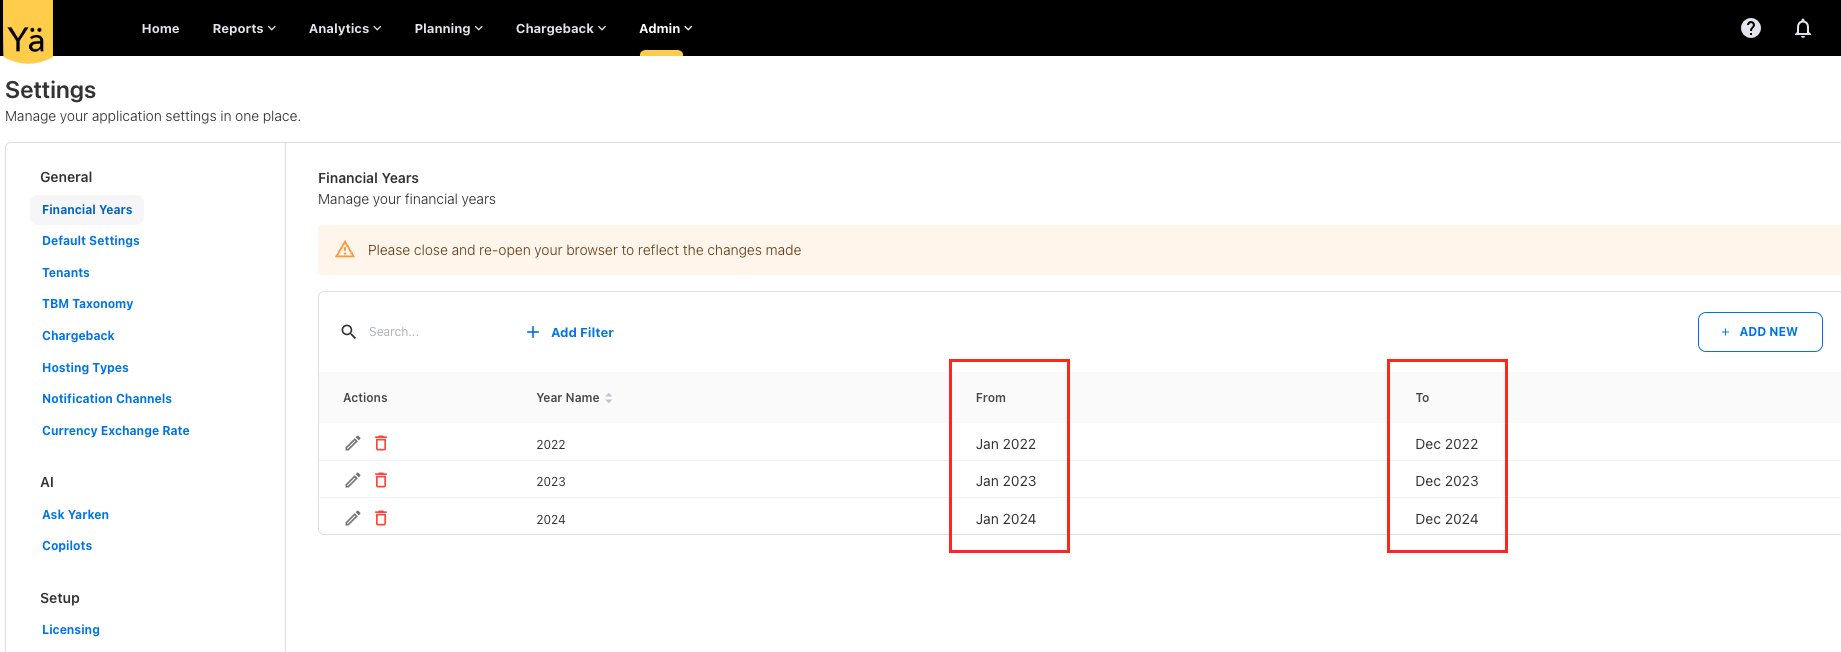
Financial Years
We have added two new columns to the Financial Years setting to show the start and end months of the financial year.
November 11, 2024
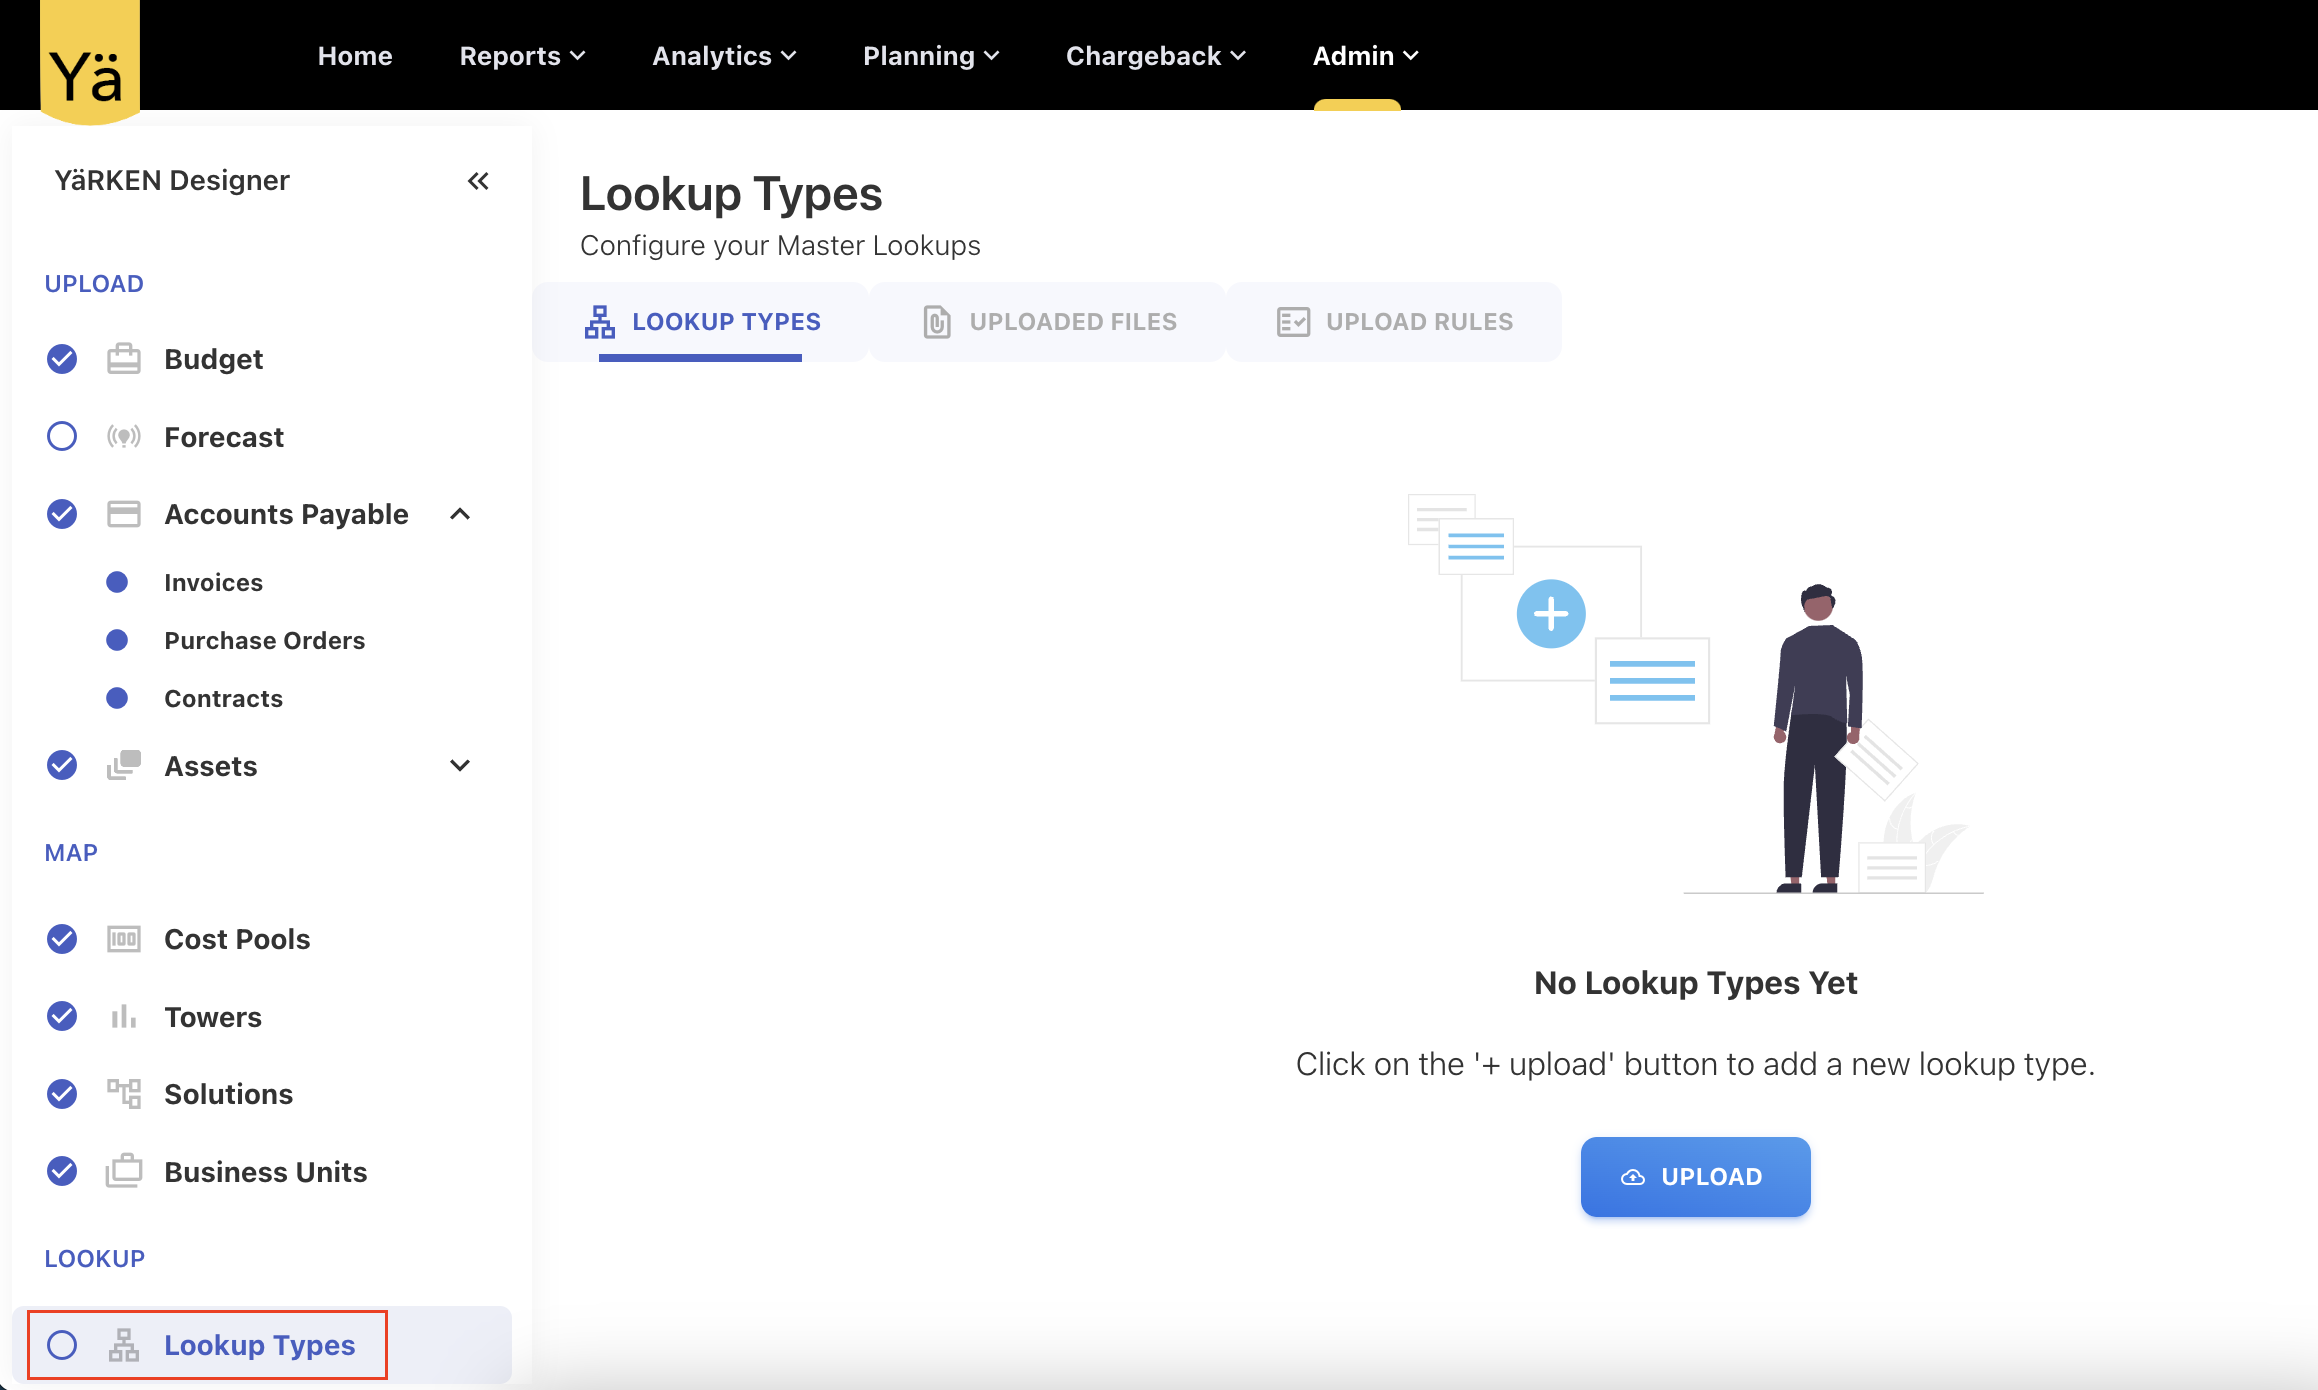
Lookup Types
Introduced a Lookup Types to configure the master lookups.
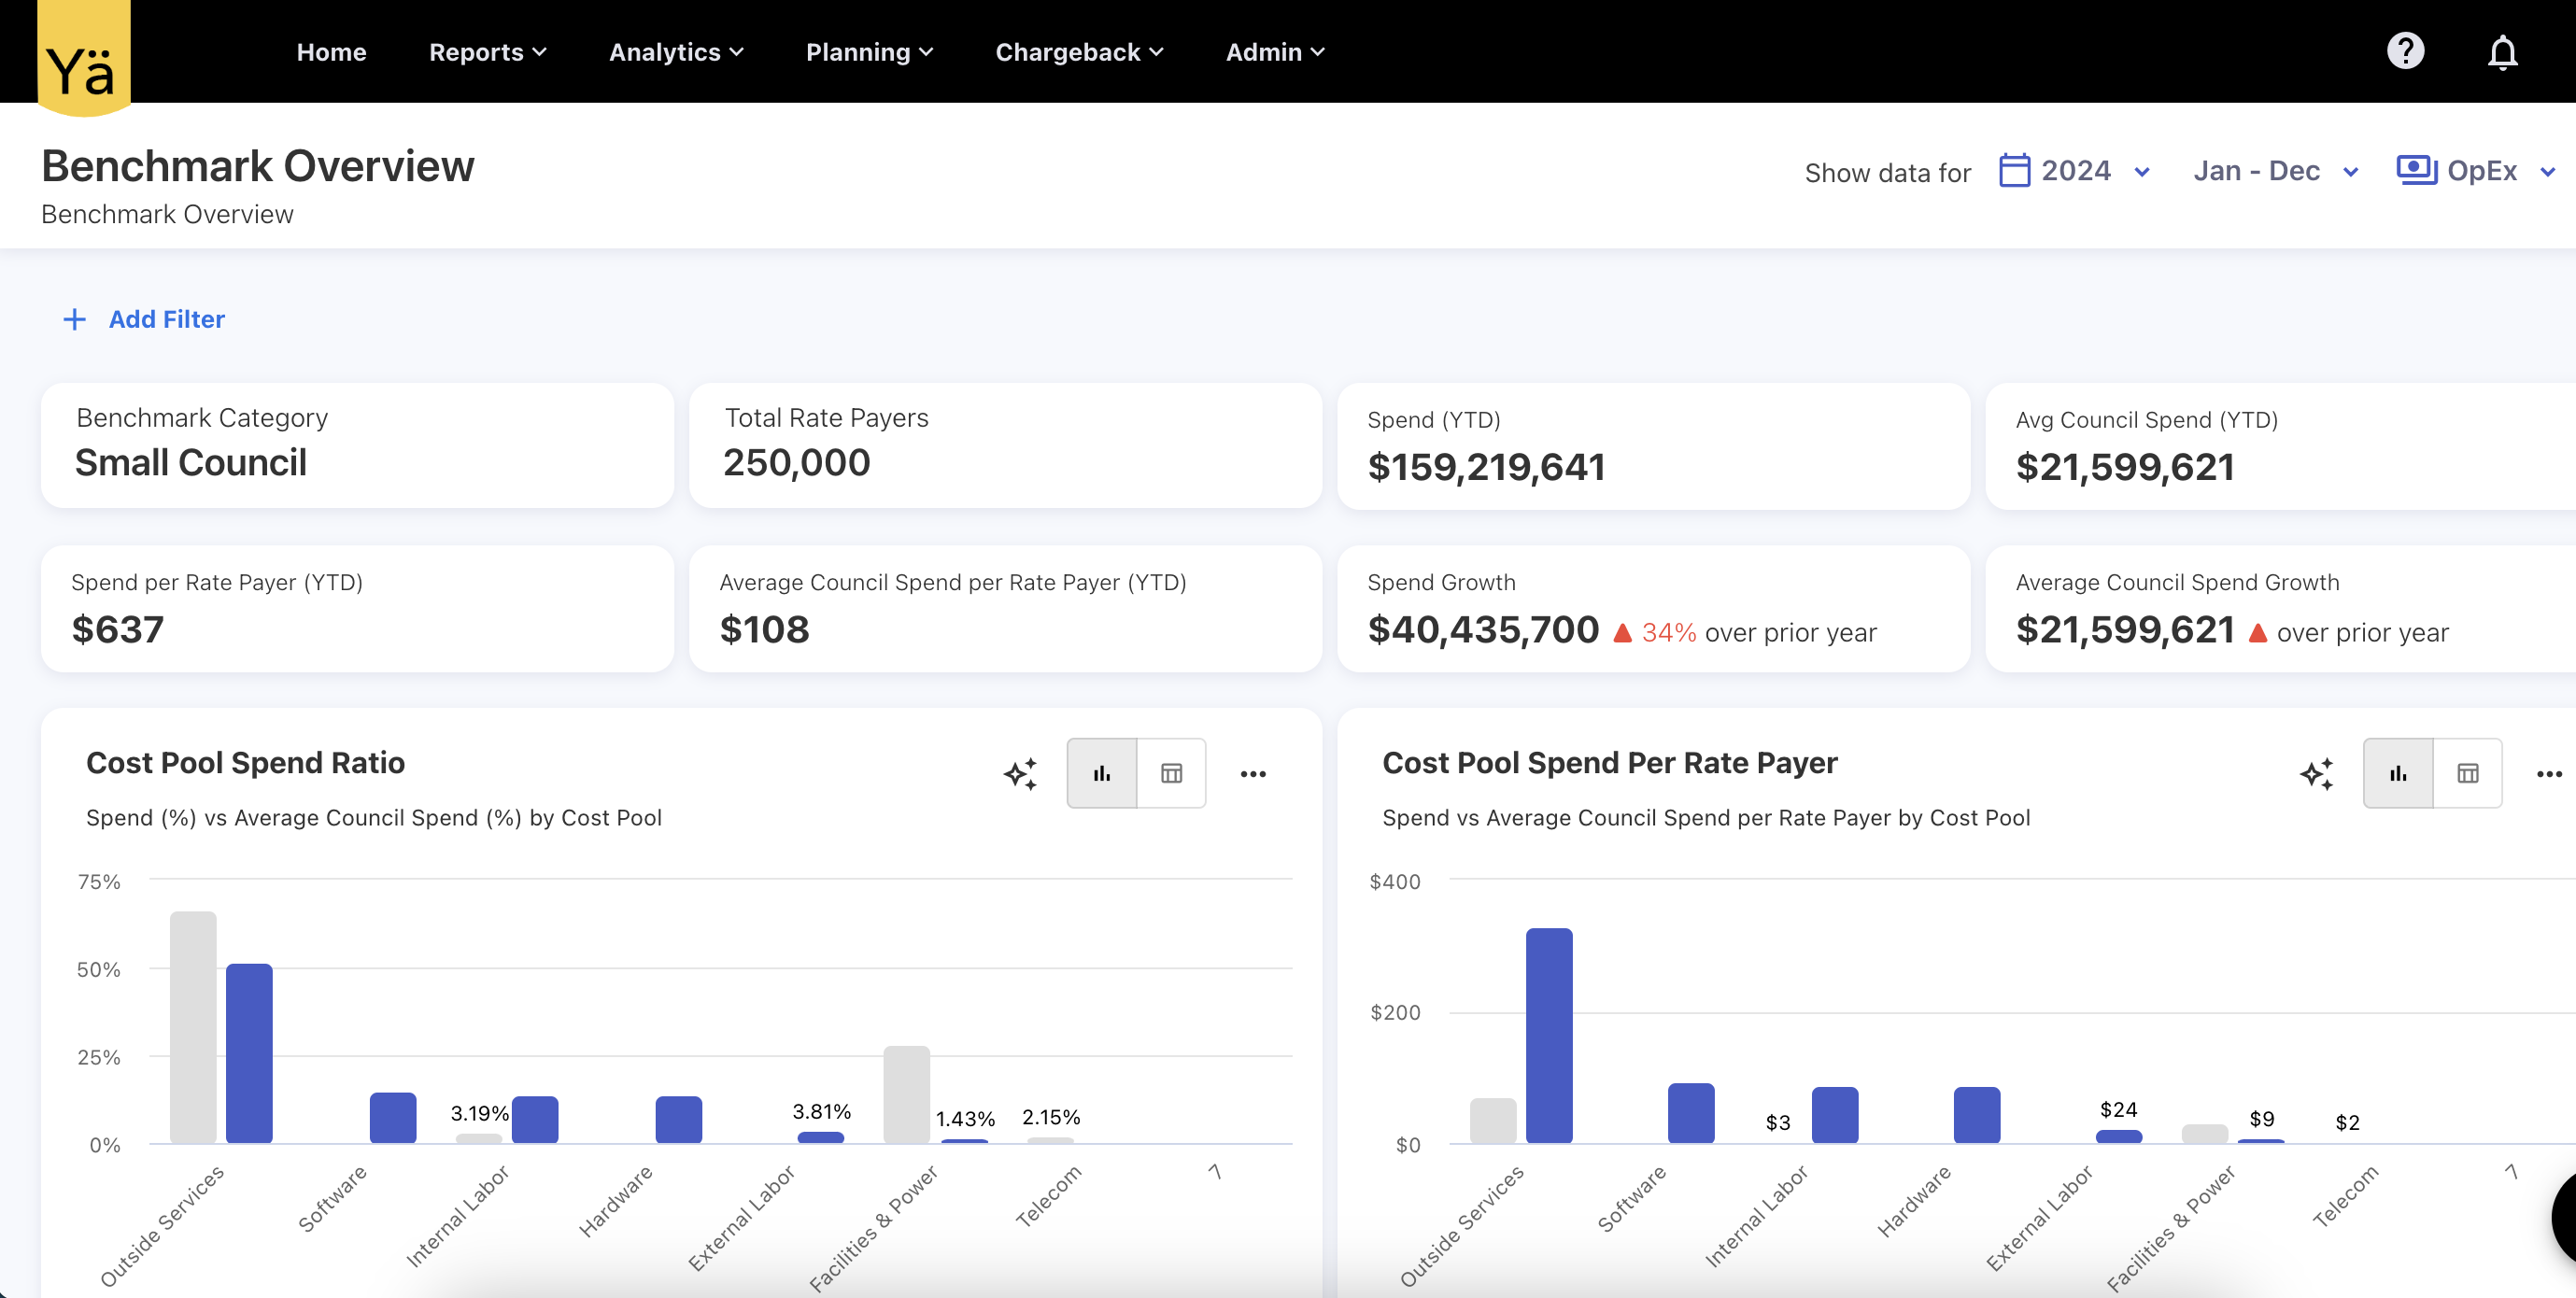
Benchmark Overview Dashboard
A Benchmark Overview dashboard offers an instant visibility into benchmarking parameters set by your organizations.
October 28, 2024
Greenpixie Fields
We’ve enhanced the cloud consumption upload feature by adding new fields that supports the Greenpixie’s cloud sustainability data. Users can choose to include cloud emission data for cloud reporting. This integration enables the tracking and reporting of cloud-related carbon emissions as well as other consumption, such as power and water consumption, for major cloud providers like AWS and Azure. The new greenpixie fields are:
-
estimate_type
-
usage_electricity_consumption_kwh
-
usage_emissions_tonnes_co2e
-
manufacturing_emissions_tonnes_co2e
-
total_combined_emissions_tonnes_co2e
-
water_consumption_cooling_litres
-
water_consumption_electricity_production_litres
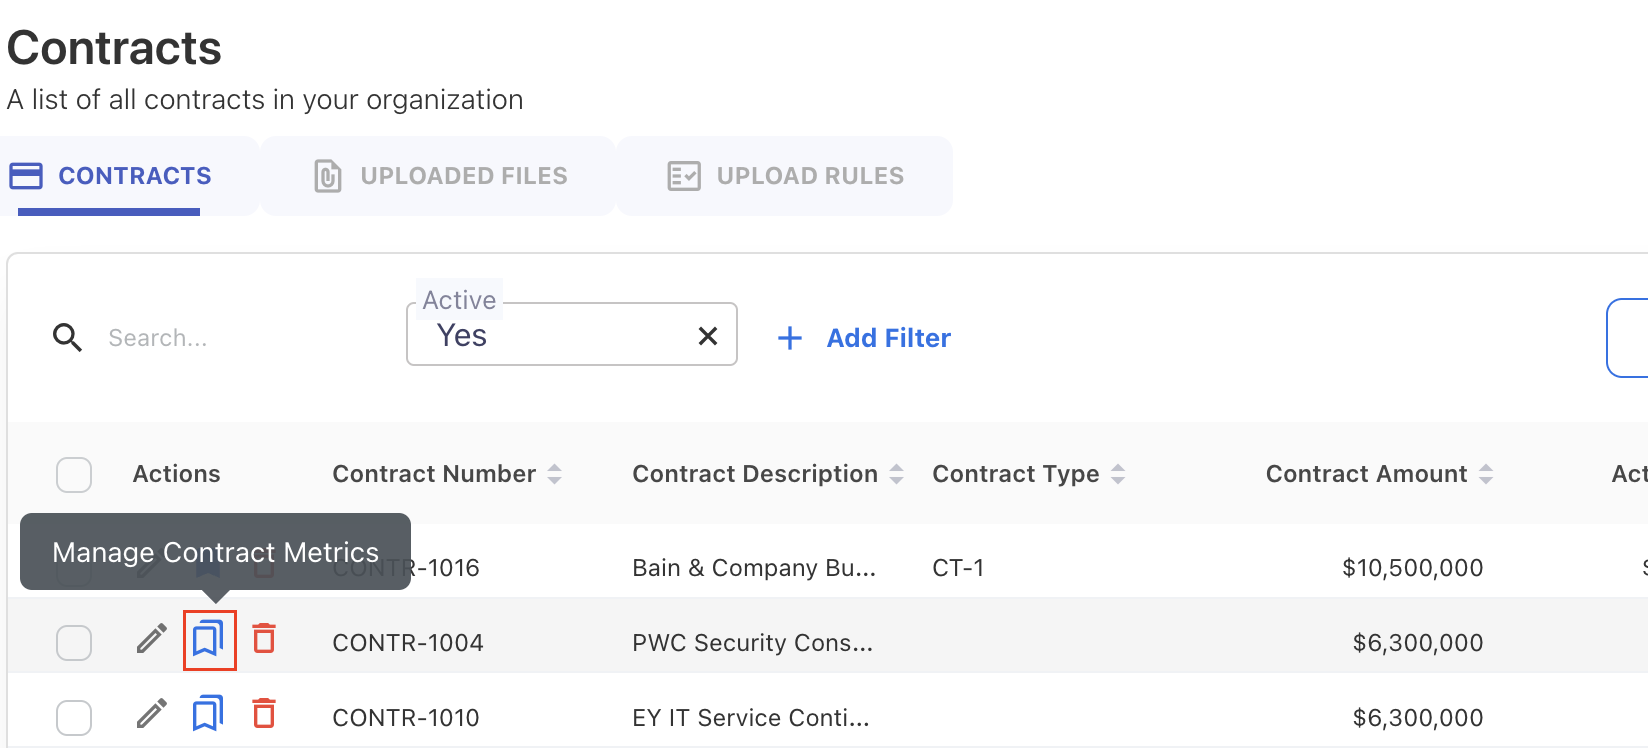
Manage Contract Metrics
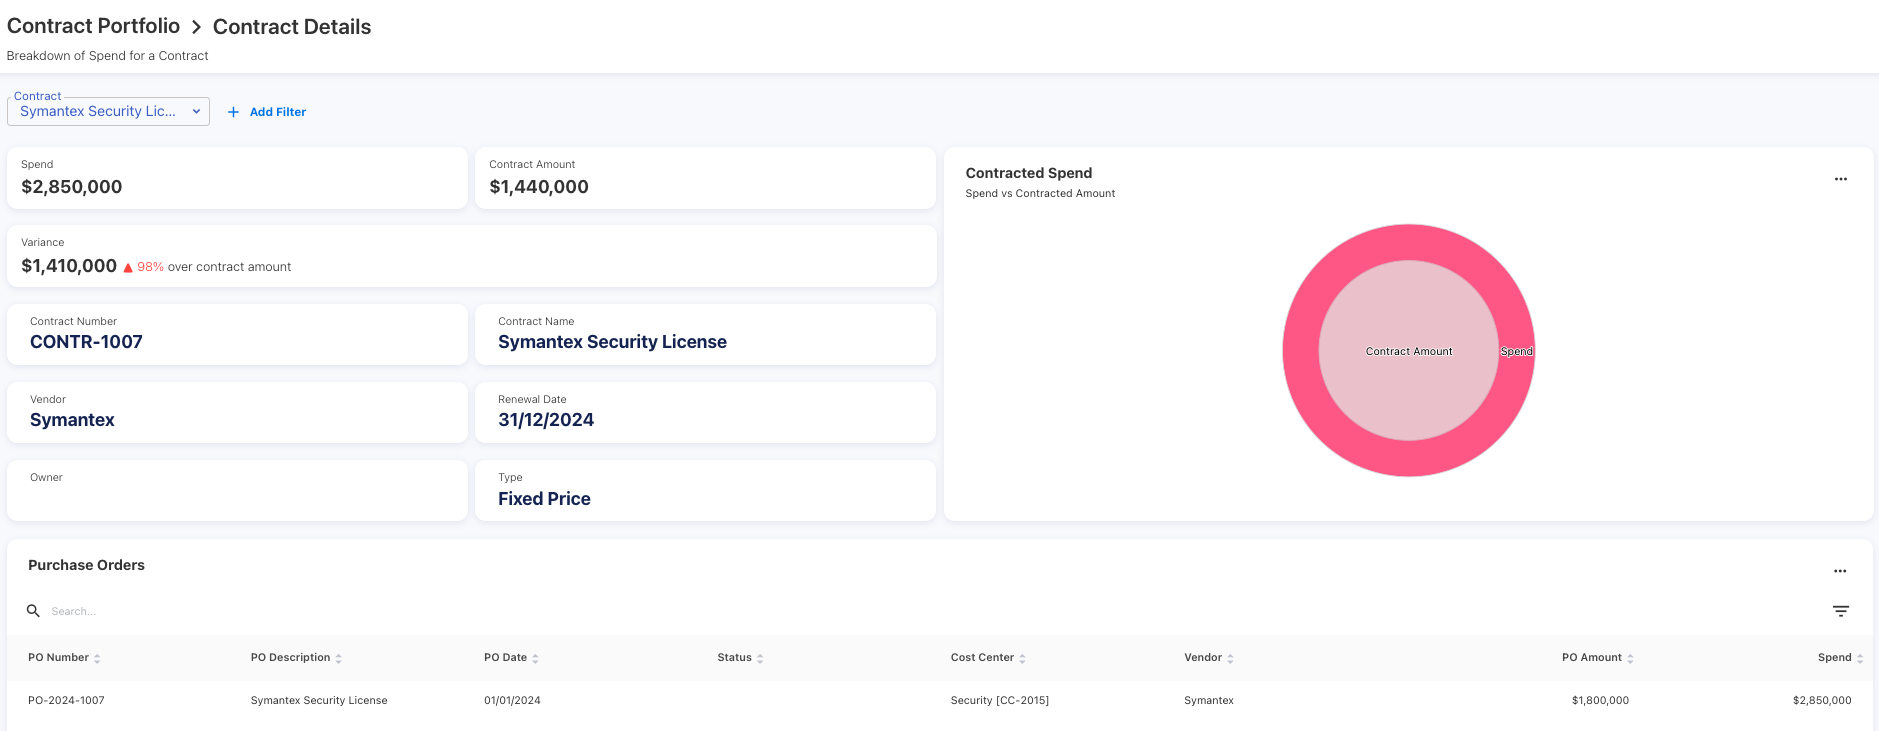
The Manage Contract Metrics allows users to link specific metrics with each contract. It is helpful to measure the deliverables and monitor vendor performance when managing contracts. You can track these metrics from Contract Metrics chart in the Contract Portfolio dashboard.
October 14, 2024
Data Templates
We've introduced automatic updates for data template files. Now, whenever data definitions change within the application, the associated template files will be automatically updated to reflect these changes. This ensures that the template files are always up to date with the field definition.
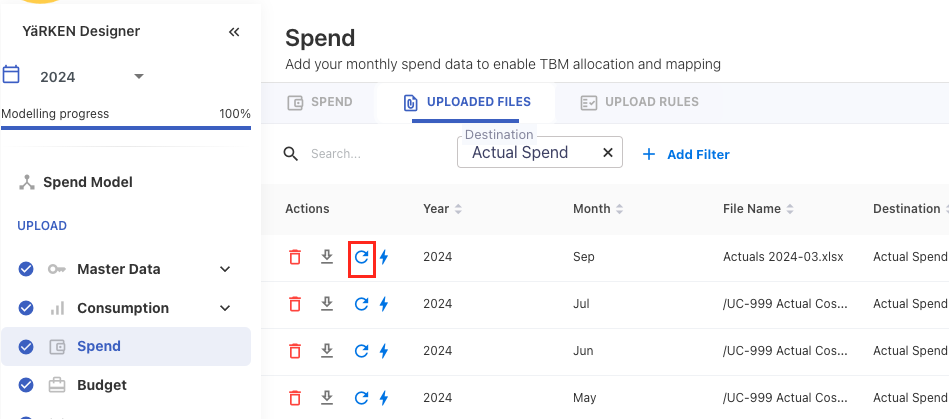
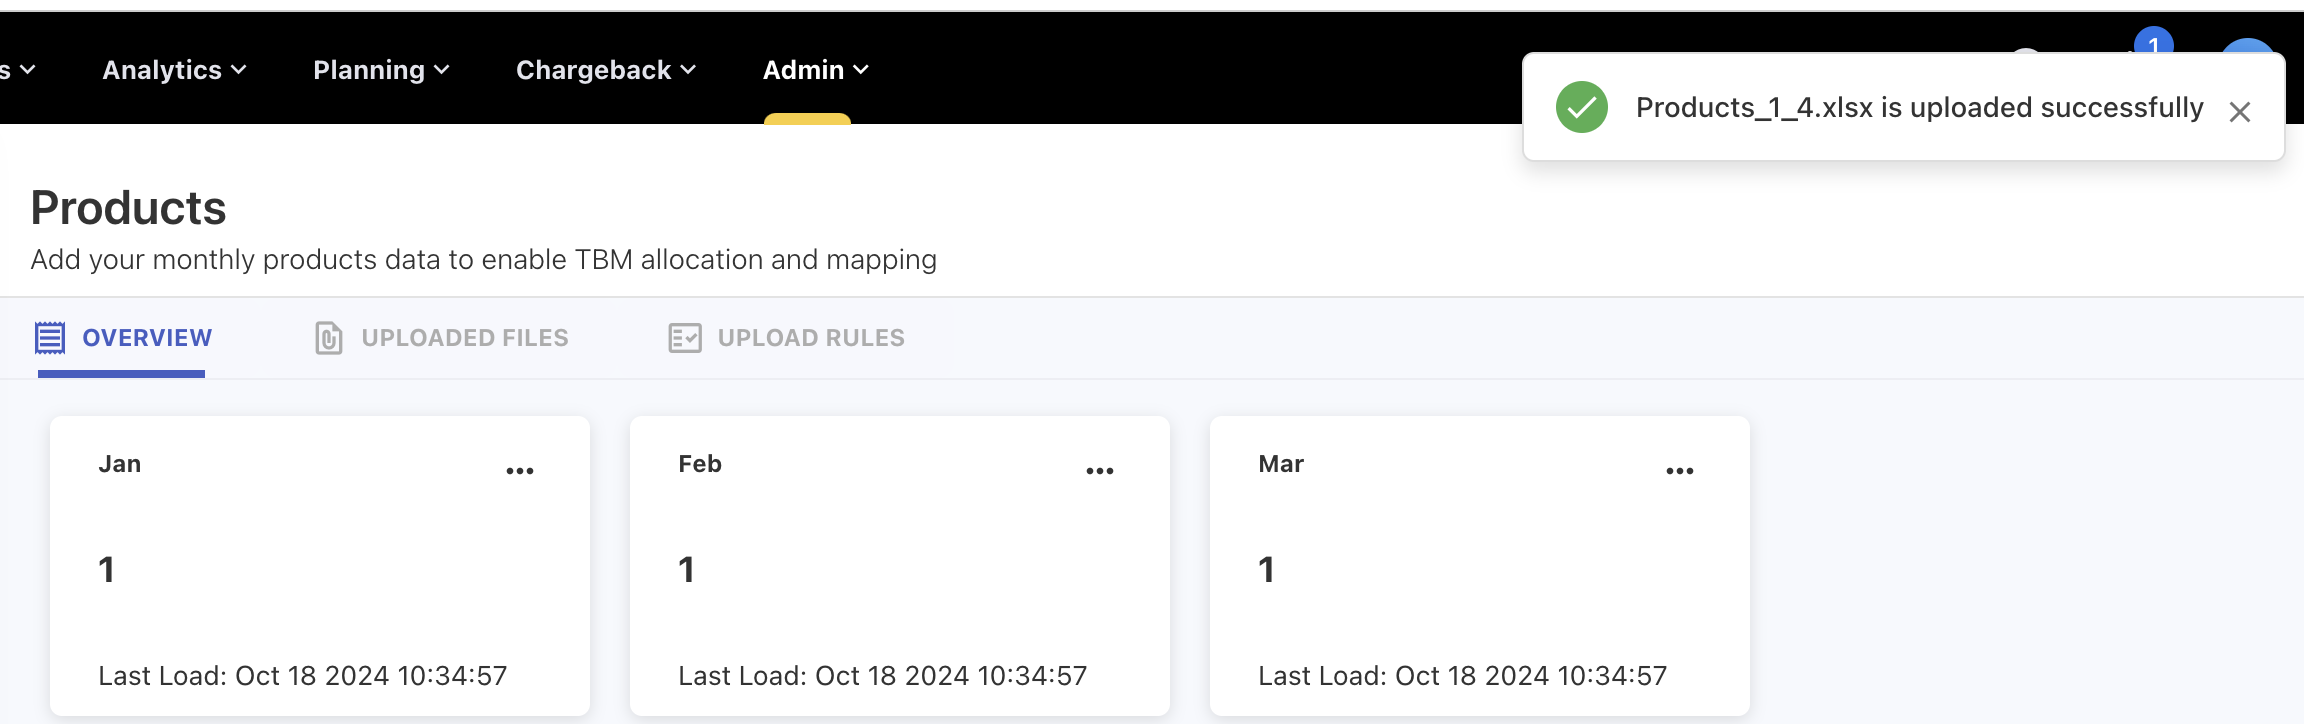
Spend Reload
A spend reload button has been added under the UPLOADED FILES tab for reloading of spend file in case of any error occurs in the first upload.
October 07, 2024
Contract Portfolio
We have introduced a Contract Portfolio dashboard to provide a comprehensive view of contract details and spend. This dashboard allows users to monitor contracted spend, track purchase orders, and review invoices. The dashboard includes key insights such as:
-
Contracted Spend: A breakdown of contract spend and compares with actual spend.
-
Purchase Orders and Invoices: Charts showing the purchase orders and invoiced amounts.
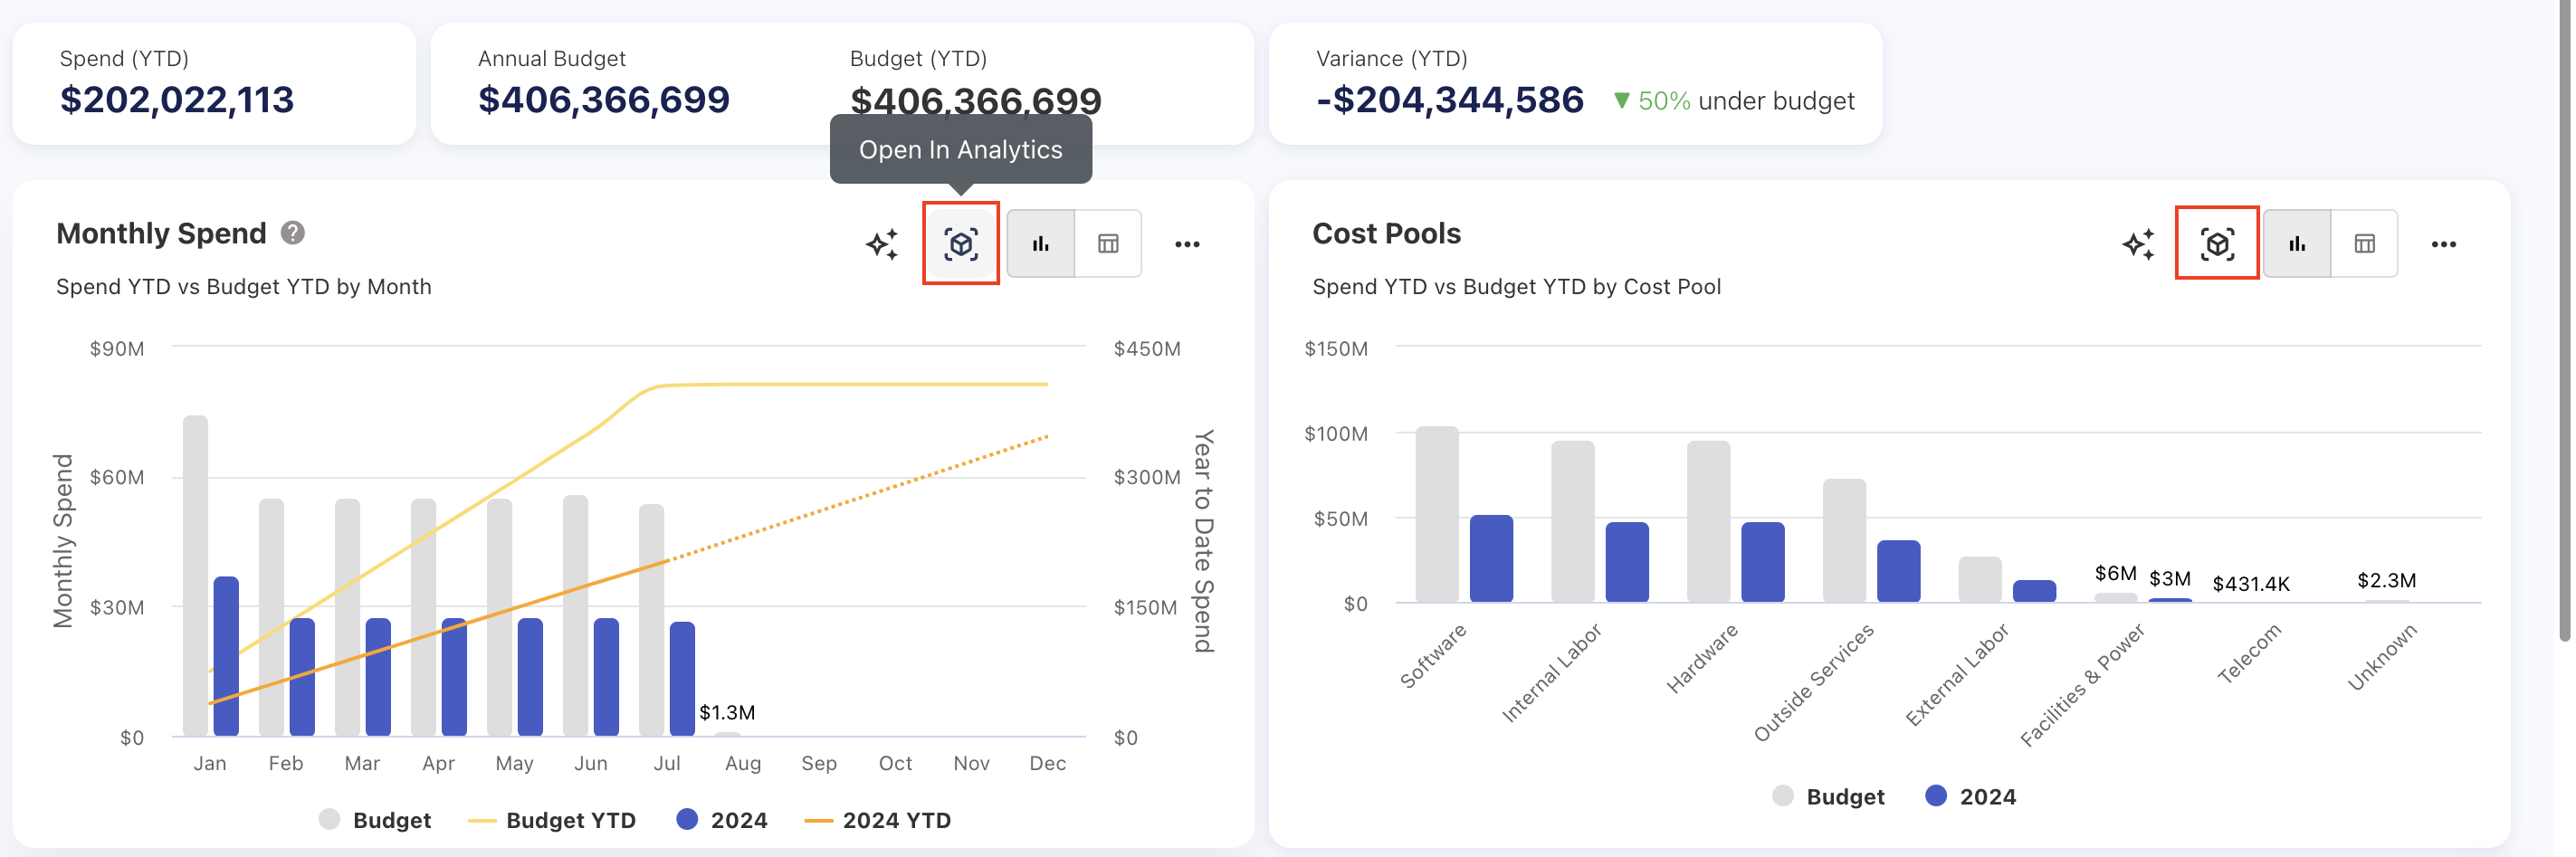
Opening a Dashboard and Report in Analytics
You can now open charts directly from dashboards and reports in the Analytics. This new functionality allows users to seamlessly access the charts in the Analytics, with pre-selected values, attributes, global filter criteria, and visualizations.
September 23, 2024
Data Load Popup
A data load popup is enabled to show the real-time feedback on the file upload process.
Commitment Coverage (%) Chart
The Commitment Coverage(%) chart is added in the Commitment Overview dashboard to track the monthly commitment coverage.
September 16, 2024
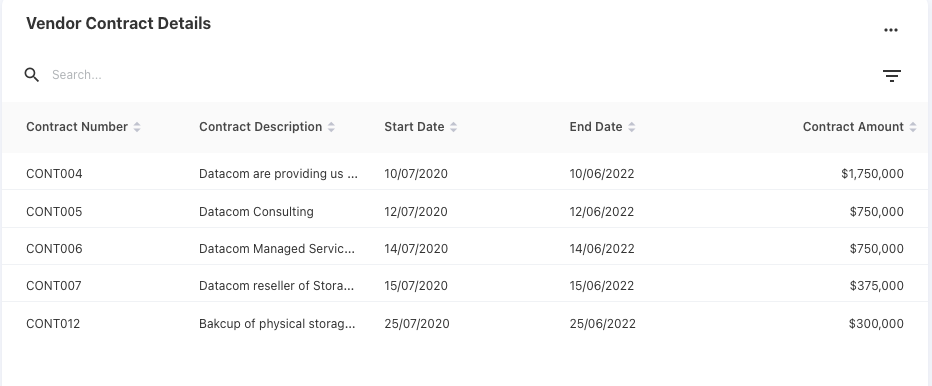
Vendor Contract Details
The Vendor Details report now includes a table to view the contract details of the particular vendor.
Investment Strategy: A new column
A new column, Investment Strategy, has been introduced in the Application asset. This field allows users to categorize and track the application spend based on investment strategies.
September 02, 2024
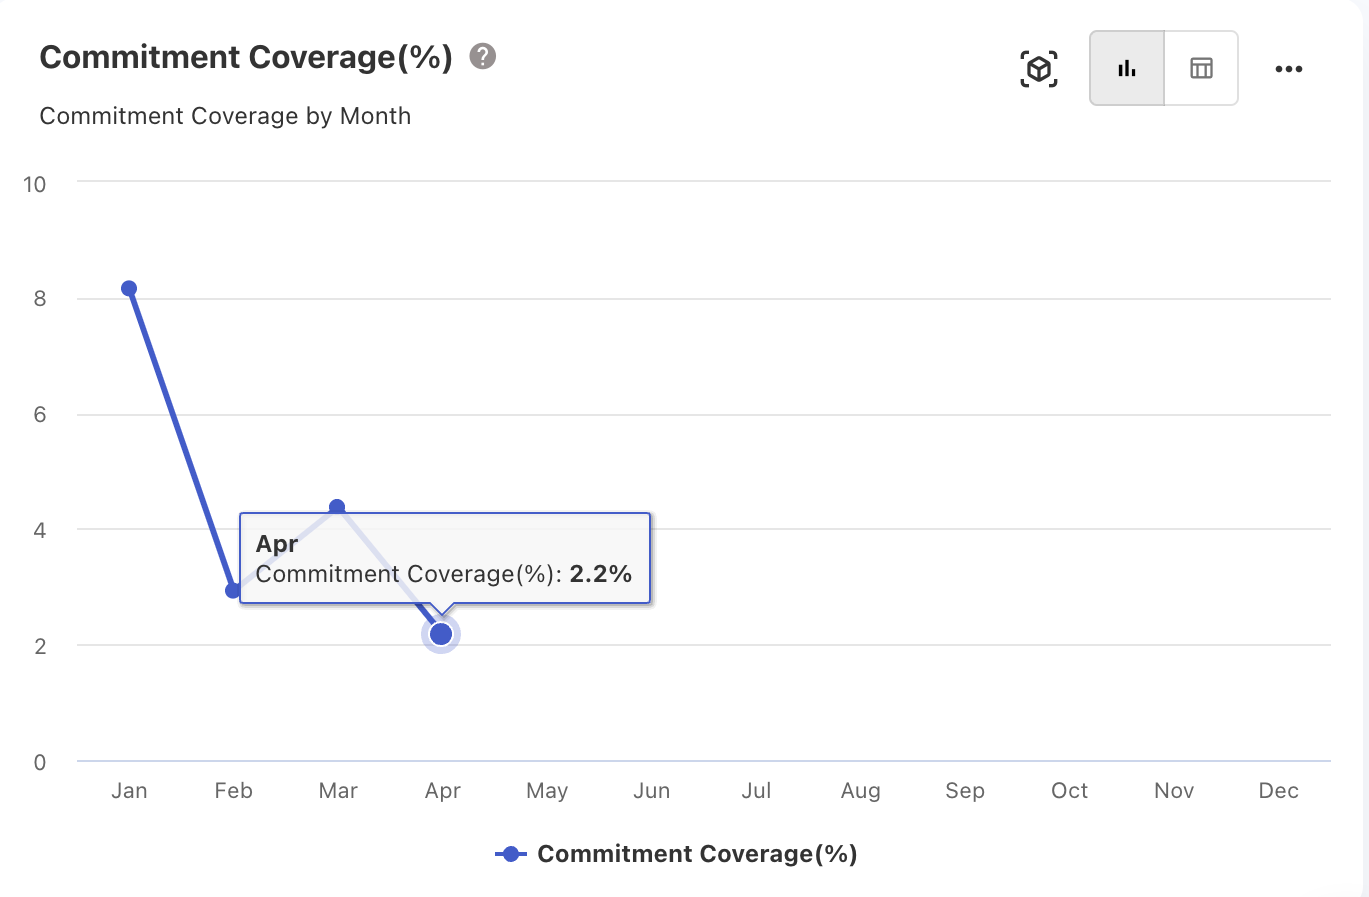
Commitment Coverage (%)
The Commitment Overview dashboard now includes a new Commitment Coverage (%) KPI. This KPI helps the users to understand how much of their total spend or usage is covered under commitment-based discount agreements.
-20240919-055047.png?cb=5a3f446981879efa3f998d3510088b17)
August 26, 2024
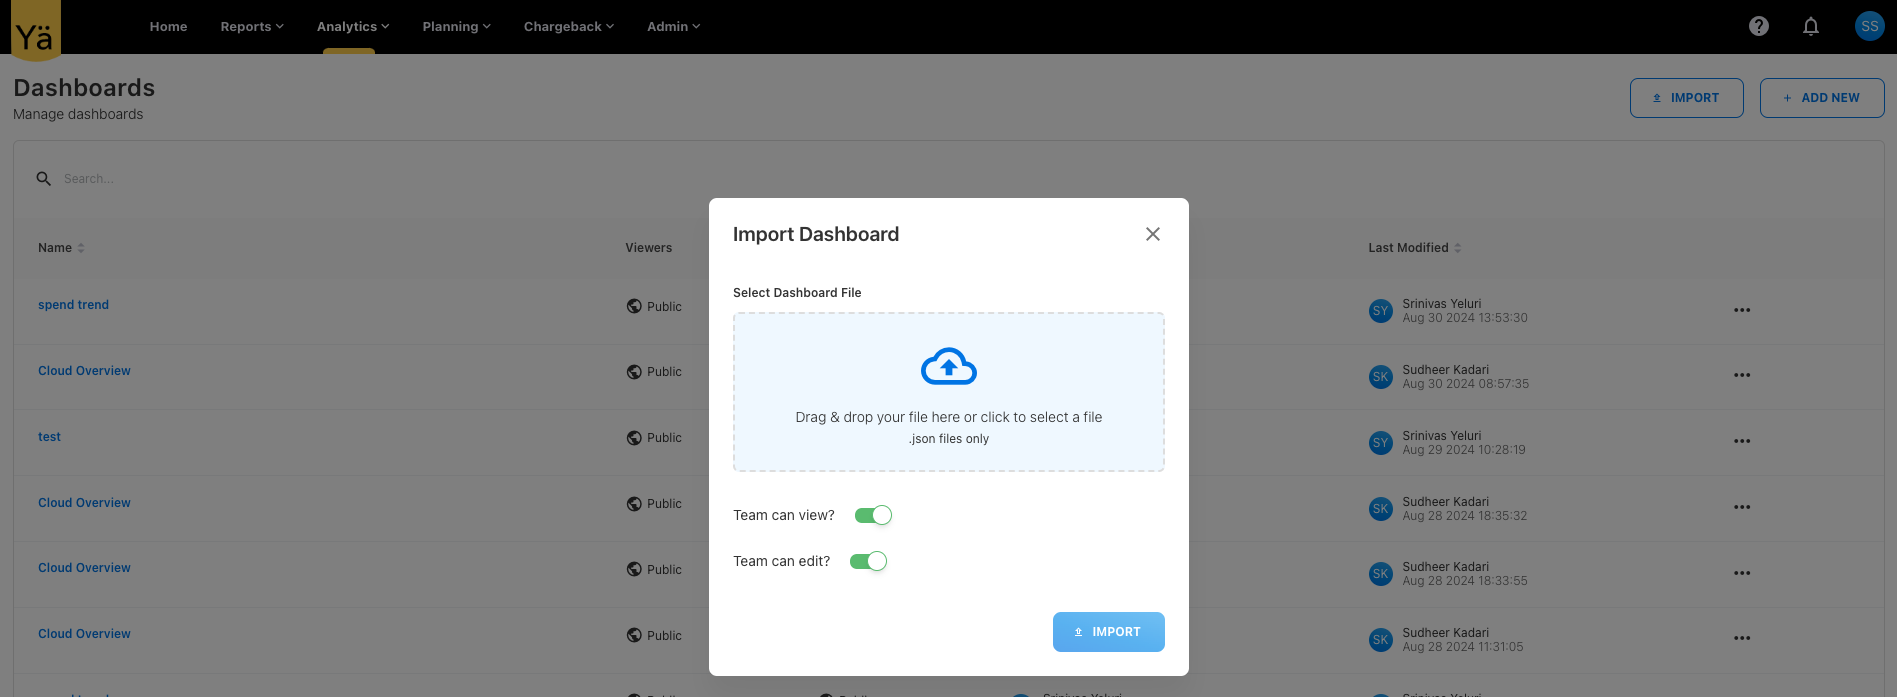
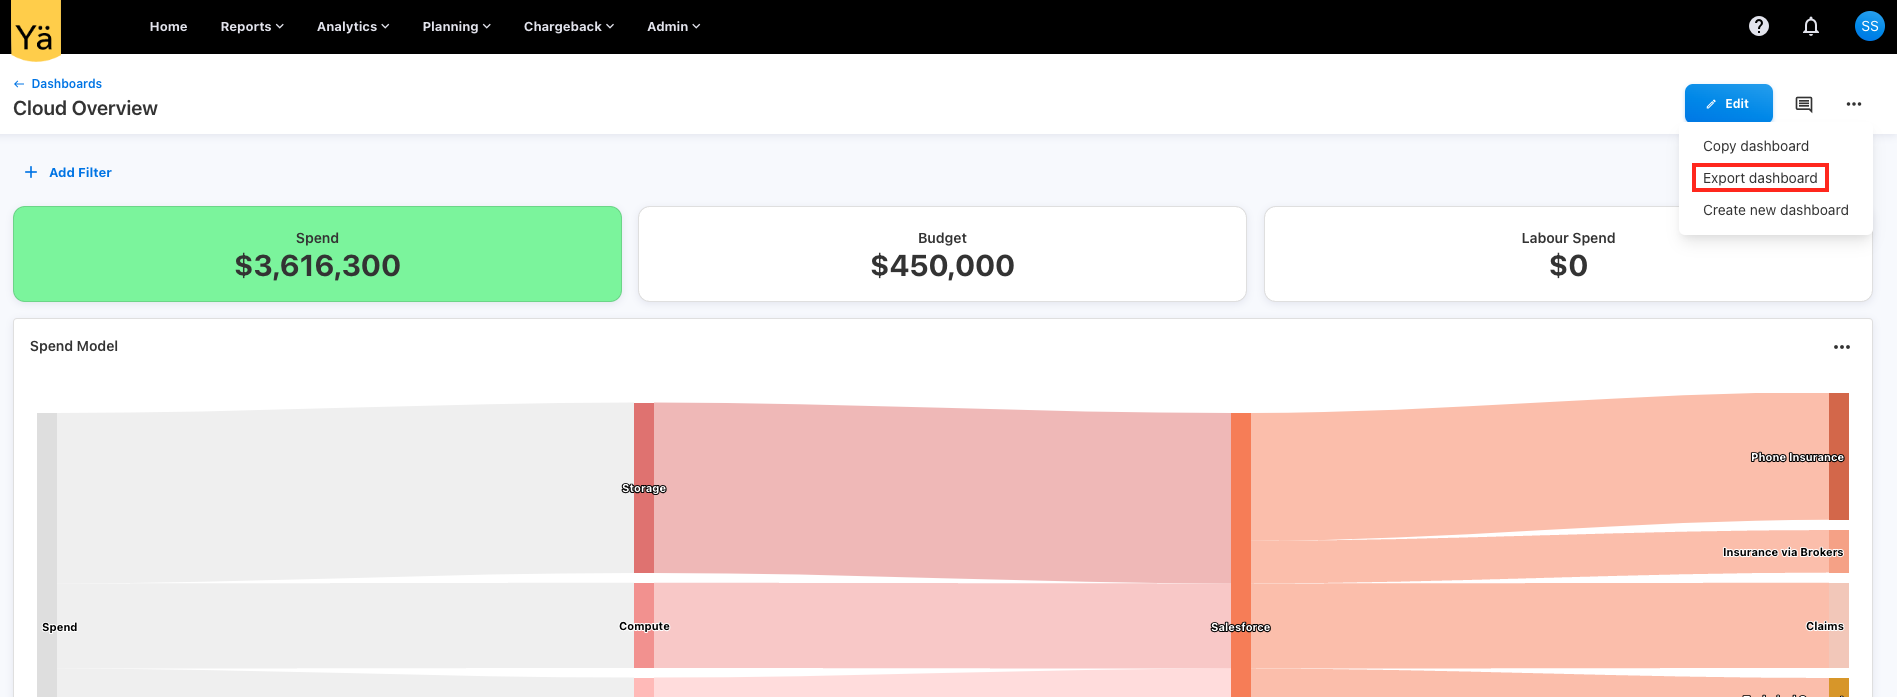
Import and Export of Custom Dashboards
We’ve included the importing and exporting capability on the custom dashboards.
August 19, 2024
Slack Notifications
The application can now send notifications directly to Slack channels by setting up a Slack webhook, which allows users to receive real-time updates and notifications within their Slack workspace.
August 05, 2024
New Dashboards
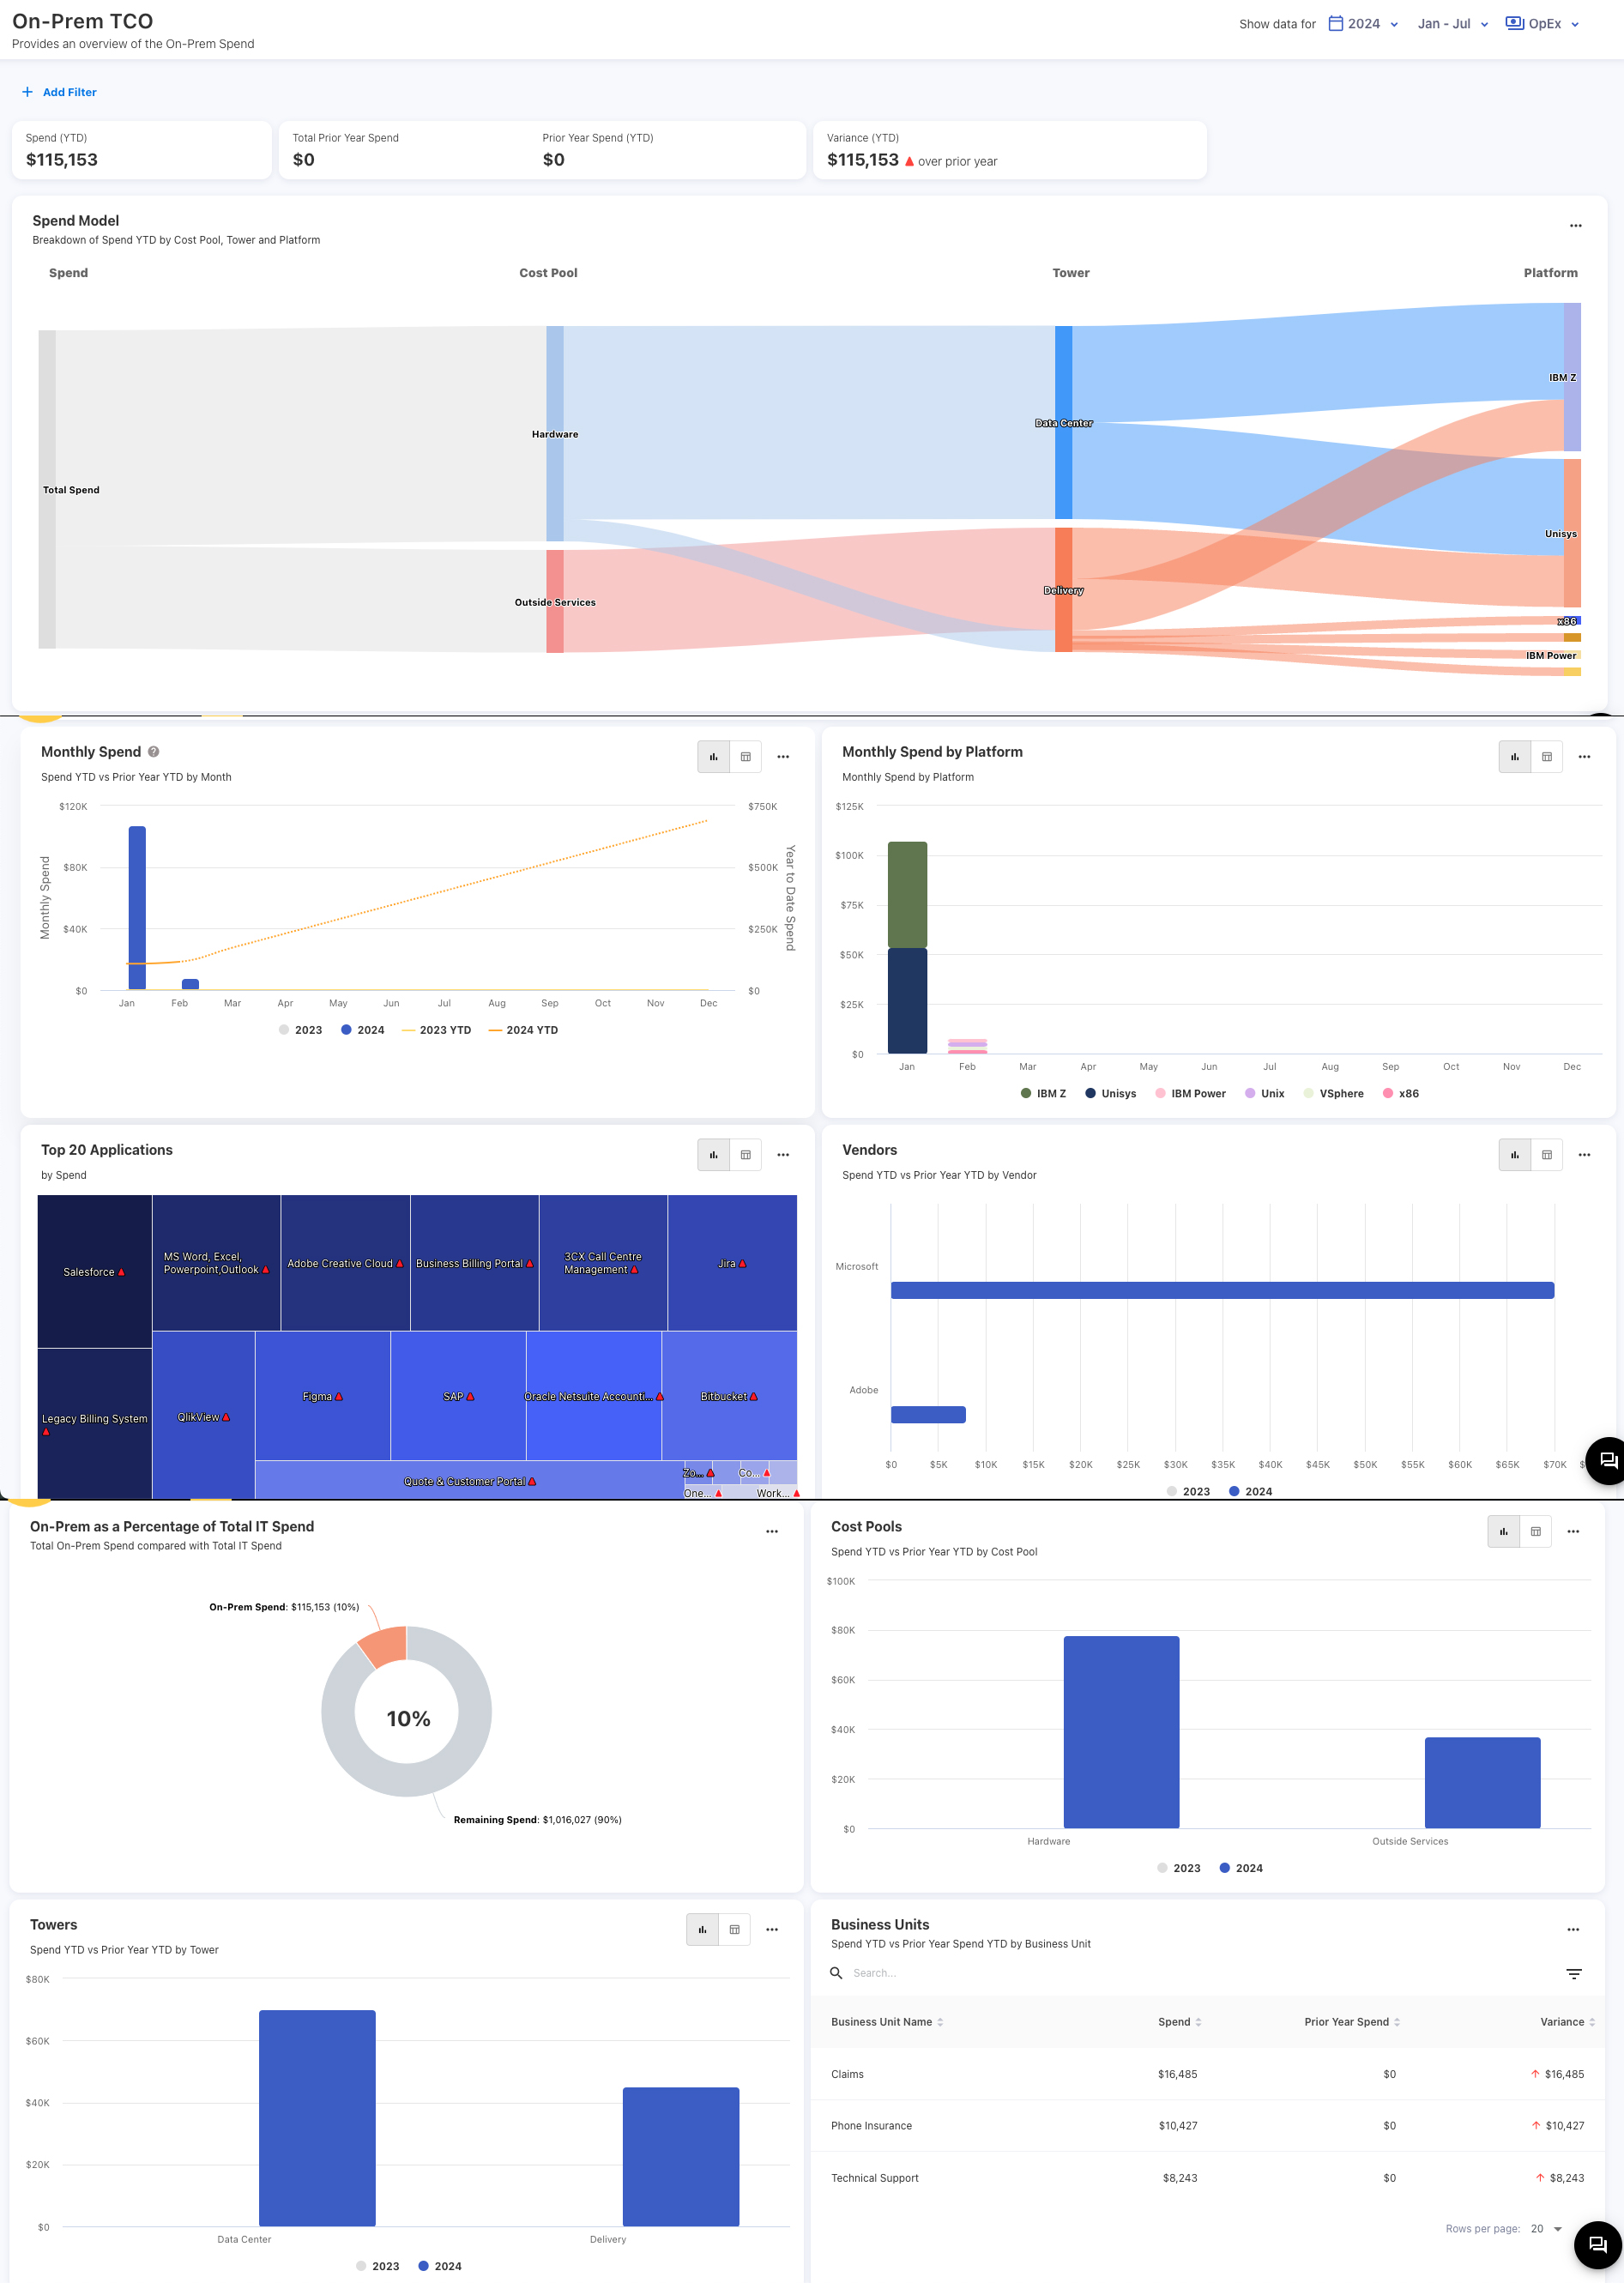
On-Prem TCO
On-Prem TCO dashboard is tailored for tracking and analyzing the spend for on-premise infrastructure. It provides a breakdown of on-prem spend by cost pool, tower, month, platform, vendor, and other parameters.
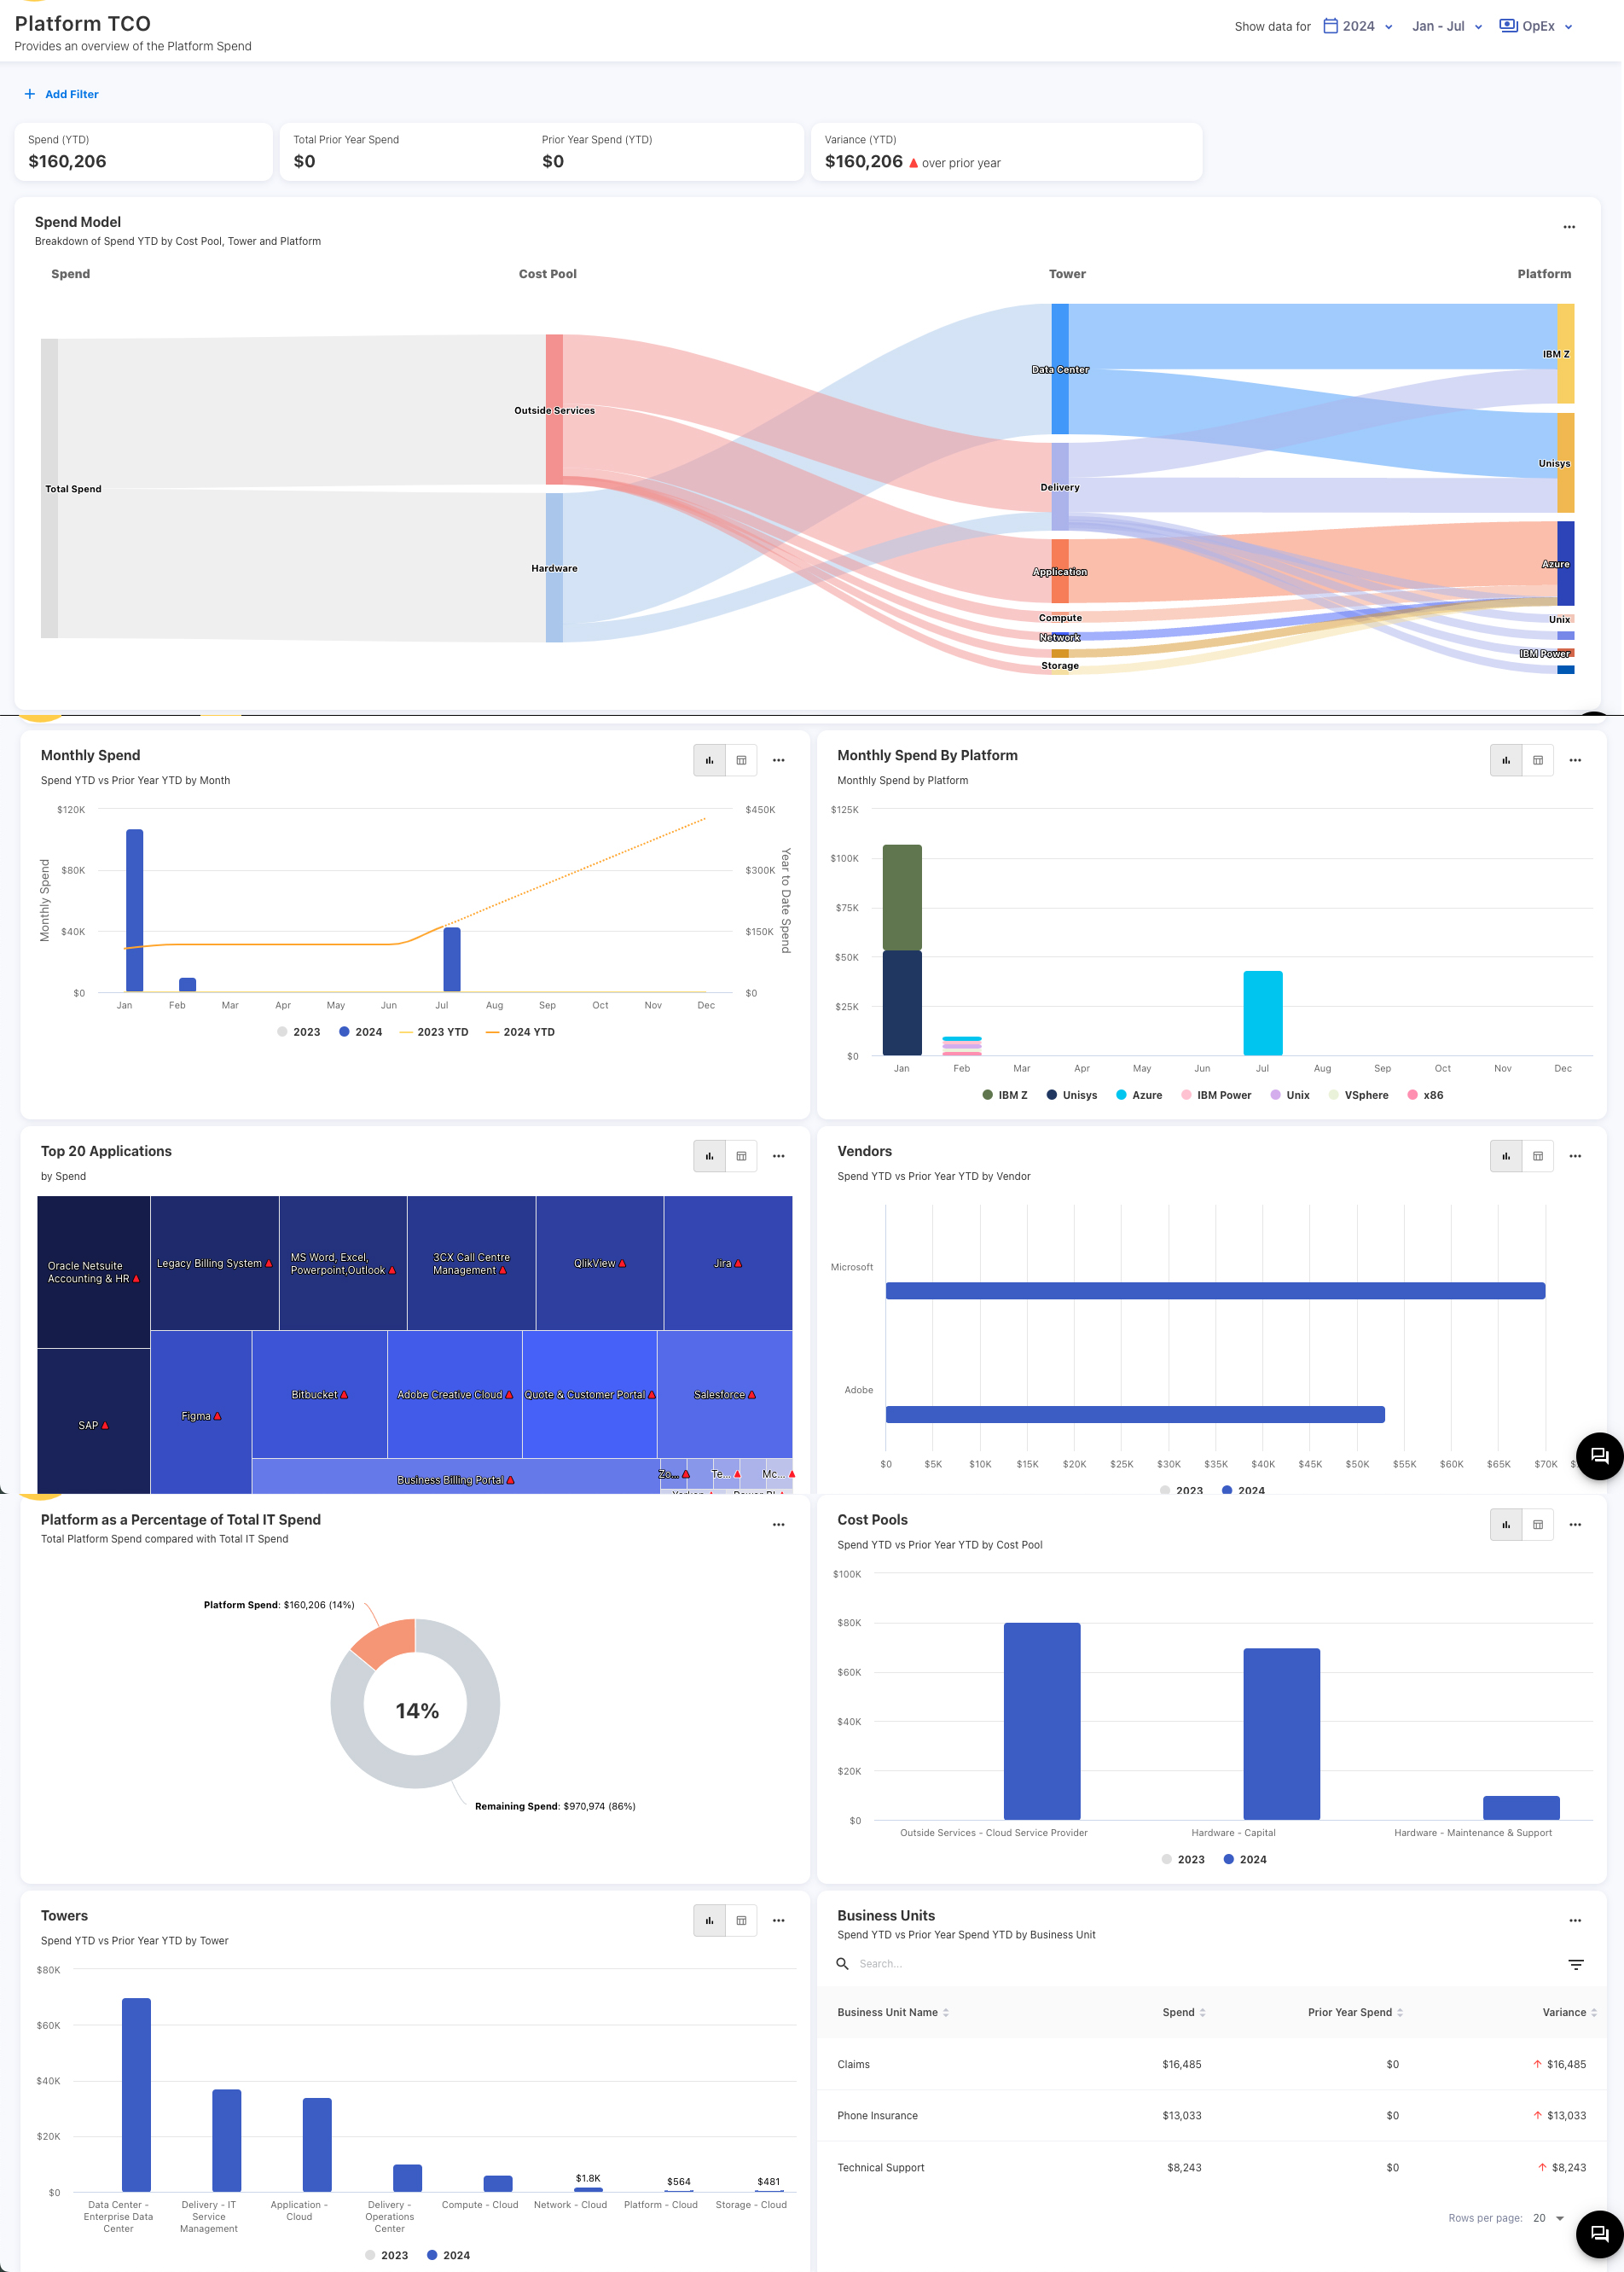
Platform TCO
The Platform TCO dashboard offers a comprehensive overview of spend for platform and hybrid environments. It provides you with a detailed breakdown of your platform spend by cost pool, tower, month, vendor, business units and other parameters.
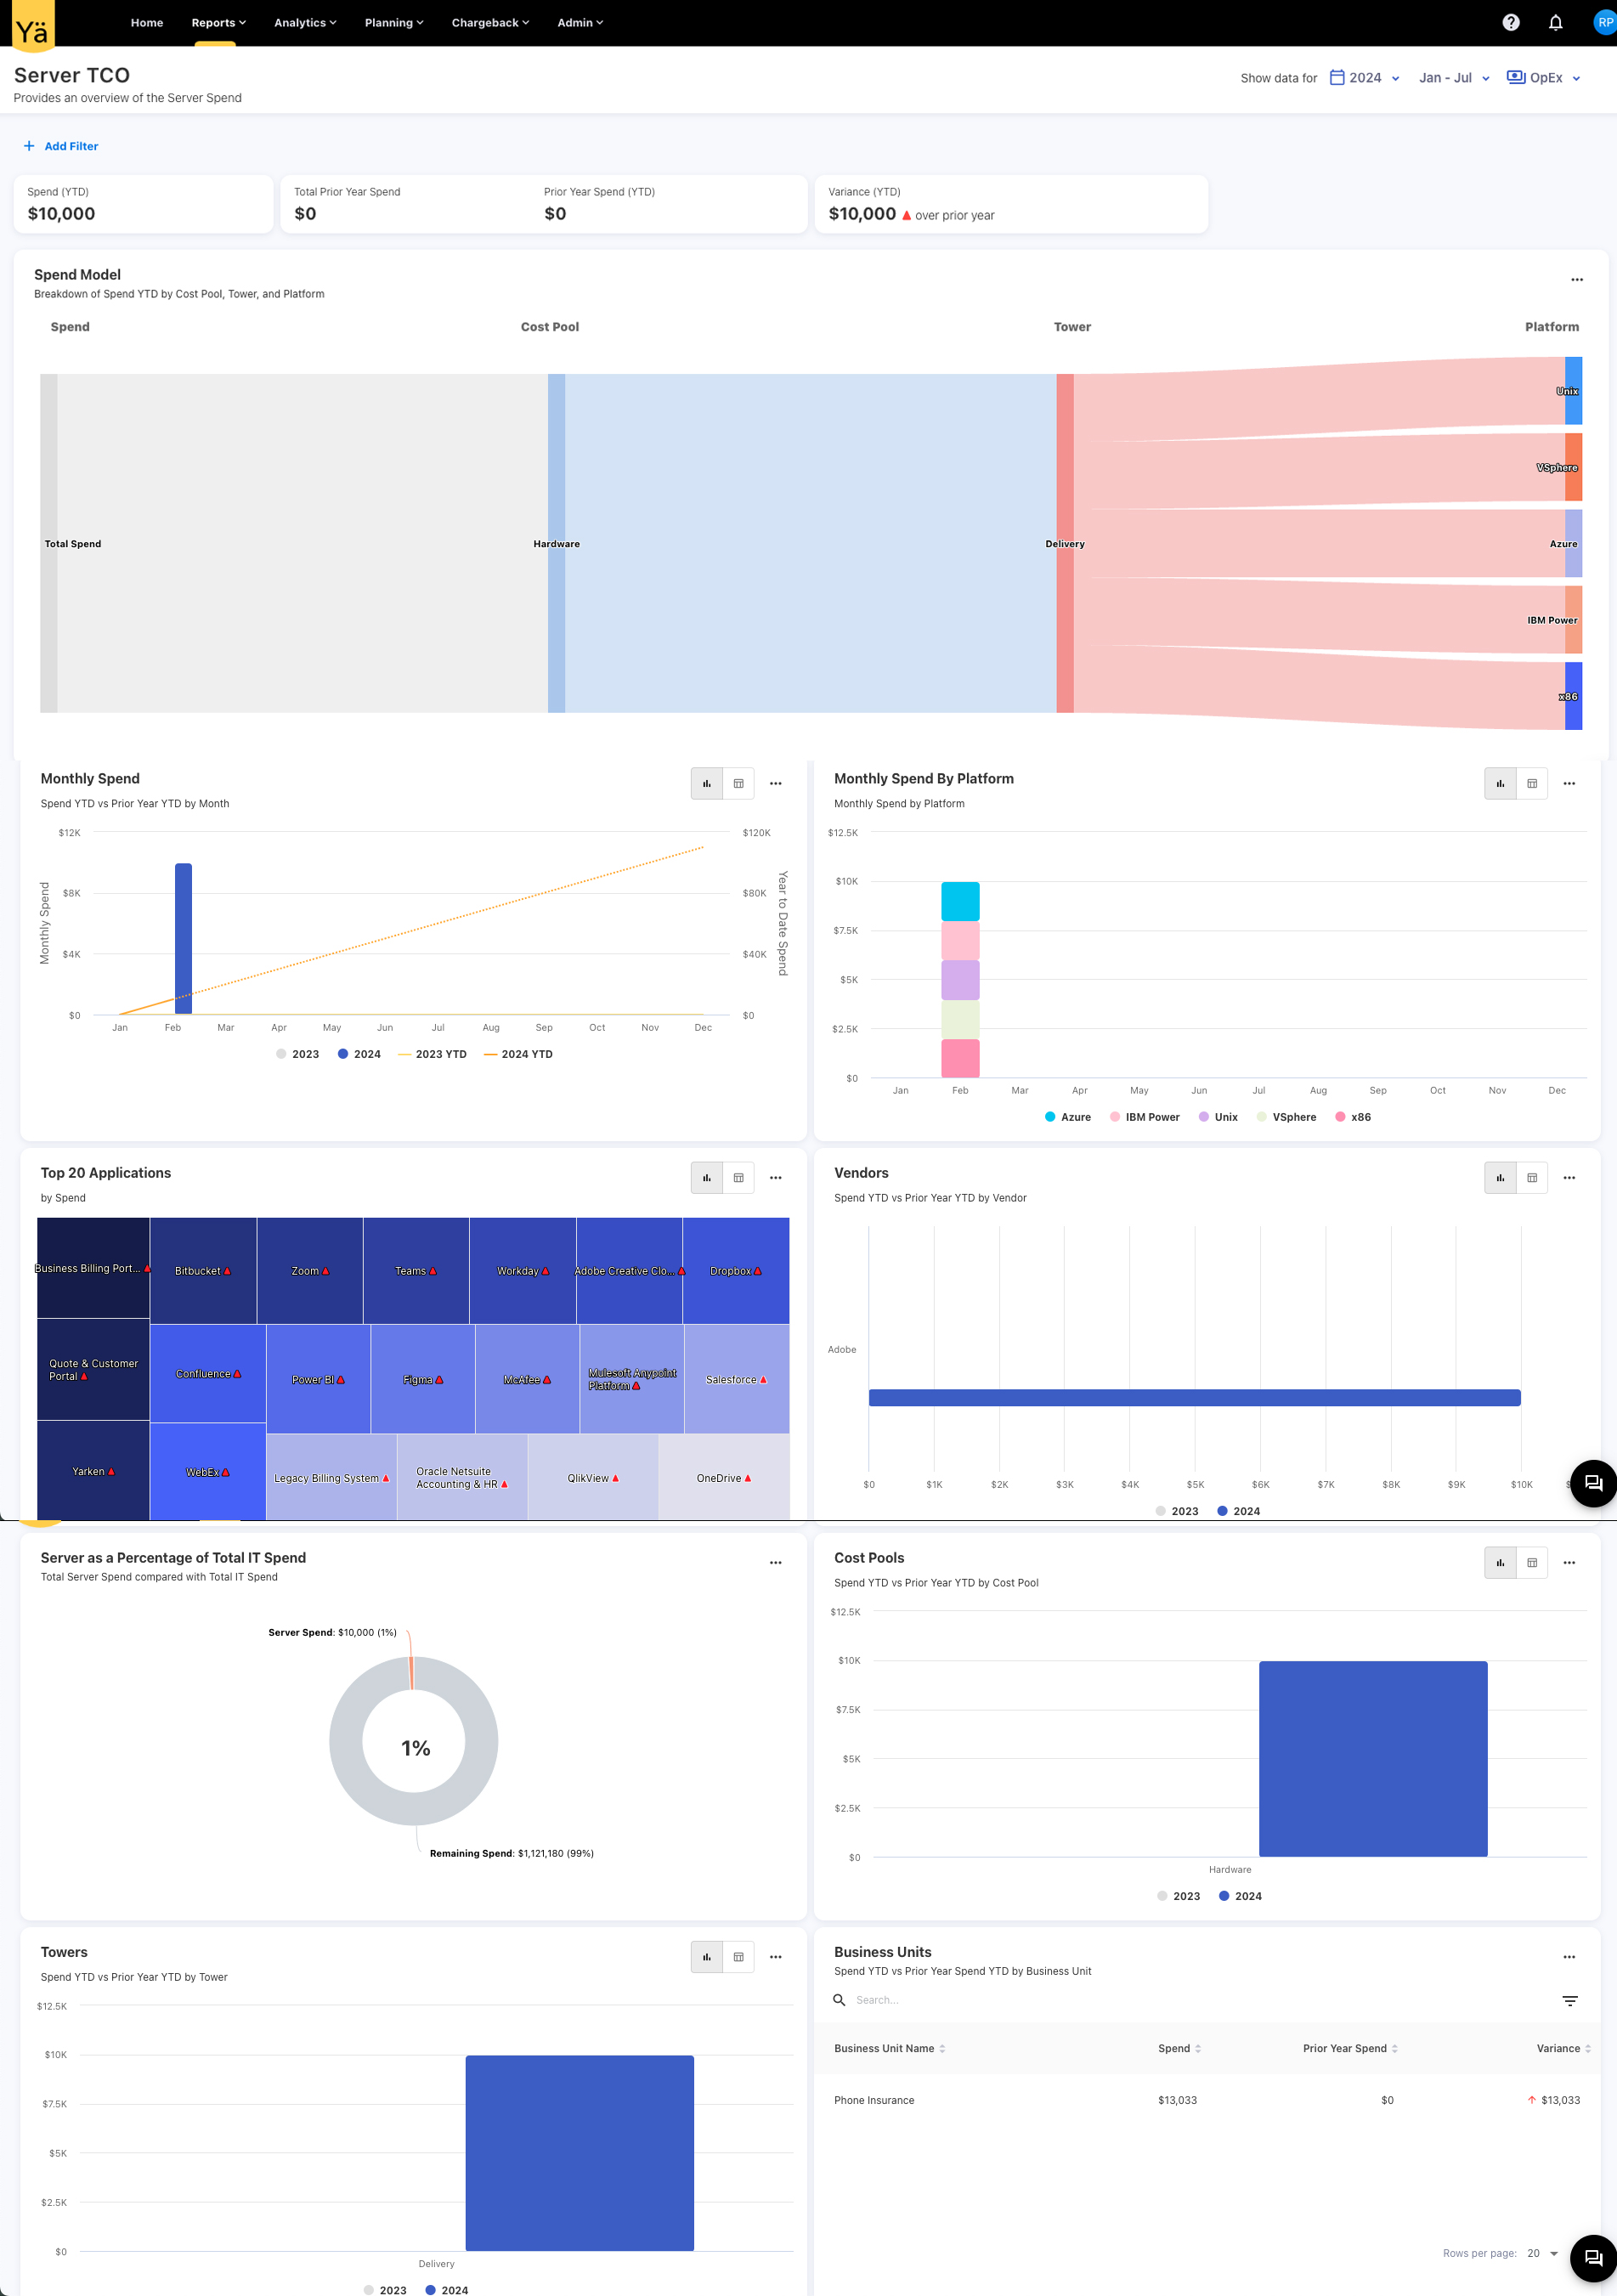
Server TCO
The Server TCO dashboard provides an overview of server hosting spend, focusing on the expenditure on the server infrastructure. The dashboard shows the breakdown of server spend by cost pool, tower, platform, vendors, business units, and other parameters.
Platform Hosting: A new attribute for asset
A new field named Hosting Platform has been introduced to all asset types. You can now specify the hosting environment or platform on which each item is distributed.
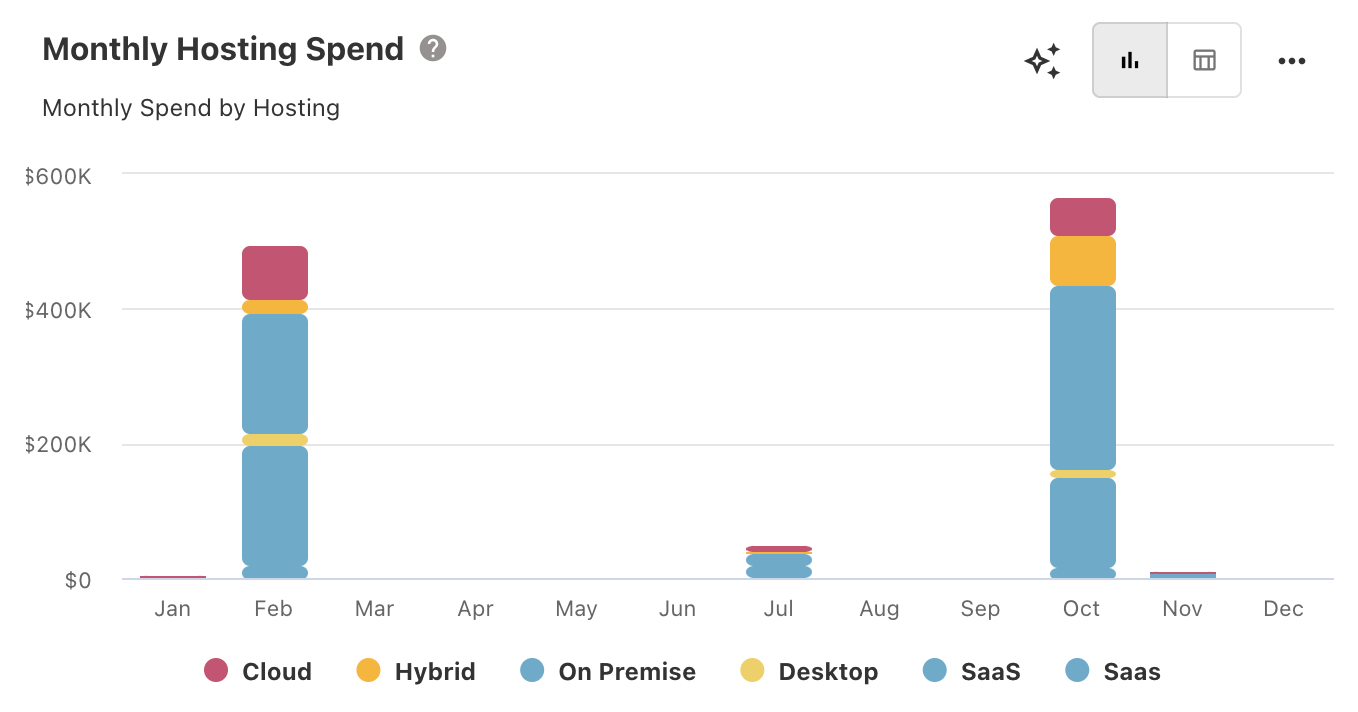
Application Portfolio: Monthly Hosting Spend
A new Monthly Hosting Spend chart is introduced to show the monthly hosting spend on the applications. You can also drill into the specific hosting to see a detailed breakdown of the spend.
Cloud TCO and Mainframe TCO
The data on the Cloud TCO and Mainframe TCO dashboards is now based on the Hosting Platform.
Application TCO Dashboard: Cloud data
If the cloud resource is shared across multiple apps, we now only show the portion of the spend that belongs to that app.
July 29, 2024
FOCUS 1.0 Columns
We have included new columns from the FOCUS 1.0 version. The new columns provide additional metrics and dimensions that offer a more granular view of your cloud spend and usage patterns. All the new columns are fully integrated with our Consumption Data Upload feature and reporting tool.
July 22, 2024
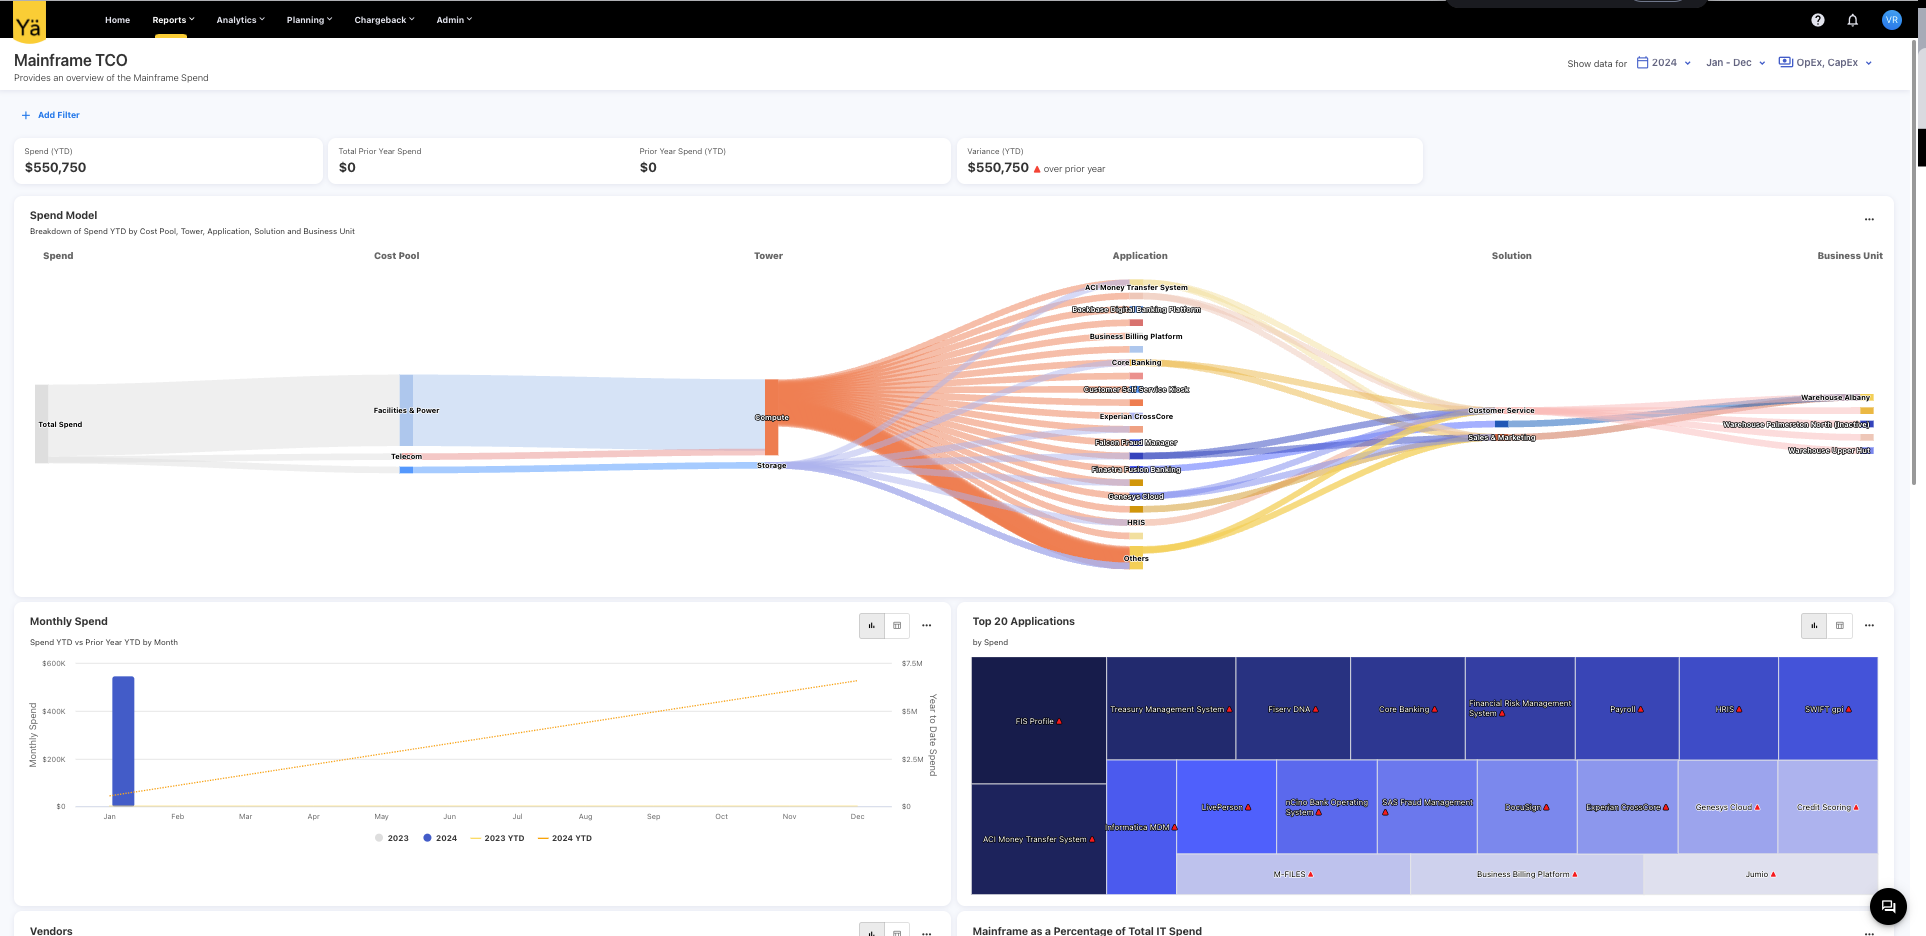
Mainframe TCO: A new dashboard
A Mainframe TCO dashboard provides an overview of the mainframe spend. This dashboard offers a visualization of mainframe spend across various categories, including cost pools, towers, applications, solutions, and business units.
-20240718-065511.png?cb=98cdbea65bd7b87ba146acfe9cc736d3)
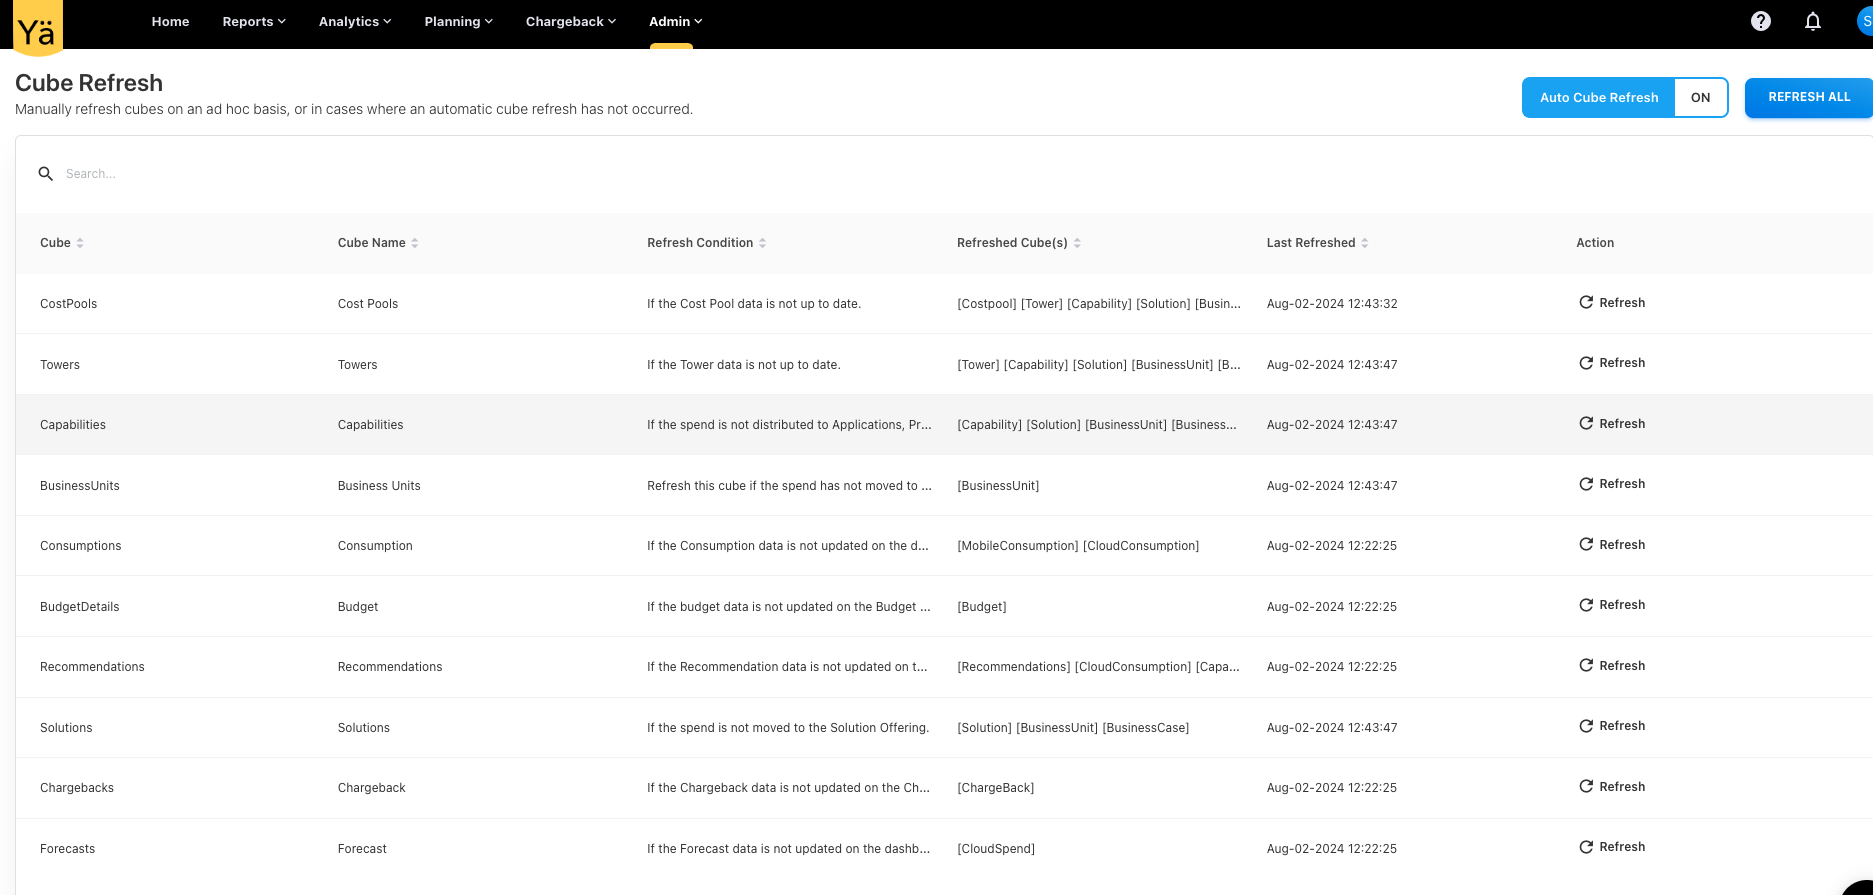
Cube Refresh
We have enabled cube refreshing capability within our application. This new feature allows you to manually refresh cubes on an ad hoc basis, or in cases where an automatic cube refresh has not occurred. This is especially useful when loading large datasets spanning multiple years or months
July 15, 2024
Notification Framework
The new Notification Framework provides in-app notifications for various background events that occurred in the application. The notifications are triggered by background events and can be configured based on the several use cases.
Jun 10, 2024
New Dashboards
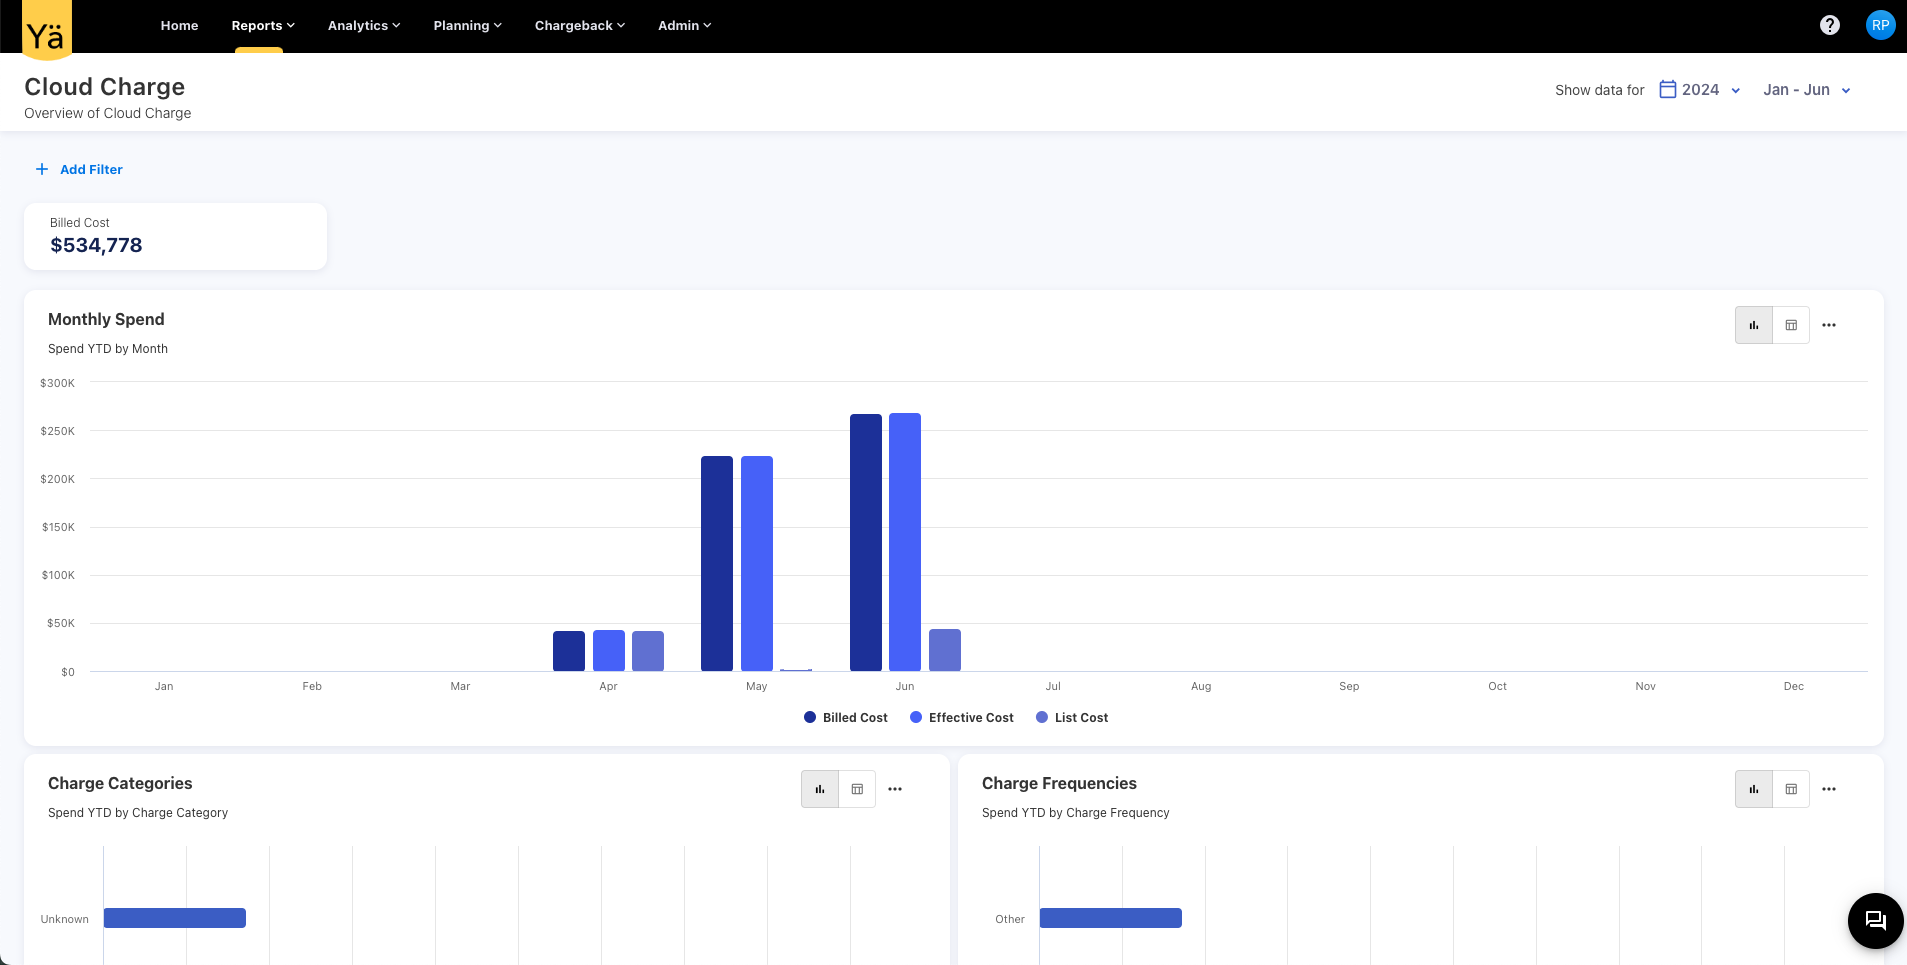
Cloud Charge
A new dashboard, Cloud Charge, has been designed to help you monitor and analyze your cloud charges more effectively. This new dashboard allows you to:
-
Visualise your cloud charges across different categories.
-
Track the frequency of cloud charges, such as one-time or recurring.
-
Analyze charges based on pricing categories like on-demand, dynamic, and commitment-based.
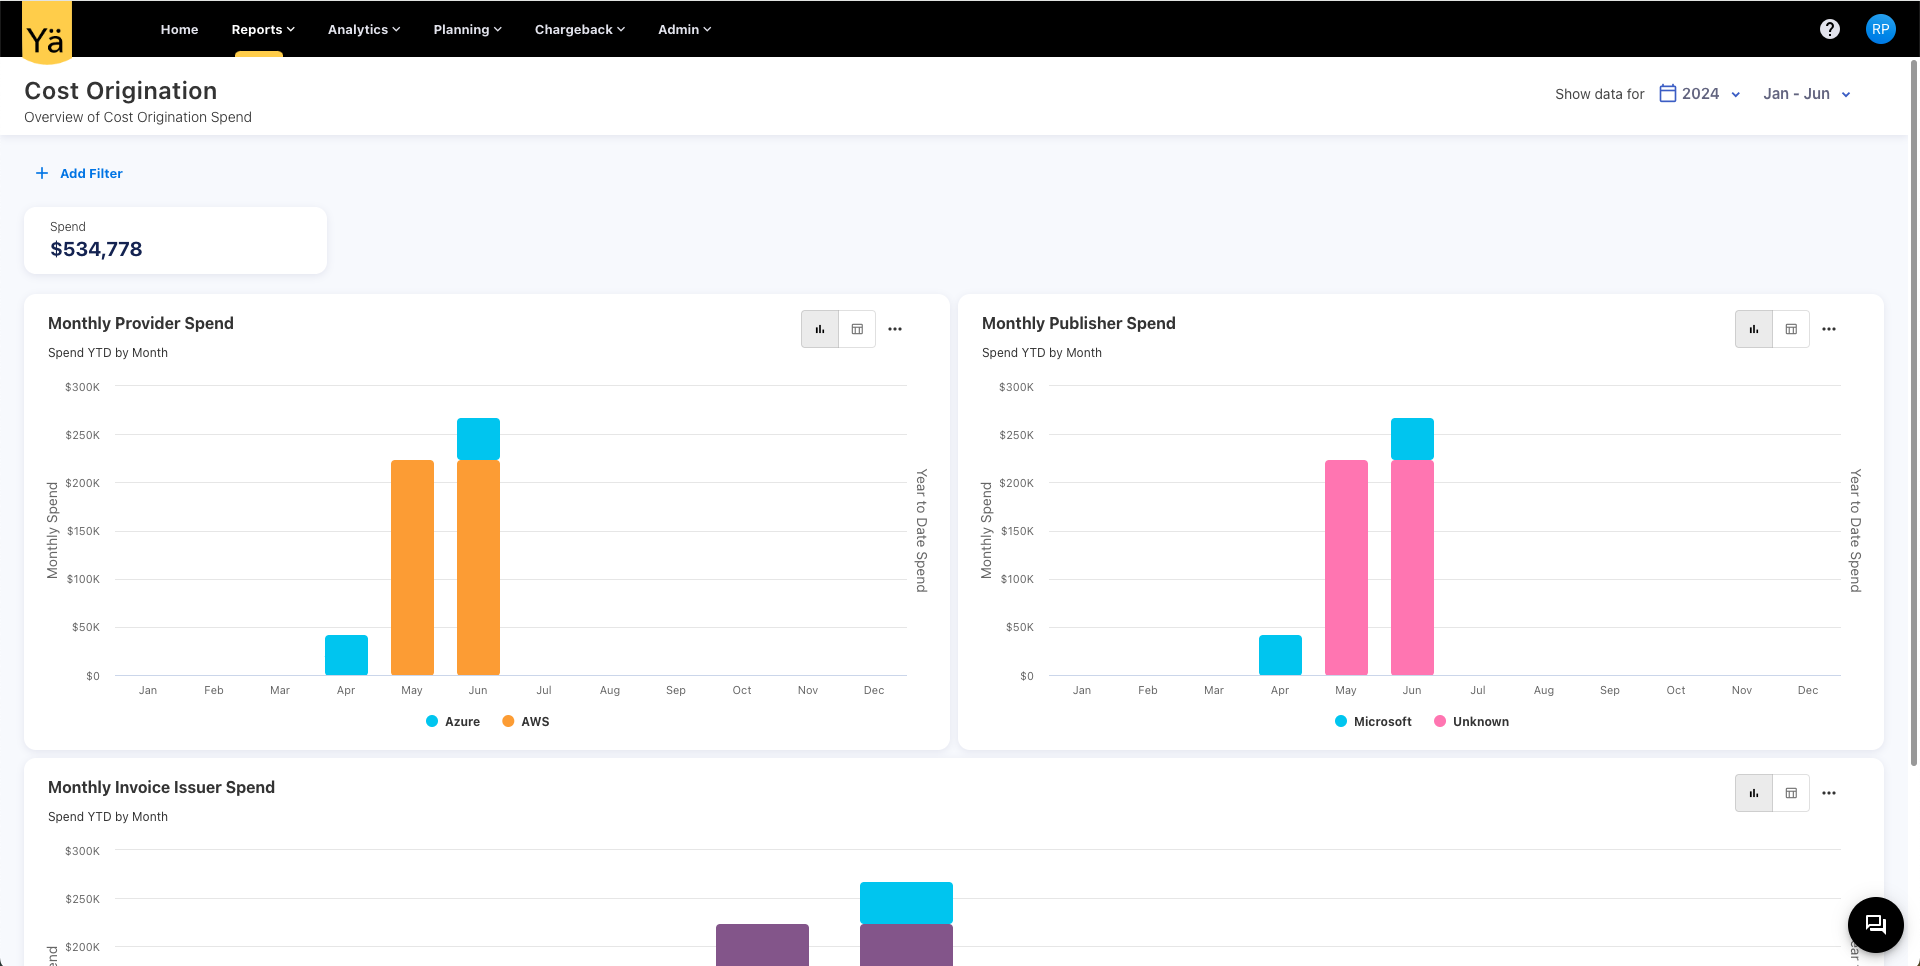
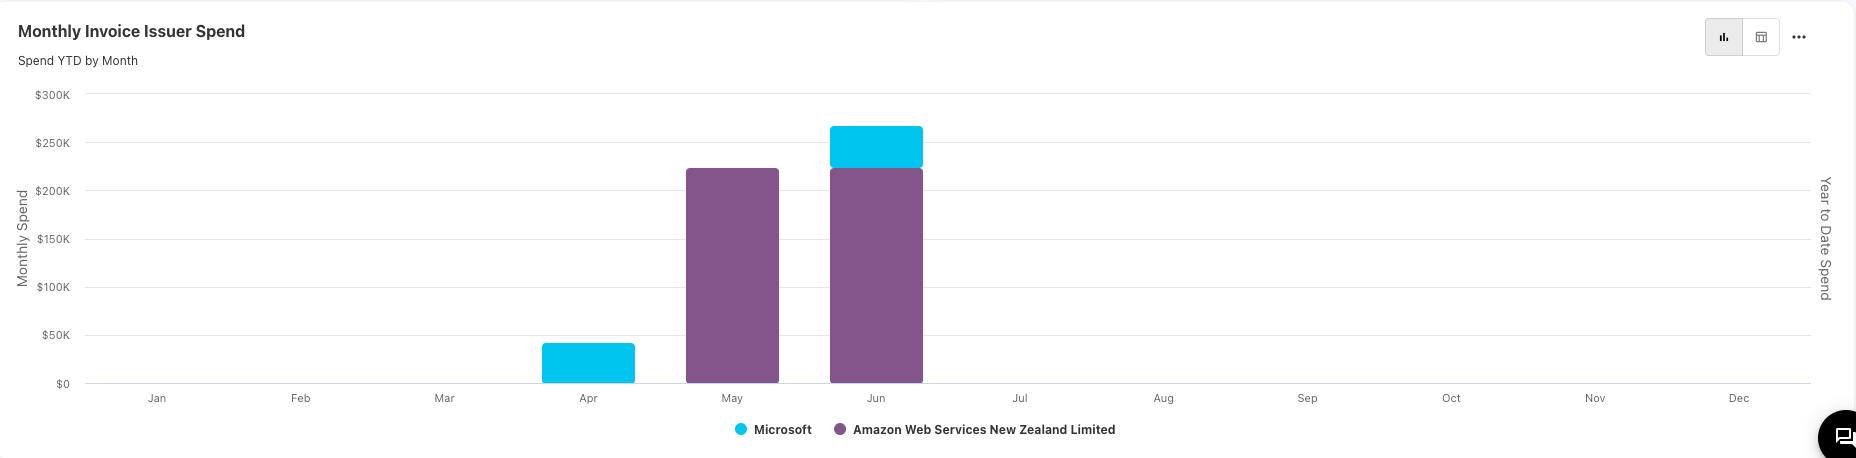
Cost Origination
The Cost Origination dashboard provides an overview of cost origination spend. The dashboard offers charts for analyzing the monthly cloud spend by provider, publisher, and invoice issuer.
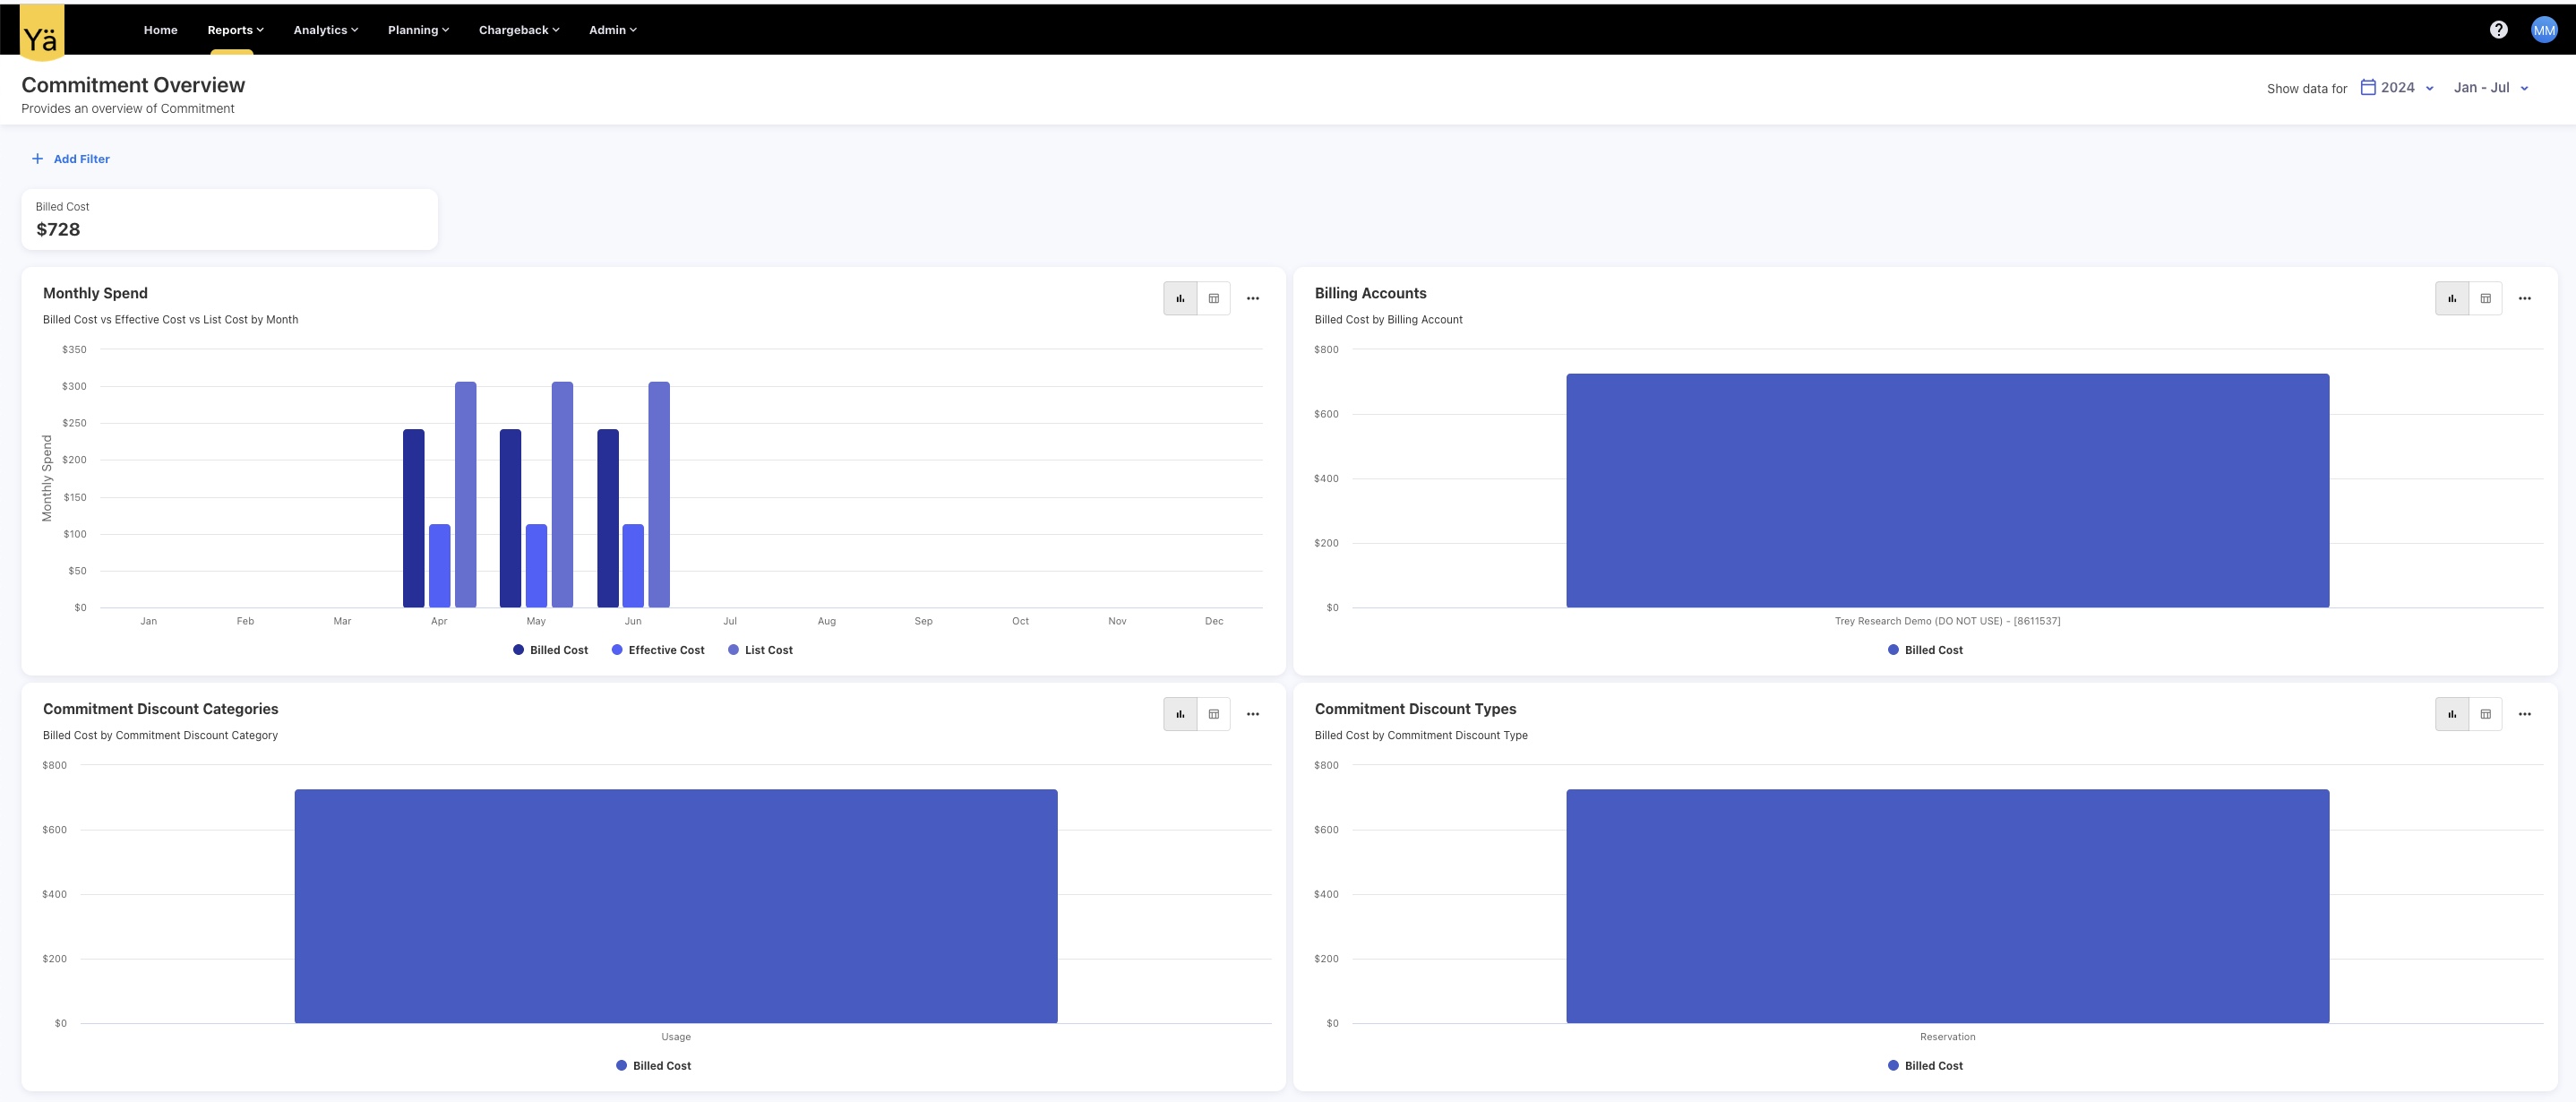
Commitment Overview
The Commitment Overview dashboard is designed to provide detailed insights into your cloud commitment discounts. This dashboard lets you:
-
Understand the categories and types of discounts your organization is leveraging.
-
Visualize your commitment discounts across different categories, such as usage-based or cost-based.
-
Analyze the different types of commitment-based discounts.
-
Compare the Billed Cost vs Effective Cost vs List Cost by Month.
-
Track the Billed Cost by Billing Account.
May 27, 2024
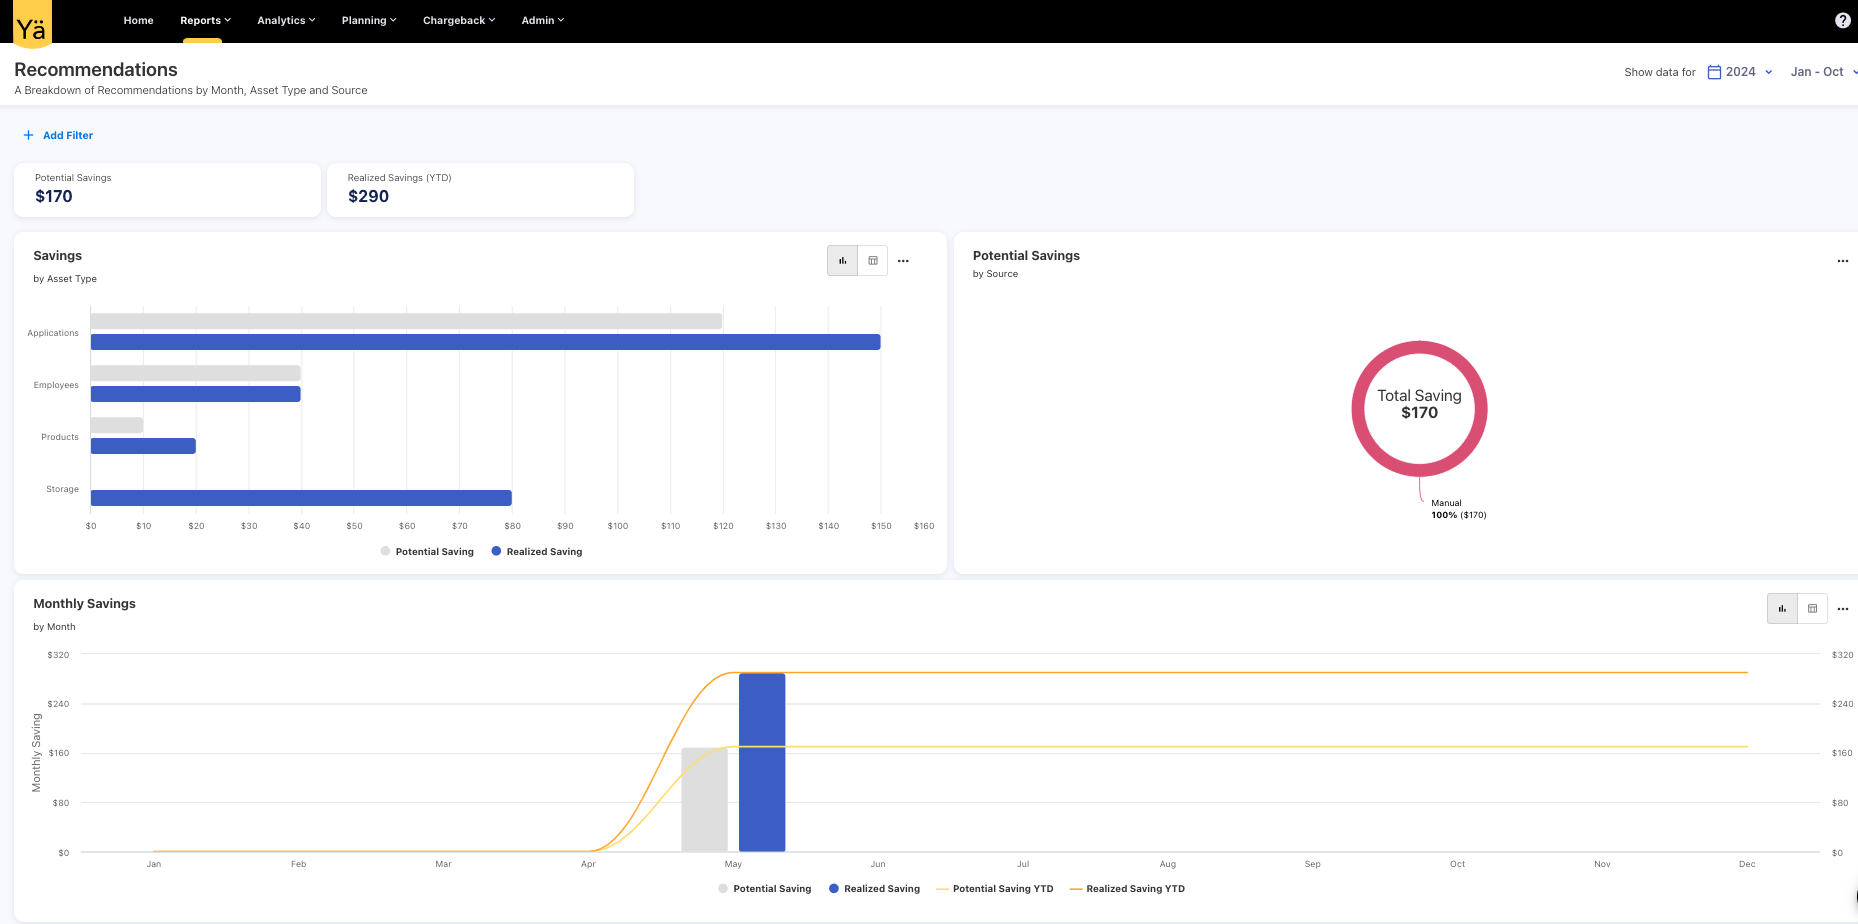
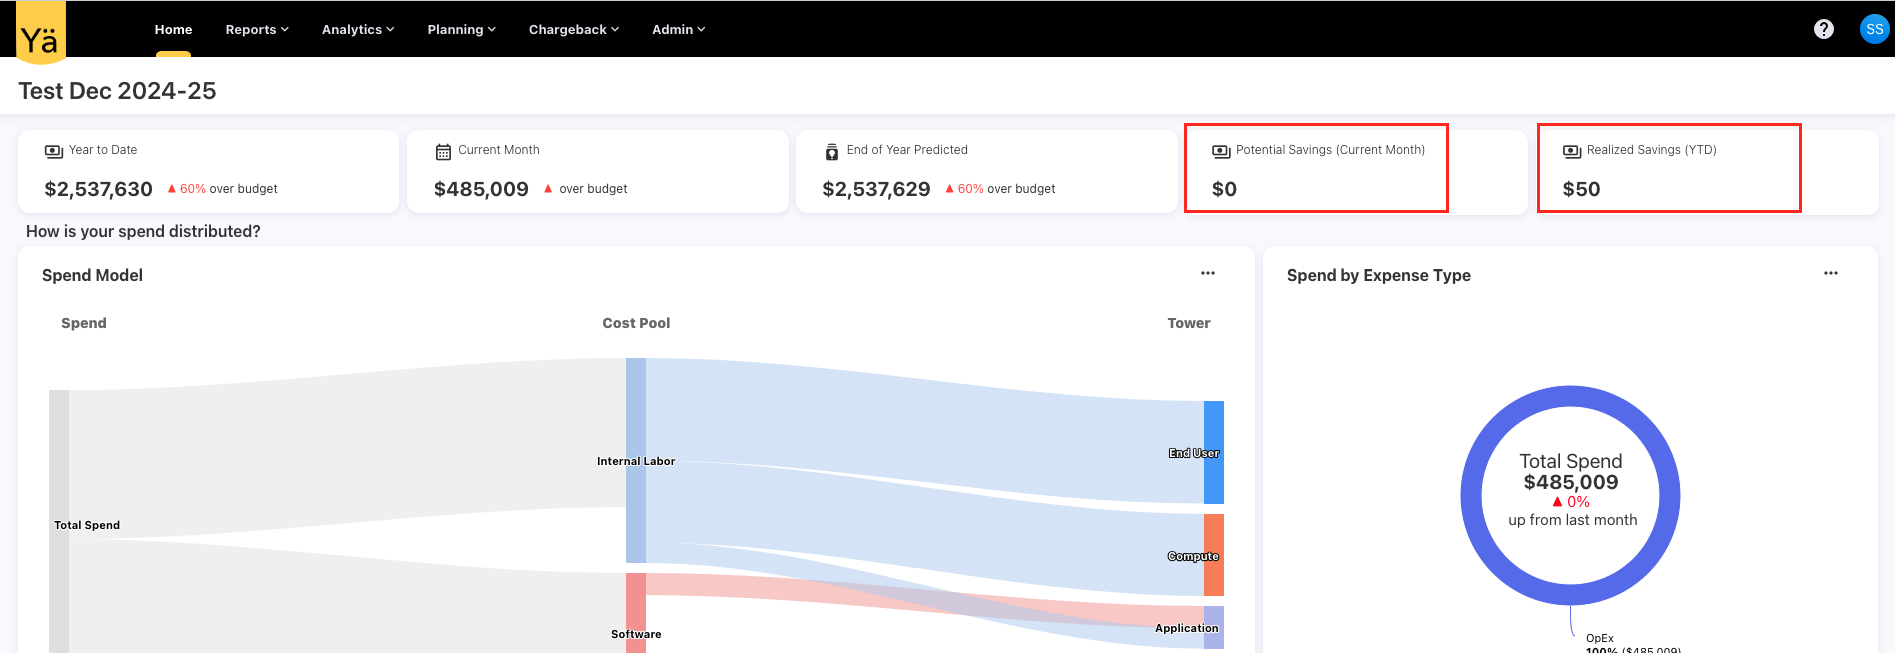
Recommendations: A new dashboard
Introducing the new Recommendations dashboard, designed to help you visualize and track potential and realized savings. This dashboard includes charts that provide a visual representation of potential and realized savings by asset type, source, and month. With this new dashboard, you can easily monitor and analyze cost-saving opportunities.
May 20, 2024
Enhancements
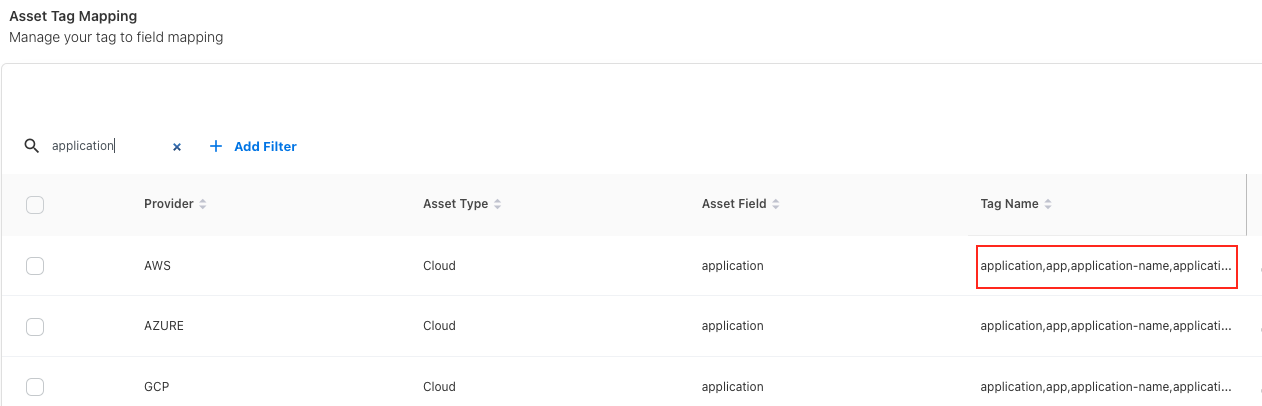
Asset Tags
We've integrated the default asset tags provided by FinOps into our application. These tags help organizations manage and allocate cloud costs more effectively. The given tags are used across different cloud providers, such as AWS, Azure, and GCP. You can track the cloud spend based on various criteria such as application, cost-center, team, product, environment, and more.
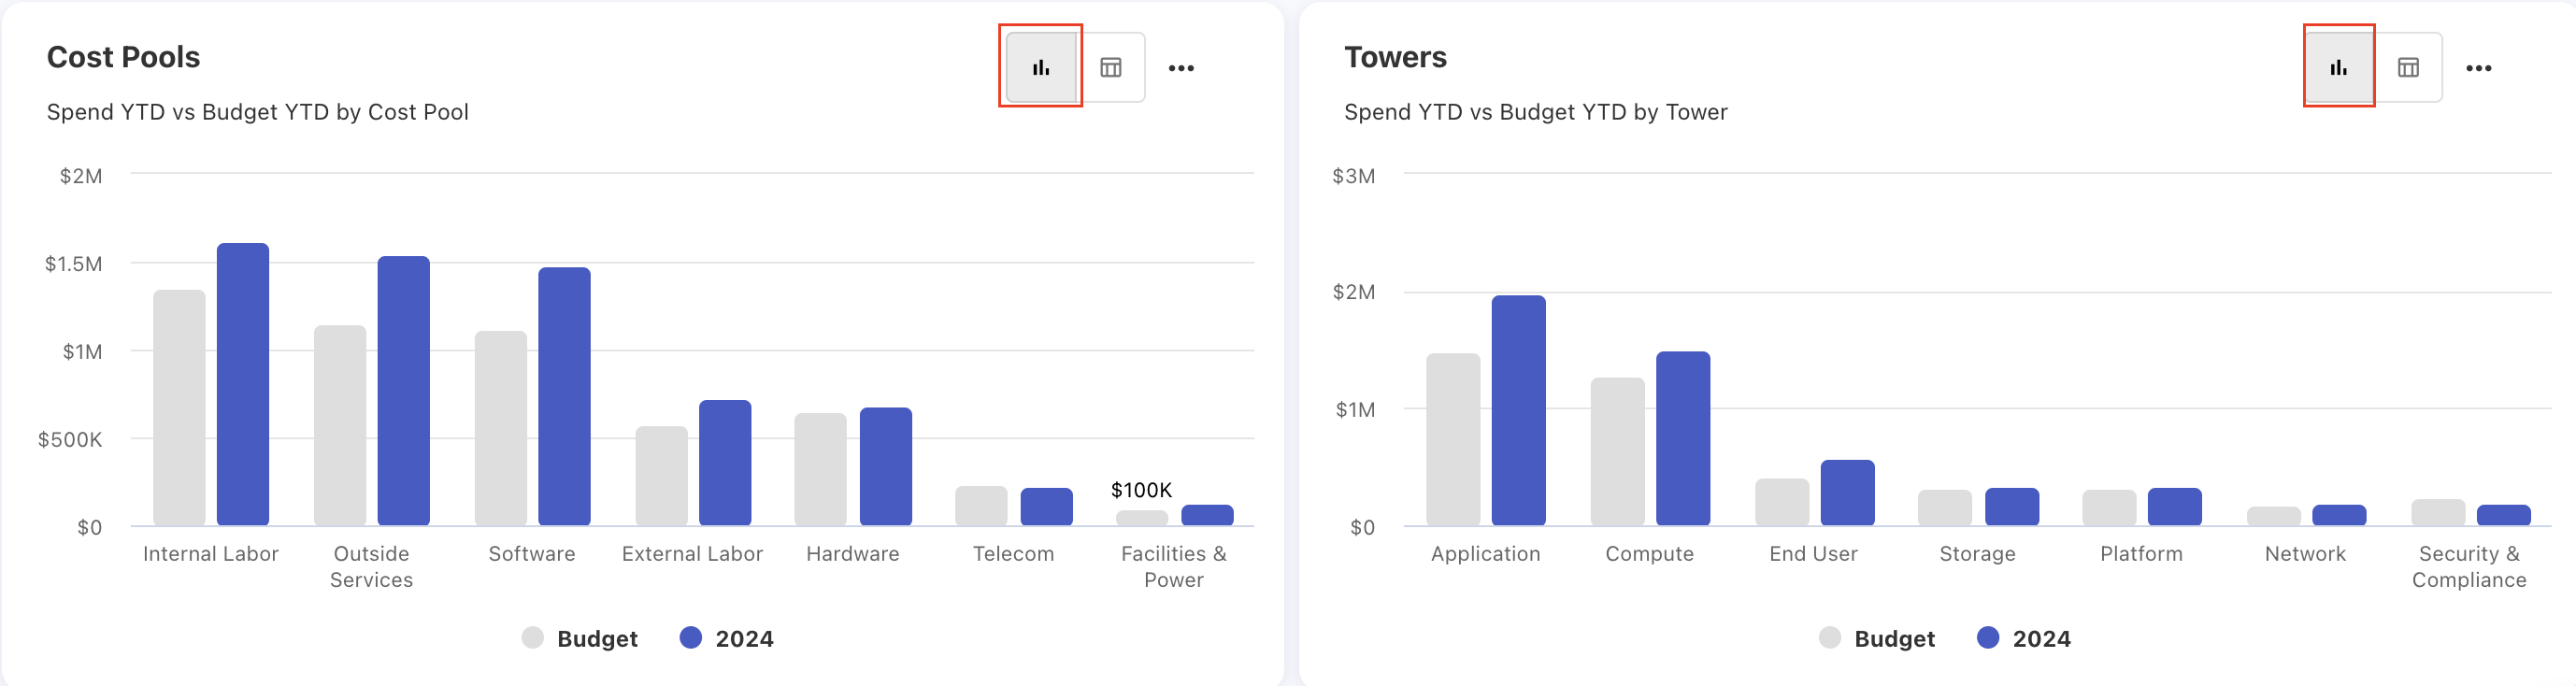
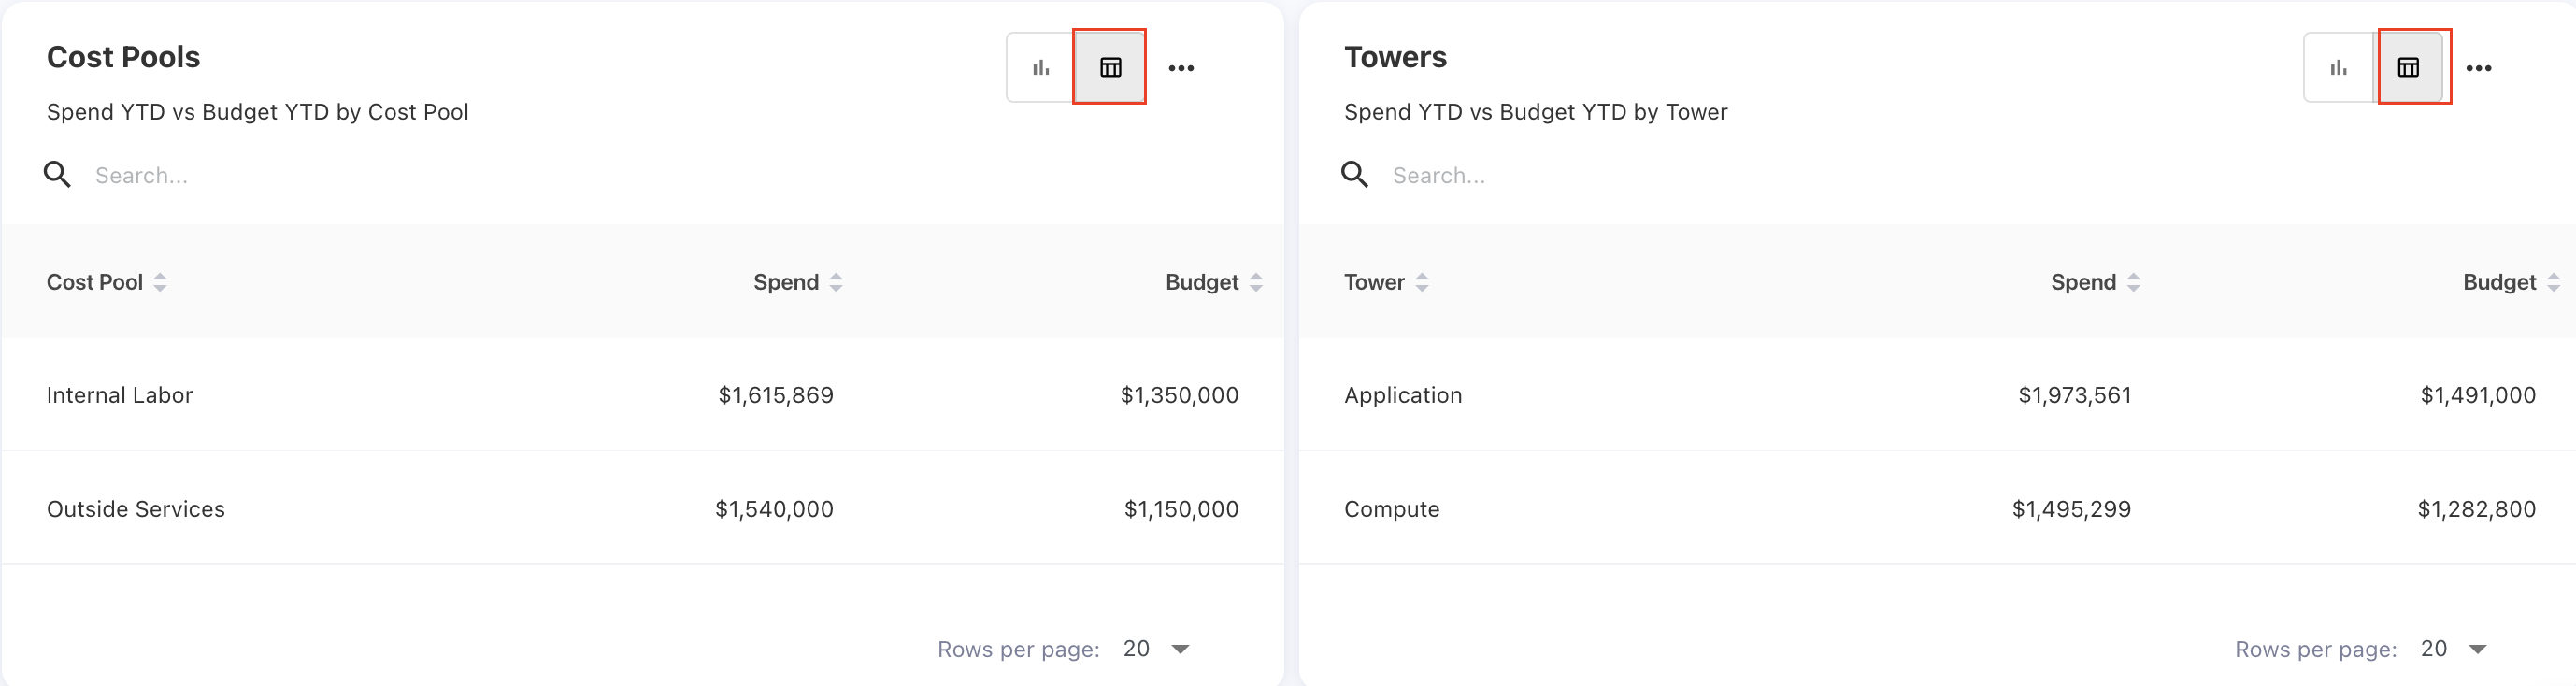
Data View for Charts
We have enabled the data view option for several charts. This new feature allows you to switch between the chart view and tabular view of the data. You can also download the data for both views.
May 6, 2024
New Features
Notification Channels (Webhook Notifications)
We are excited to announce the addition of webhook notifications in the YäRKEN application. This new feature allows seamless real-time communication between our application and external systems. With webhook notifications, you can now configure your system to receive updates instantly when specific events occur.
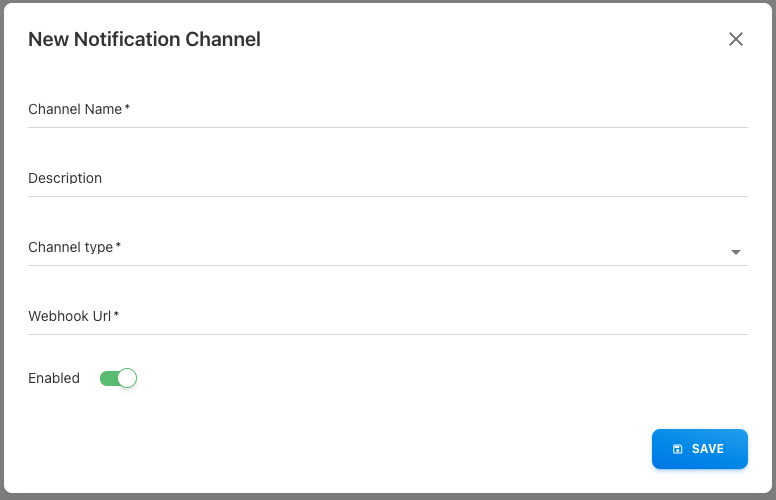
Key Highlights:
-
Real-Time Updates: Receive notifications in real-time for critical events such as file uploads, status changes, and more.
-
Easy Integration: Configure webhook endpoints directly from the application settings for smooth integration with external services.
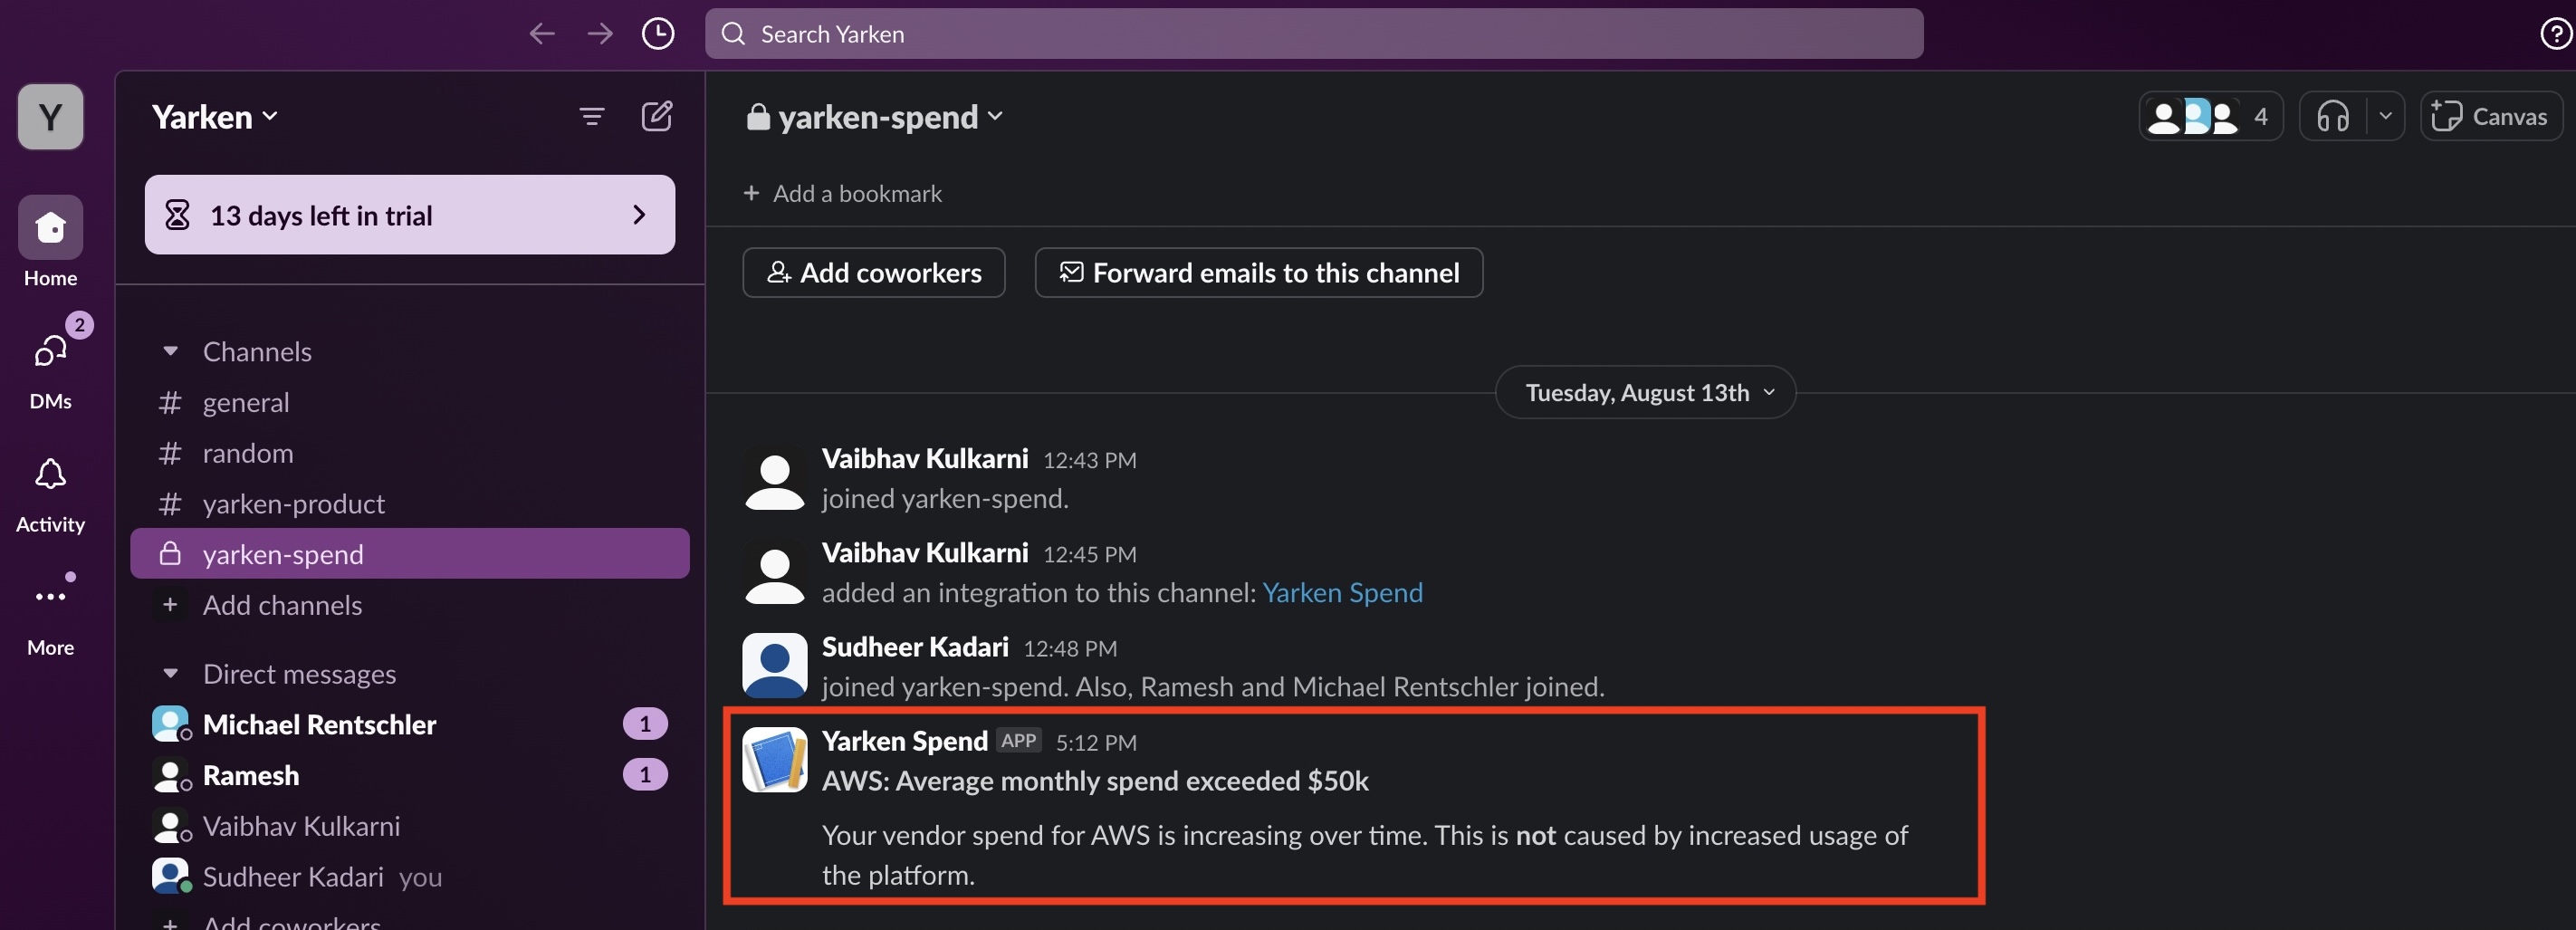
Alerting
We have designed a new Alerting feature that lets you create spend alerts based on application and vendor spend metrics. The Alerting feature promptly notifies you when your spending reaches specified thresholds.
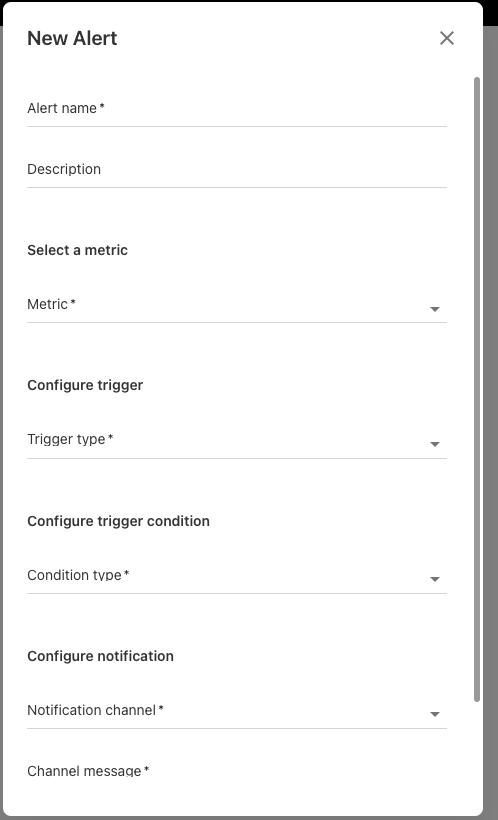
Key Highlights:
-
Custom Spend Alerts: Set up personalized alerts for specific spending thresholds on apps and vendors.
-
Real-Time Notifications: Receive immediate notifications when your spending exceeds the defined limits.
April 29, 2024
Value Stream: A new asset type
We have introduced a new asset type named Value Stream exclusively to capture the resources involved in creating and delivering value to customers within the organization. You can also track the value stream on tower and sub tower level.
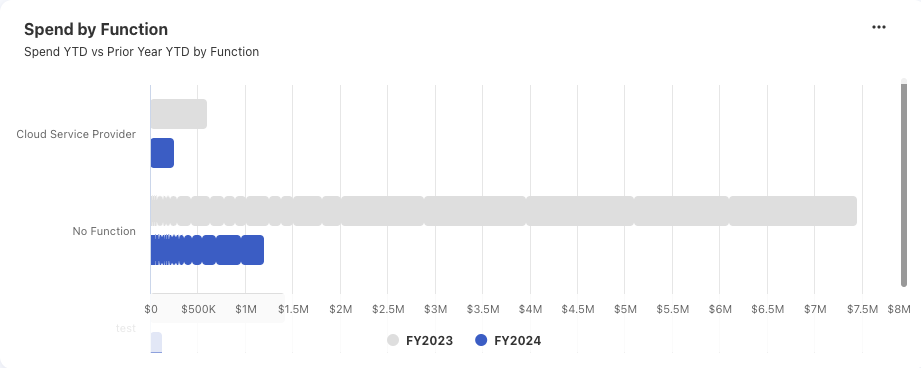
Spend by Function: A new chart in Vendor Portfolio dashboard
A Vendor Portfolio dashboard now includes a new chart titled Spend by Function. This chart provides a detailed breakdown of vendor spend by function.
April 22, 2024
New Dashboards
This release includes new dashboards exclusively for products and services. These new dashboards offer a comprehensive overview of spend on all the products and services.
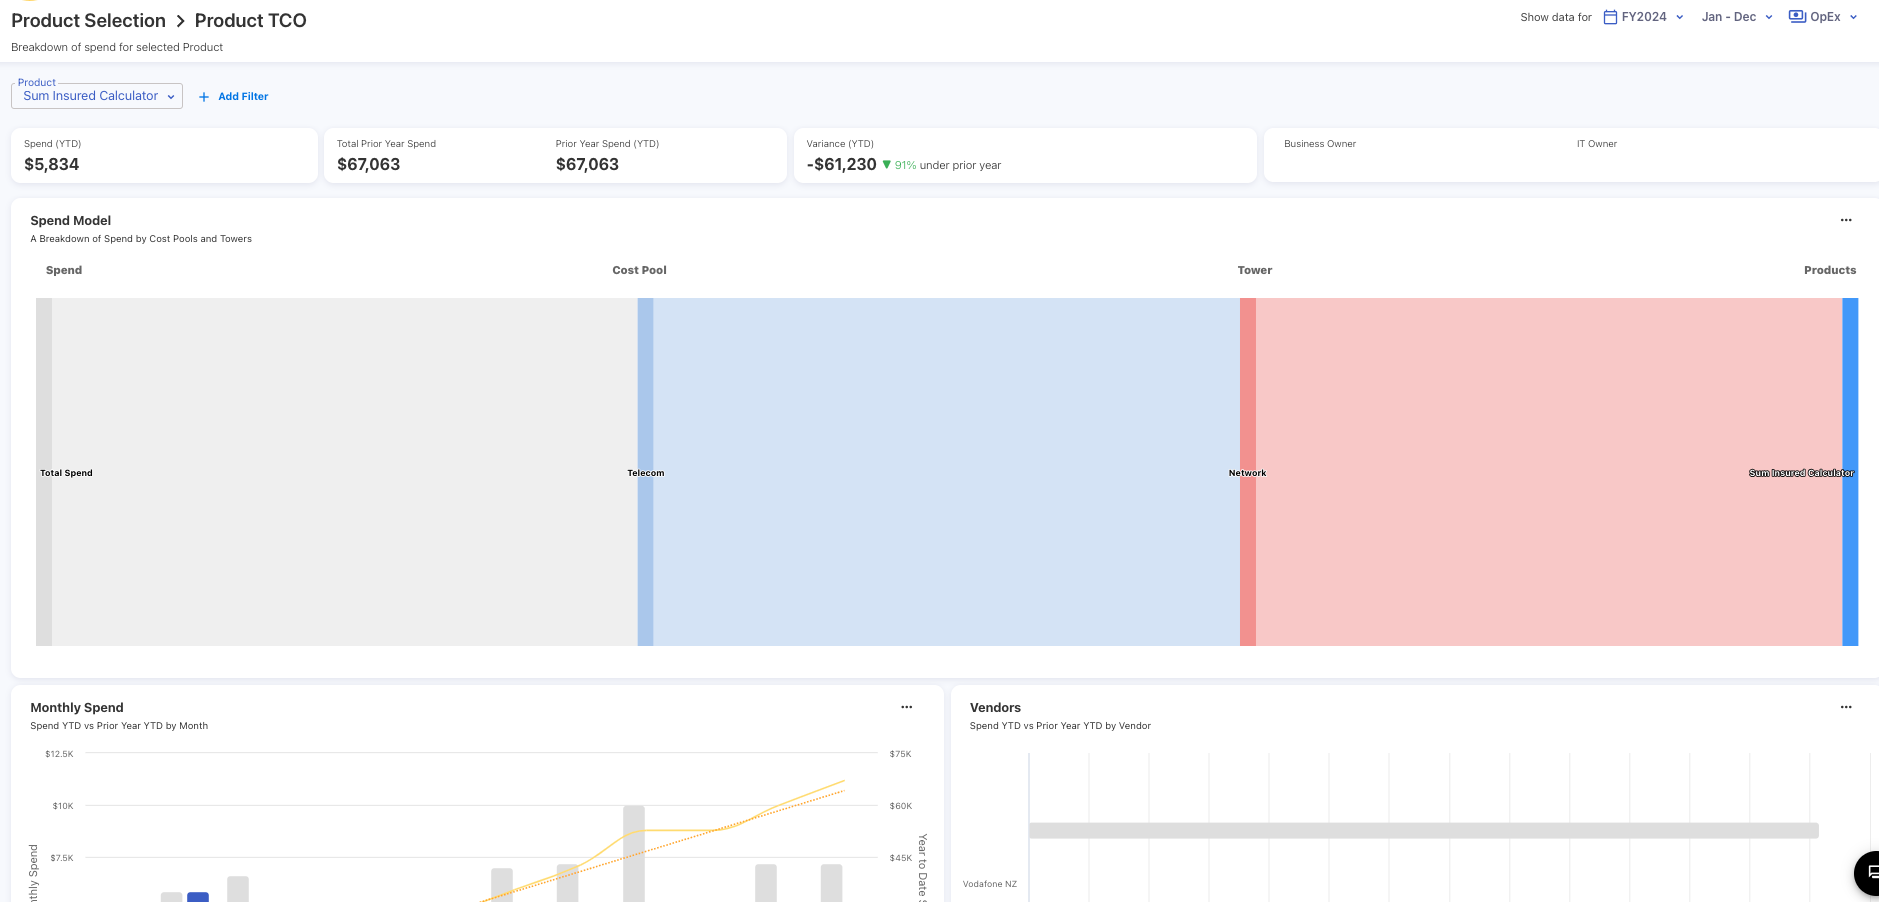
Product TCO
Provides a breakdown of spend of the selected product. It is design to analyze the total cost of ownership (TCO) associated with products.
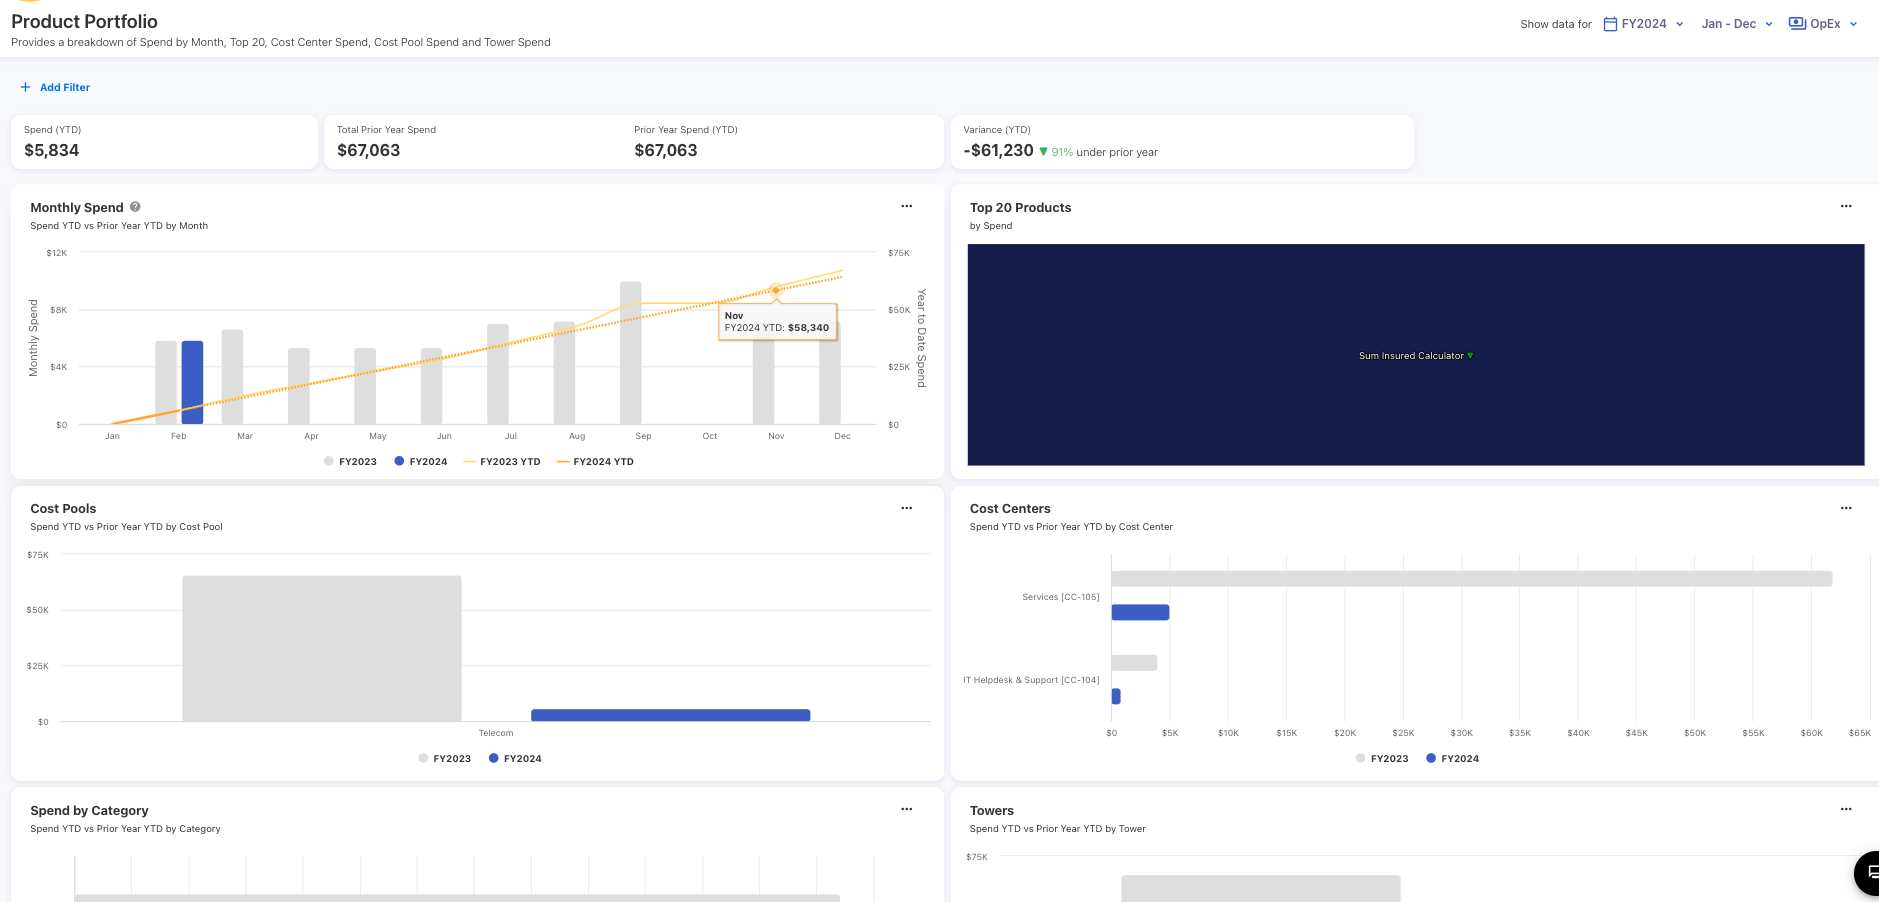
Product Portfolio
Provides a breakdown of Product spend by month, Cost Centers, Cost Pools and Towers. The dashboard also includes charts for the Top 20 Products and product categories by spend.
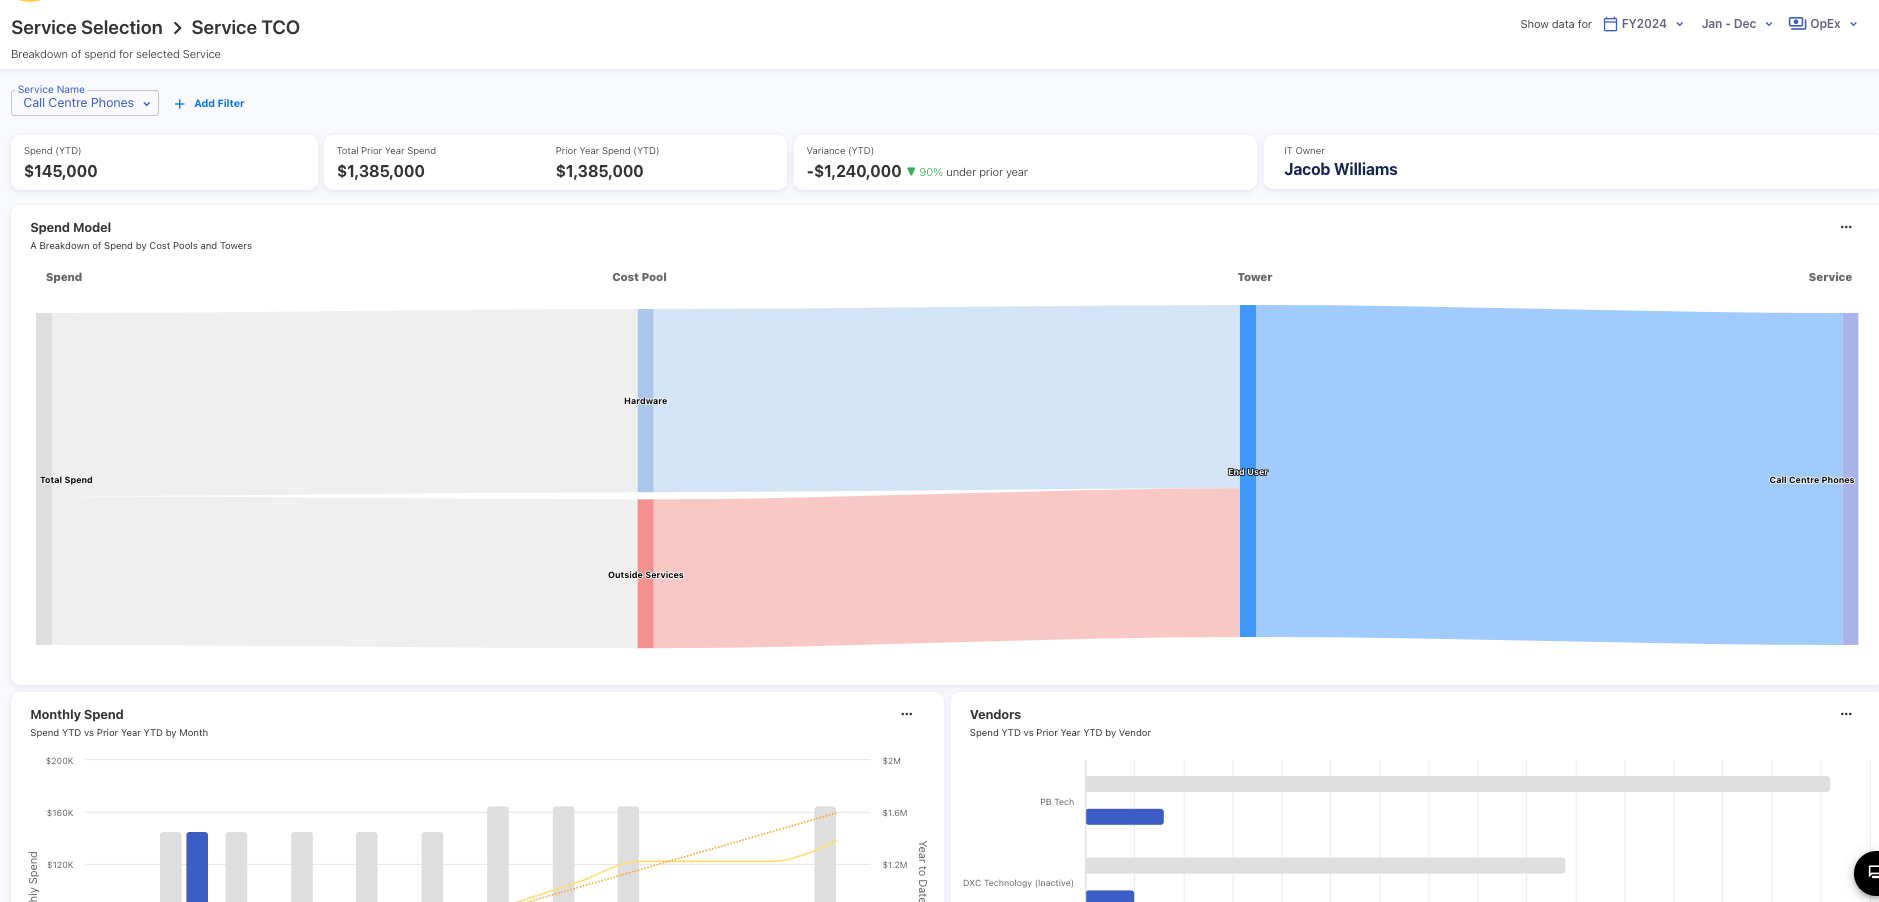
Service TCO
Provides a breakdown of spend of the specific service. It is design to analyze the total cost of ownership associated with services.
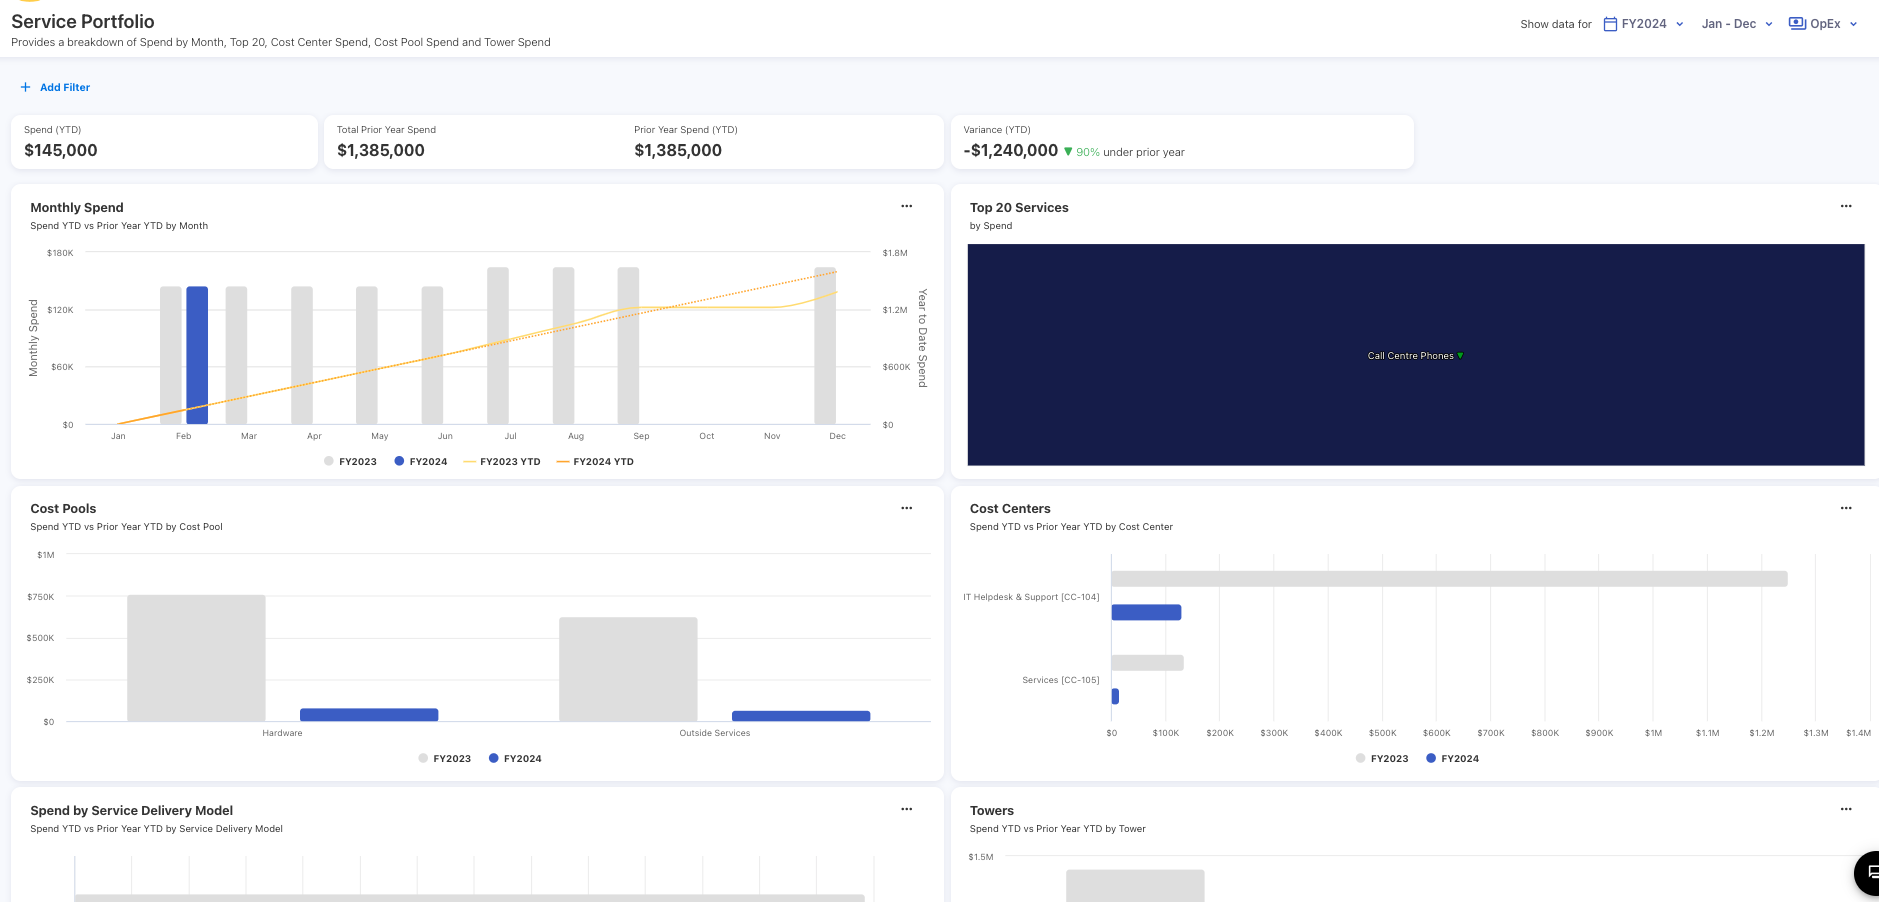
Service Portfolio
Provides a breakdown of Services spend by month, Cost Centers, Cost Pool Spend and Towers. The dashboard also includes charts for the Top 20 Services and Service Delivery Model by spend.
Enhancements
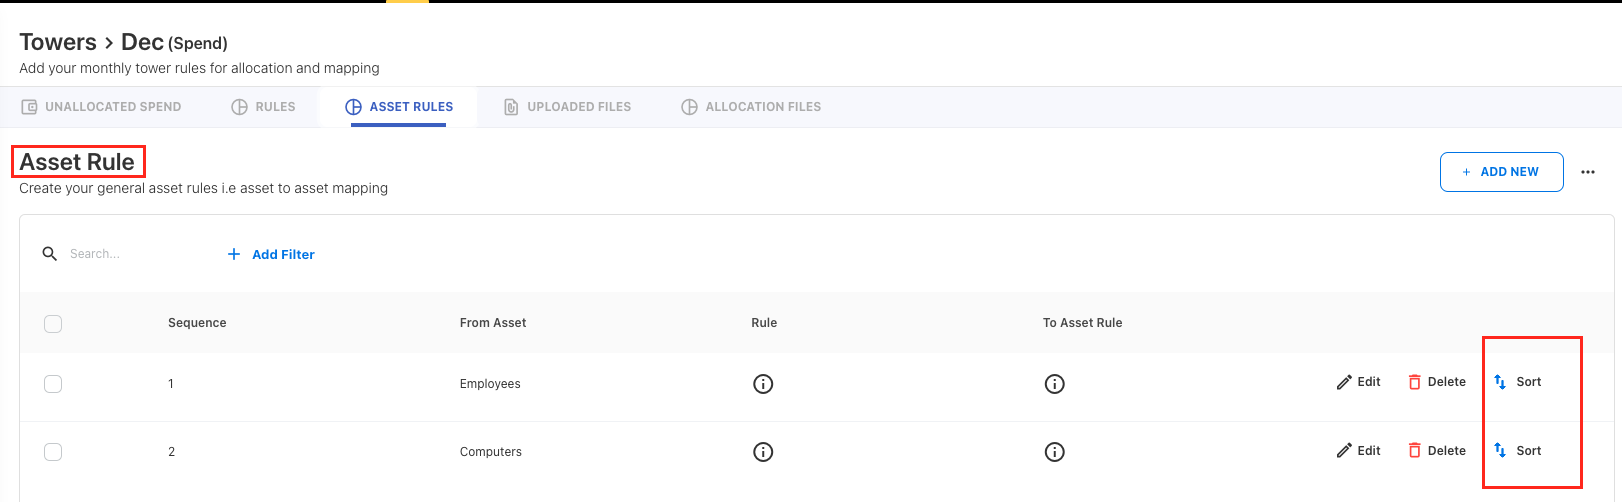
Asset Rules Sorting
Asset sorting functionality has been enabled for the asset rules. This allows the users to priotize the execution of the asset rules based on their preference.
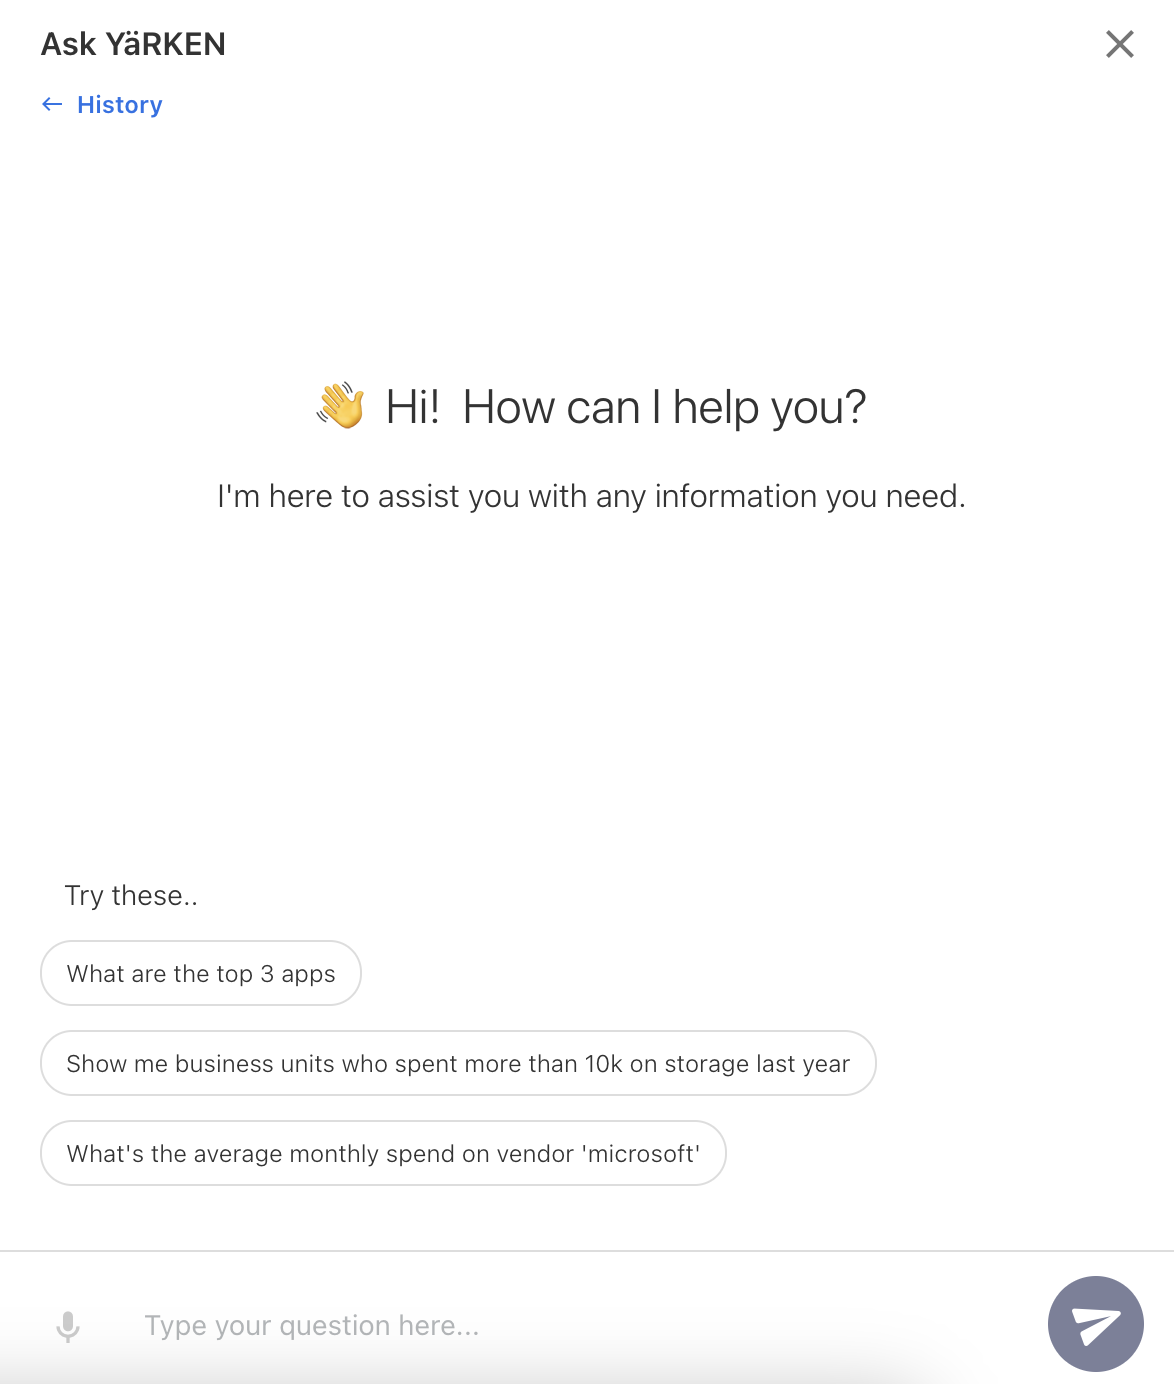
Ask YäRKEN UX
The suggested questions in the Ask YäRKEN are now clickable.
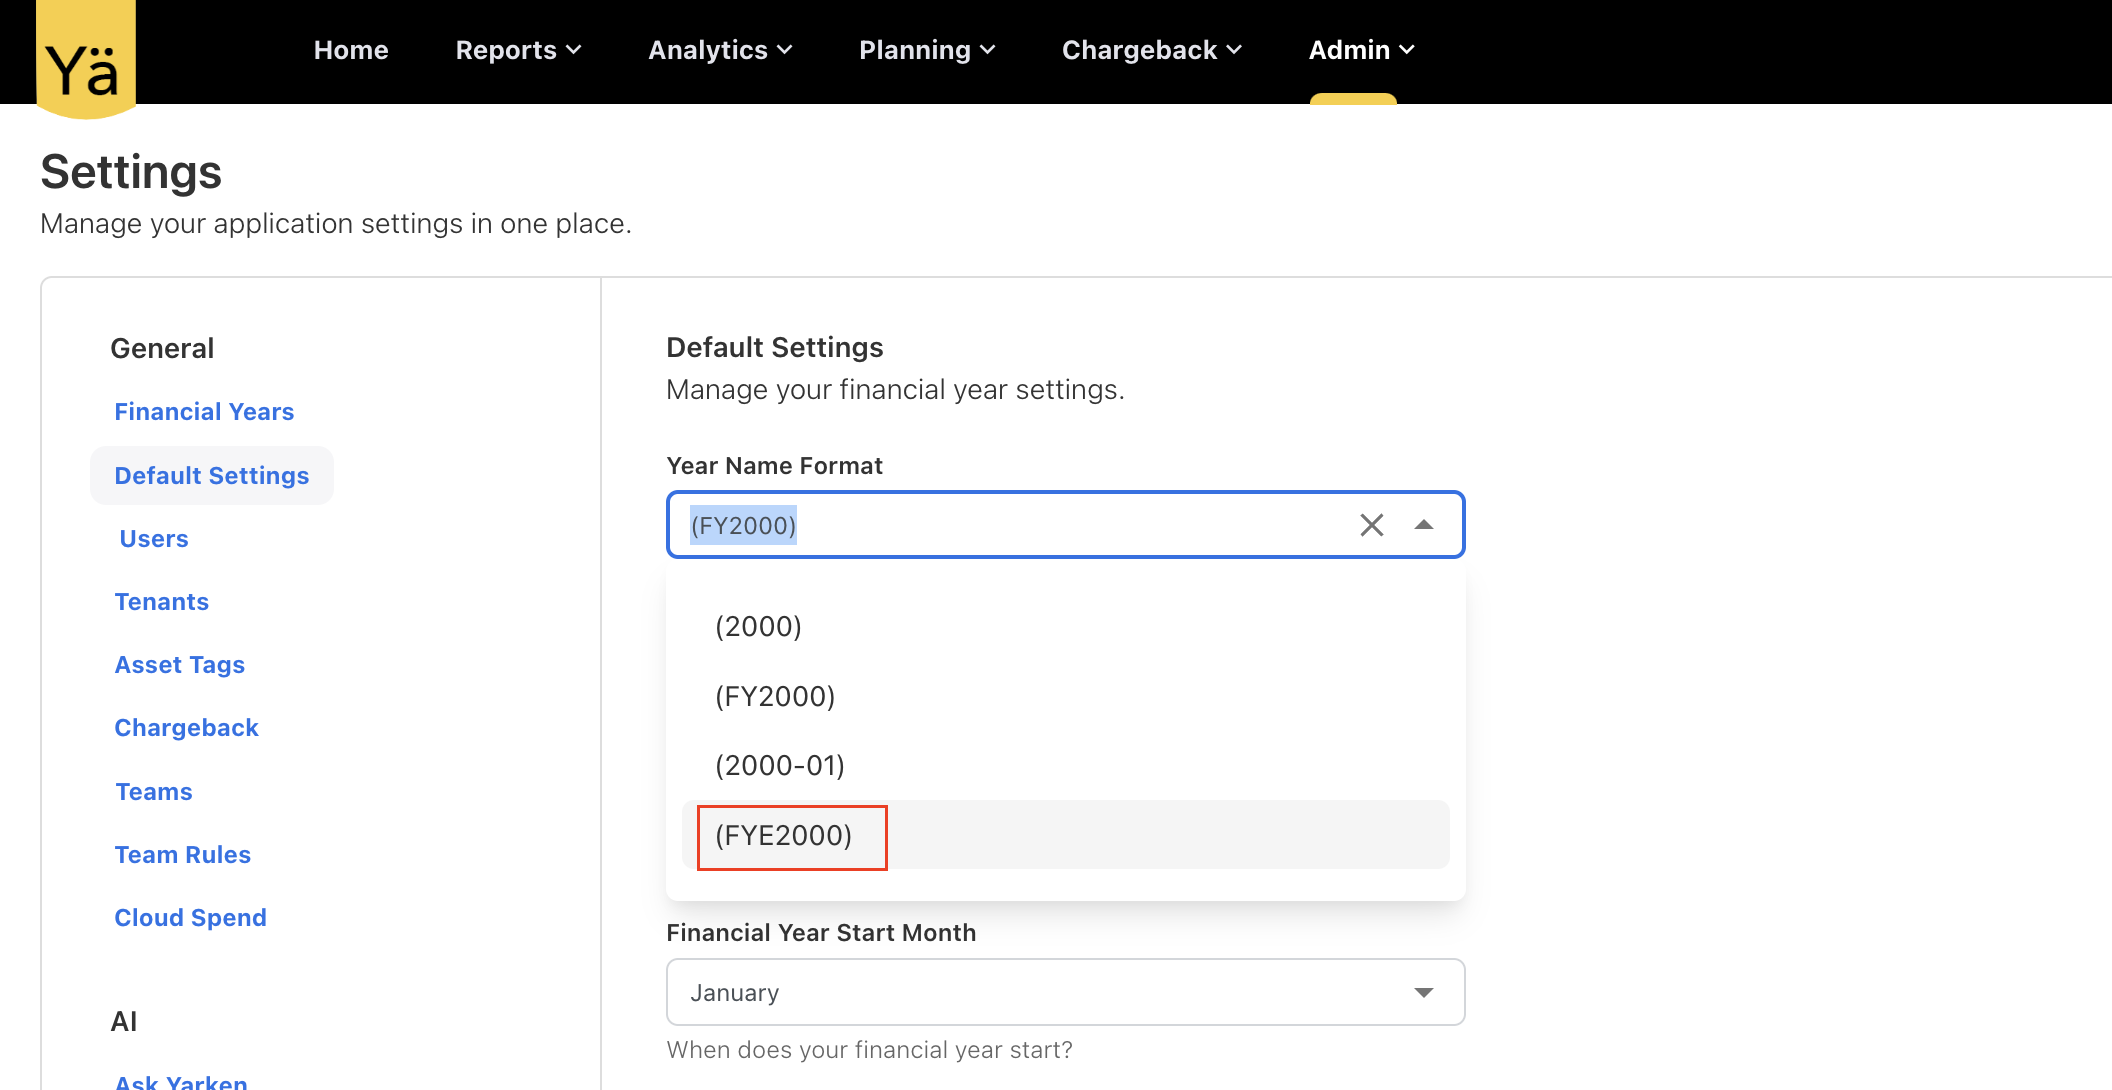
New Financial Year End (FYE) Format
We have introduced a new format, FYE2000, to indicate the financial ending year.
April 15, 2024
New Feature
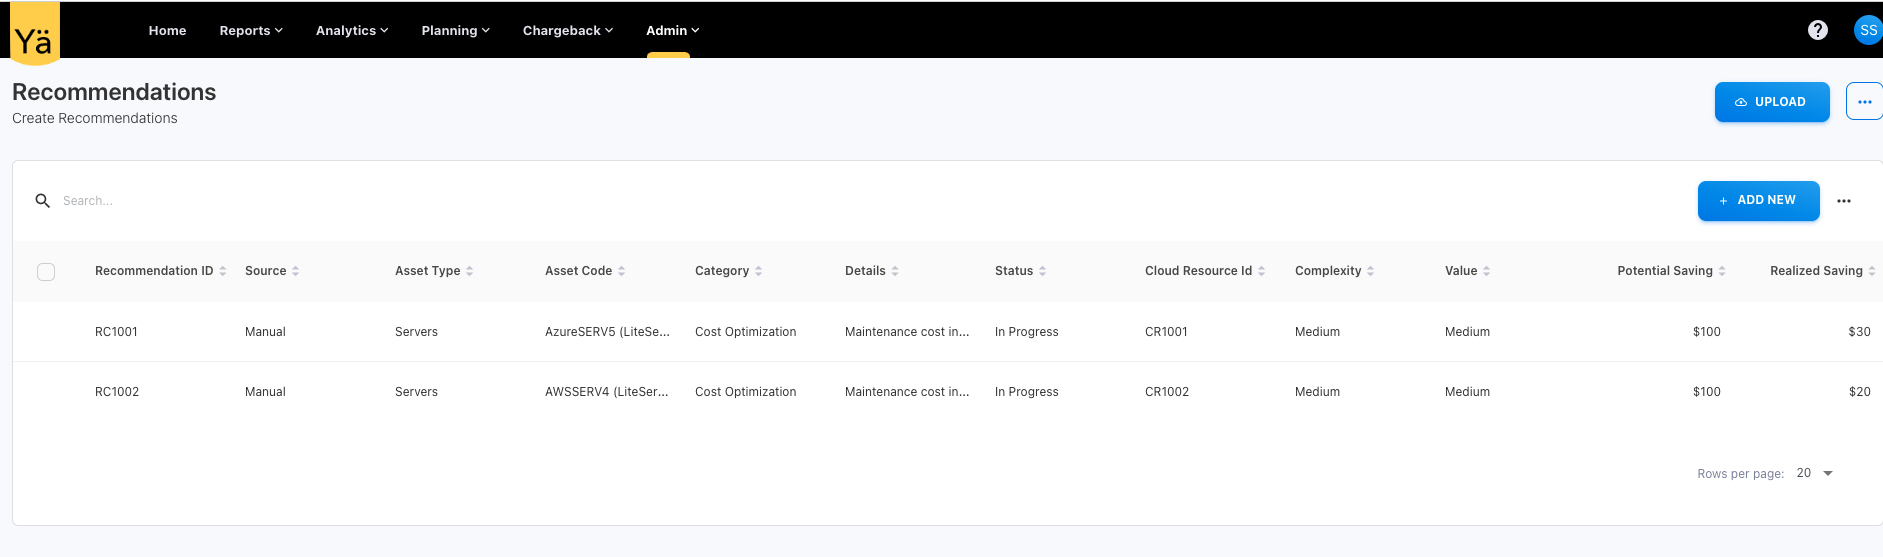
Recommendations
We’re excited to introduce a new manual-based Recommendations feature in the YäRKEN application. This feature is designed to provide users with personalized recommendations on all the assets for cost savings directly within the application. This new feature offers a comprehensive understanding of projected cost savings opportunities as well as the actual savings realized over time.
Highlights:
-
Manual Recommendations: Users now have the ability to manually add the recommendations for cost savings on different assets. The manual-based recommendation is used to identify unused resources and implement cost effective strategies.
-
Recommendations on Assets: This feature offers targeted recommendations tailored to specific assets.
-
Potential and Realized Savings: Recommendations are accompanied by key metrics, including Potential Savings and Realized Savings. Potential Savings represent the projected cost savings achievable after implementing the recommendation, while realized savings reflect the actual cost savings realized over time.
Enhancement
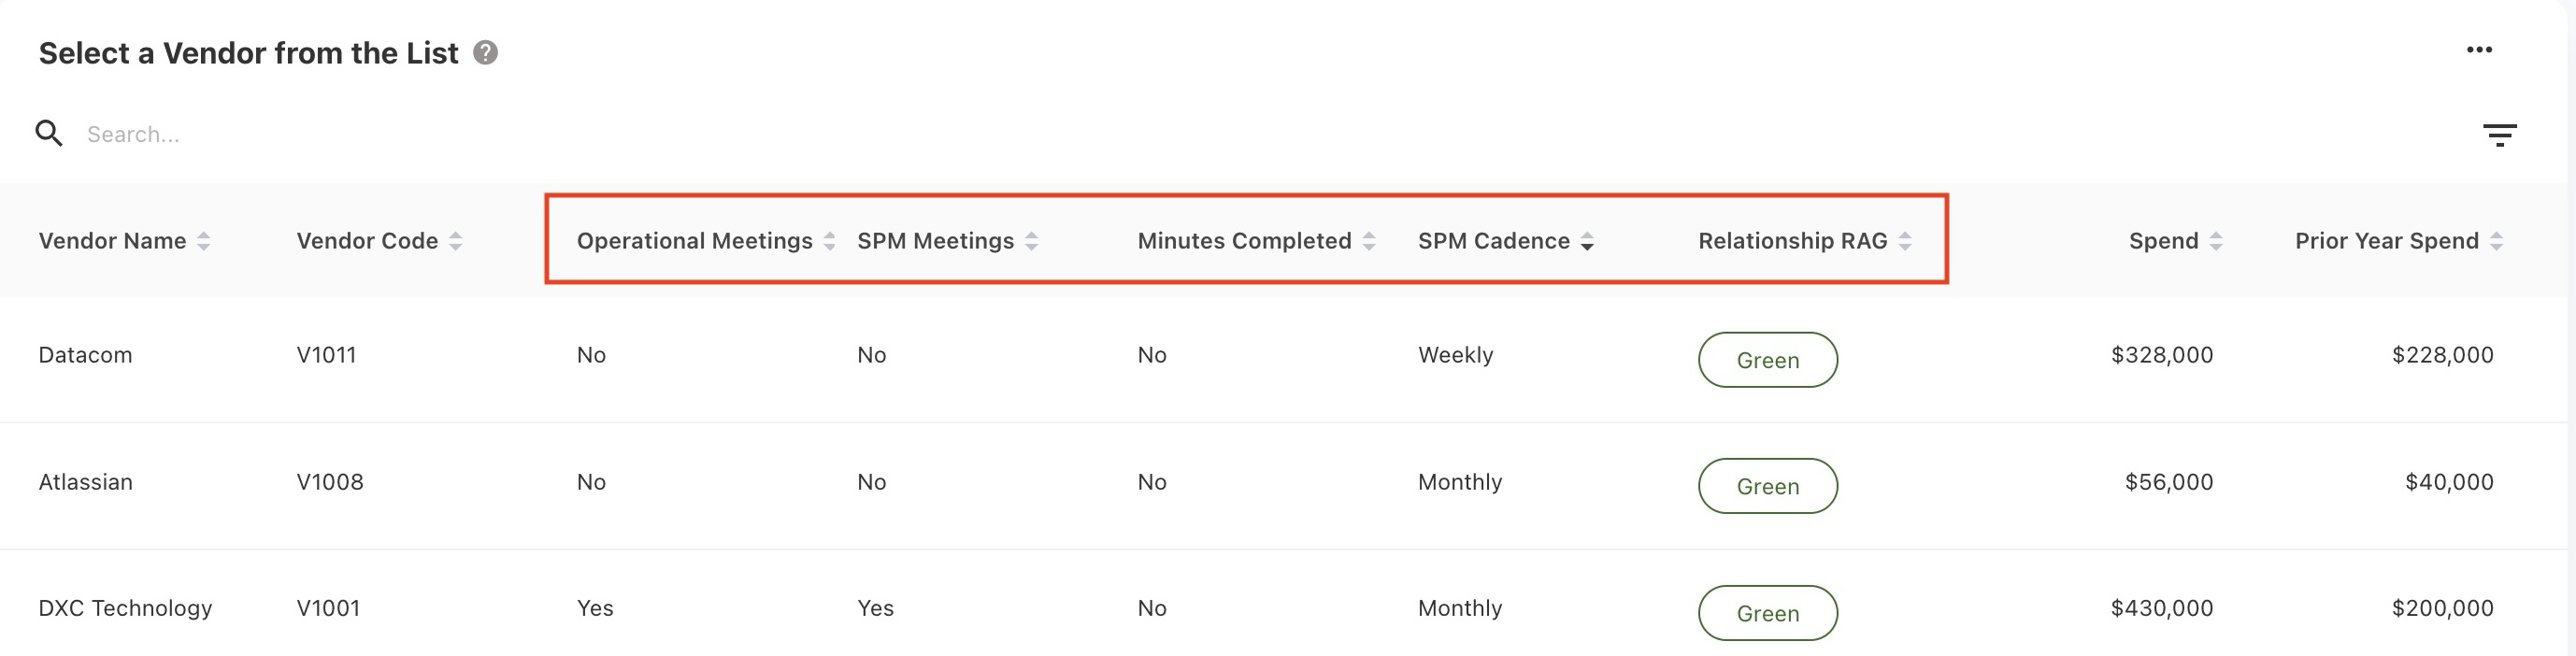
New Vendor Attributes
The vendor dashboard is enhanced to show the vendor metadata from the vendor records. We have added Supplier Performance Management (SPM) attributes to provide more comprehensive vendor insights.
-
Operational Meetings
-
SPM Meetings
-
SPM Cadence
-
Minutes Completed
-
Relationship RAG
Fixed Bug:
-
Fixed a bug while distributing to towers via allocation files, when asset relationships already exist, then the application was throwing an error, failing to insert the same relationship record again. The application now establishes a unique asset relationship by disregarding the existing one.
April 01, 2024
Ask YäRKEN - Enabled conversational mode
March 05, 2024
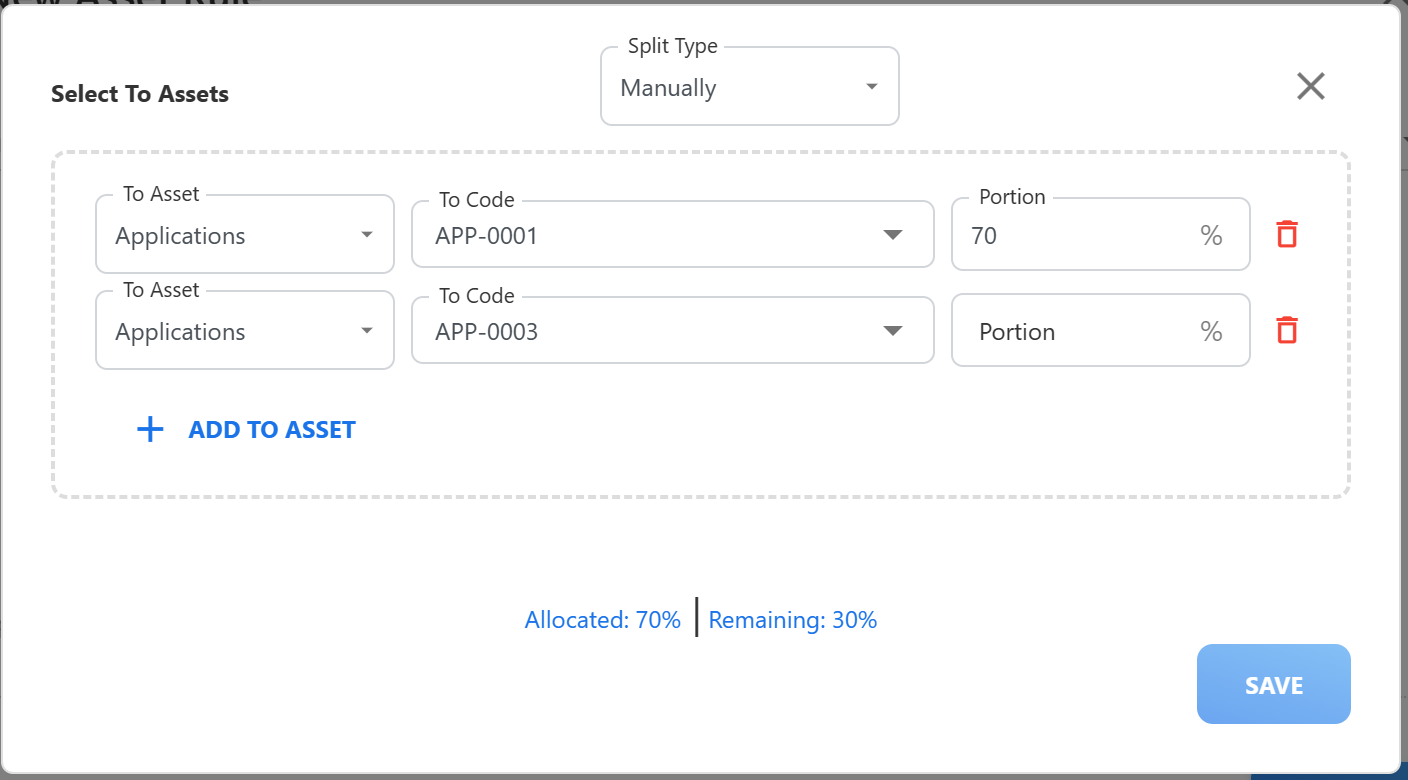
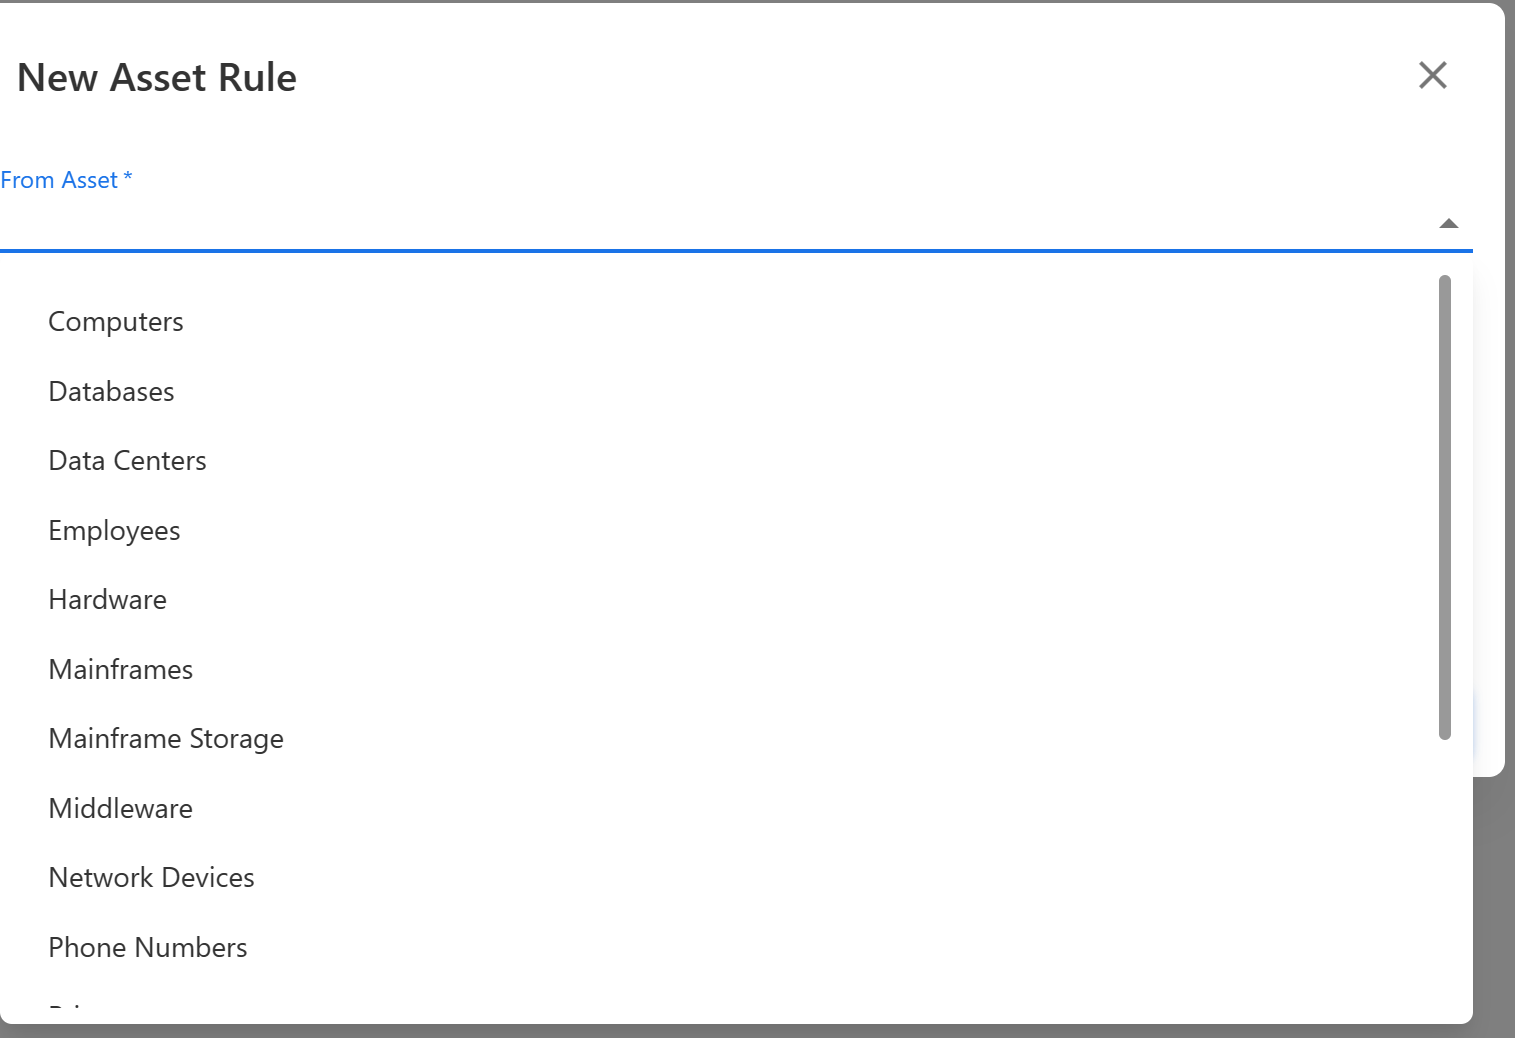
You can now create Asset Rules and split your spend across multiple assets.
February 27, 2024
Asset Rules can now be created using any asset type as source and not just cloud assets.
February 20, 2024
YäRKEN now supports you on you Cloud Forecasting and FinOps adoption journey. Use our cloud forecasting capabilities to collaborate with Engineering Teams, FinOps Practitioners, Finance and Business/Service Owners to reduce your forecasting variance.
February 13, 2024
We have introduced new cloud based dashboards that allow you to
February 6, 2024
Value Metrics can now have a target as an absolute value or also changing planned values month by month.
January 30, 2024
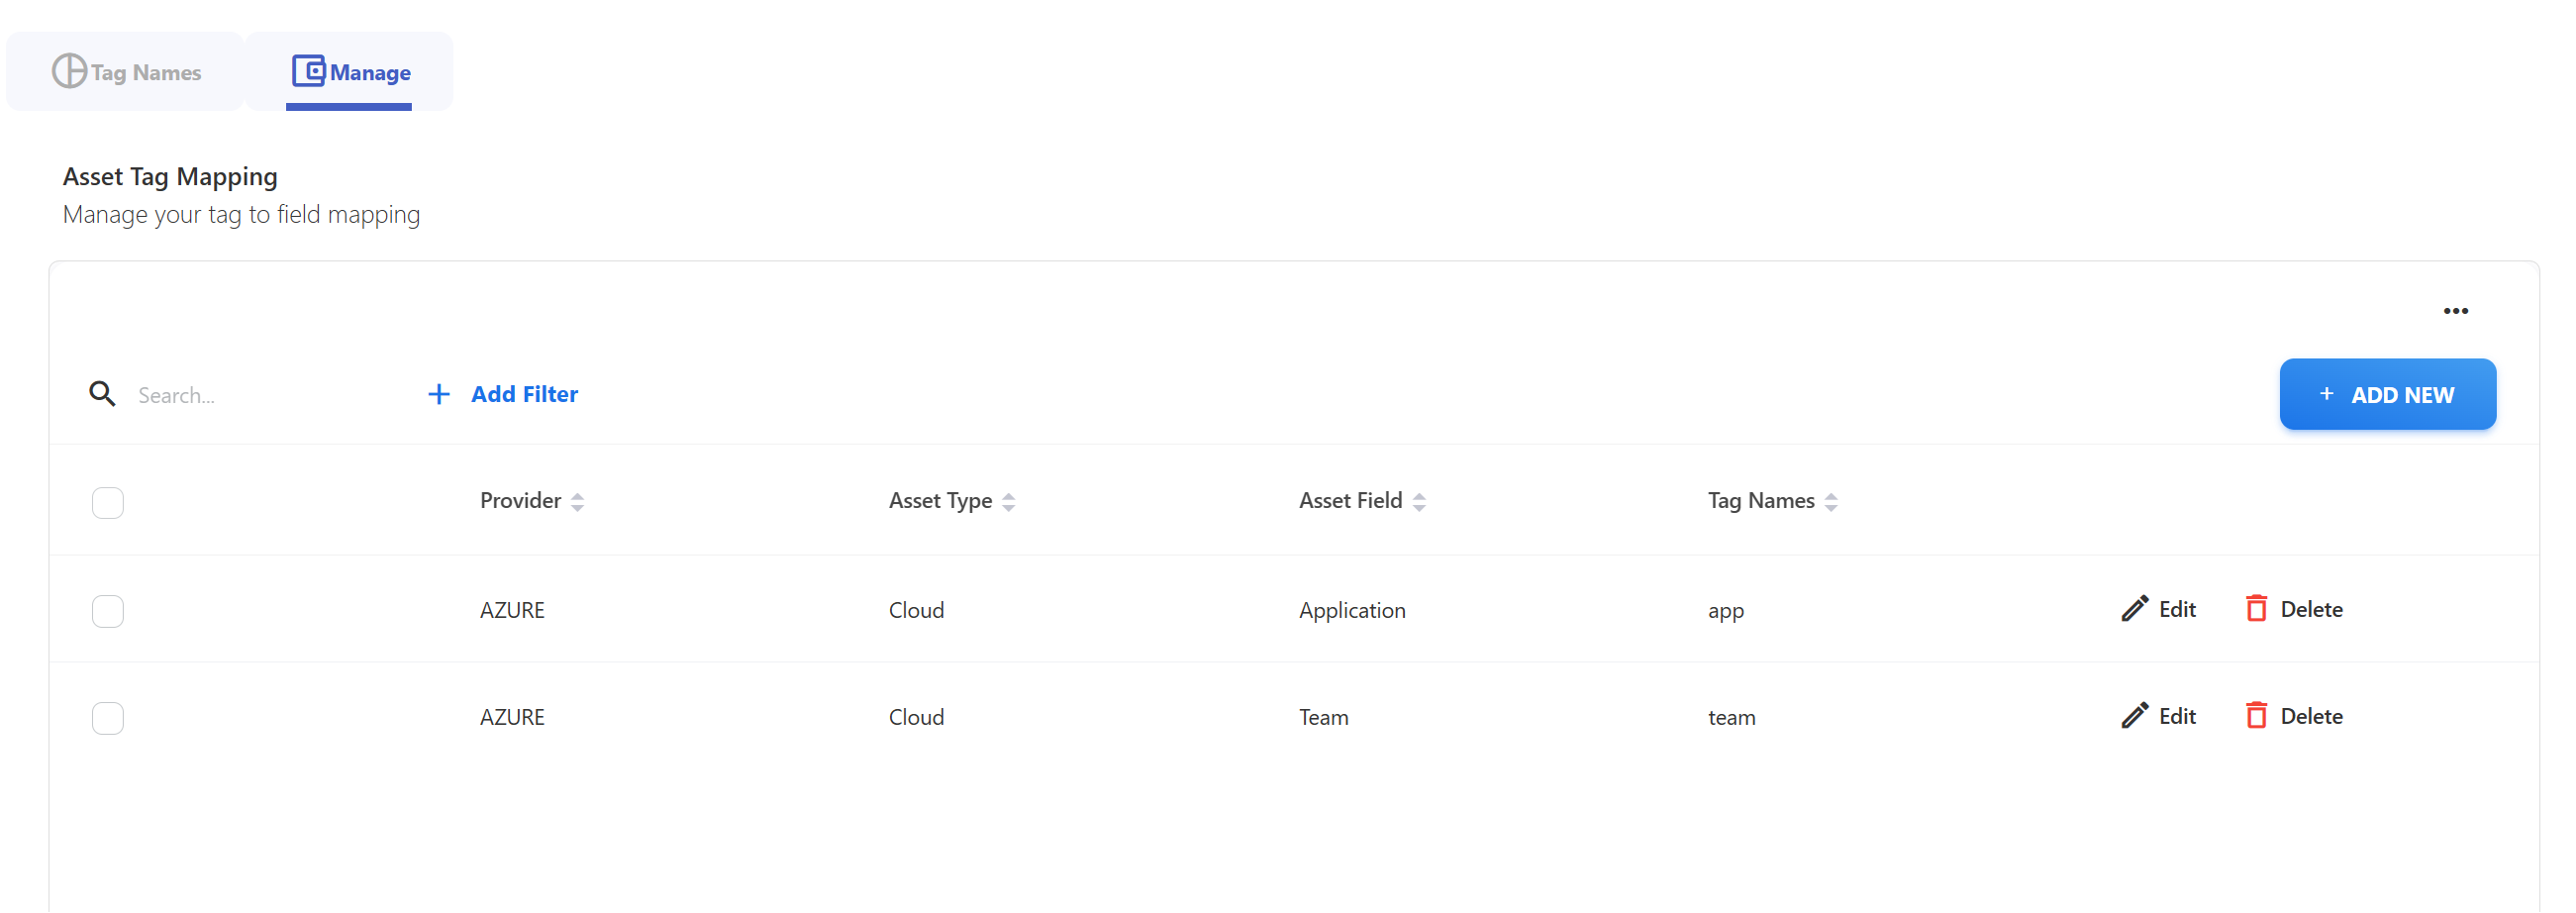
Use our new Asset Tagging and Asset Normalisation feature. When loading cloud spend you can now normalise your shifting tags into one standard tag and then use that information going forward to attribute spend to business objects like applications, products, services or teams.
January 2, 2024
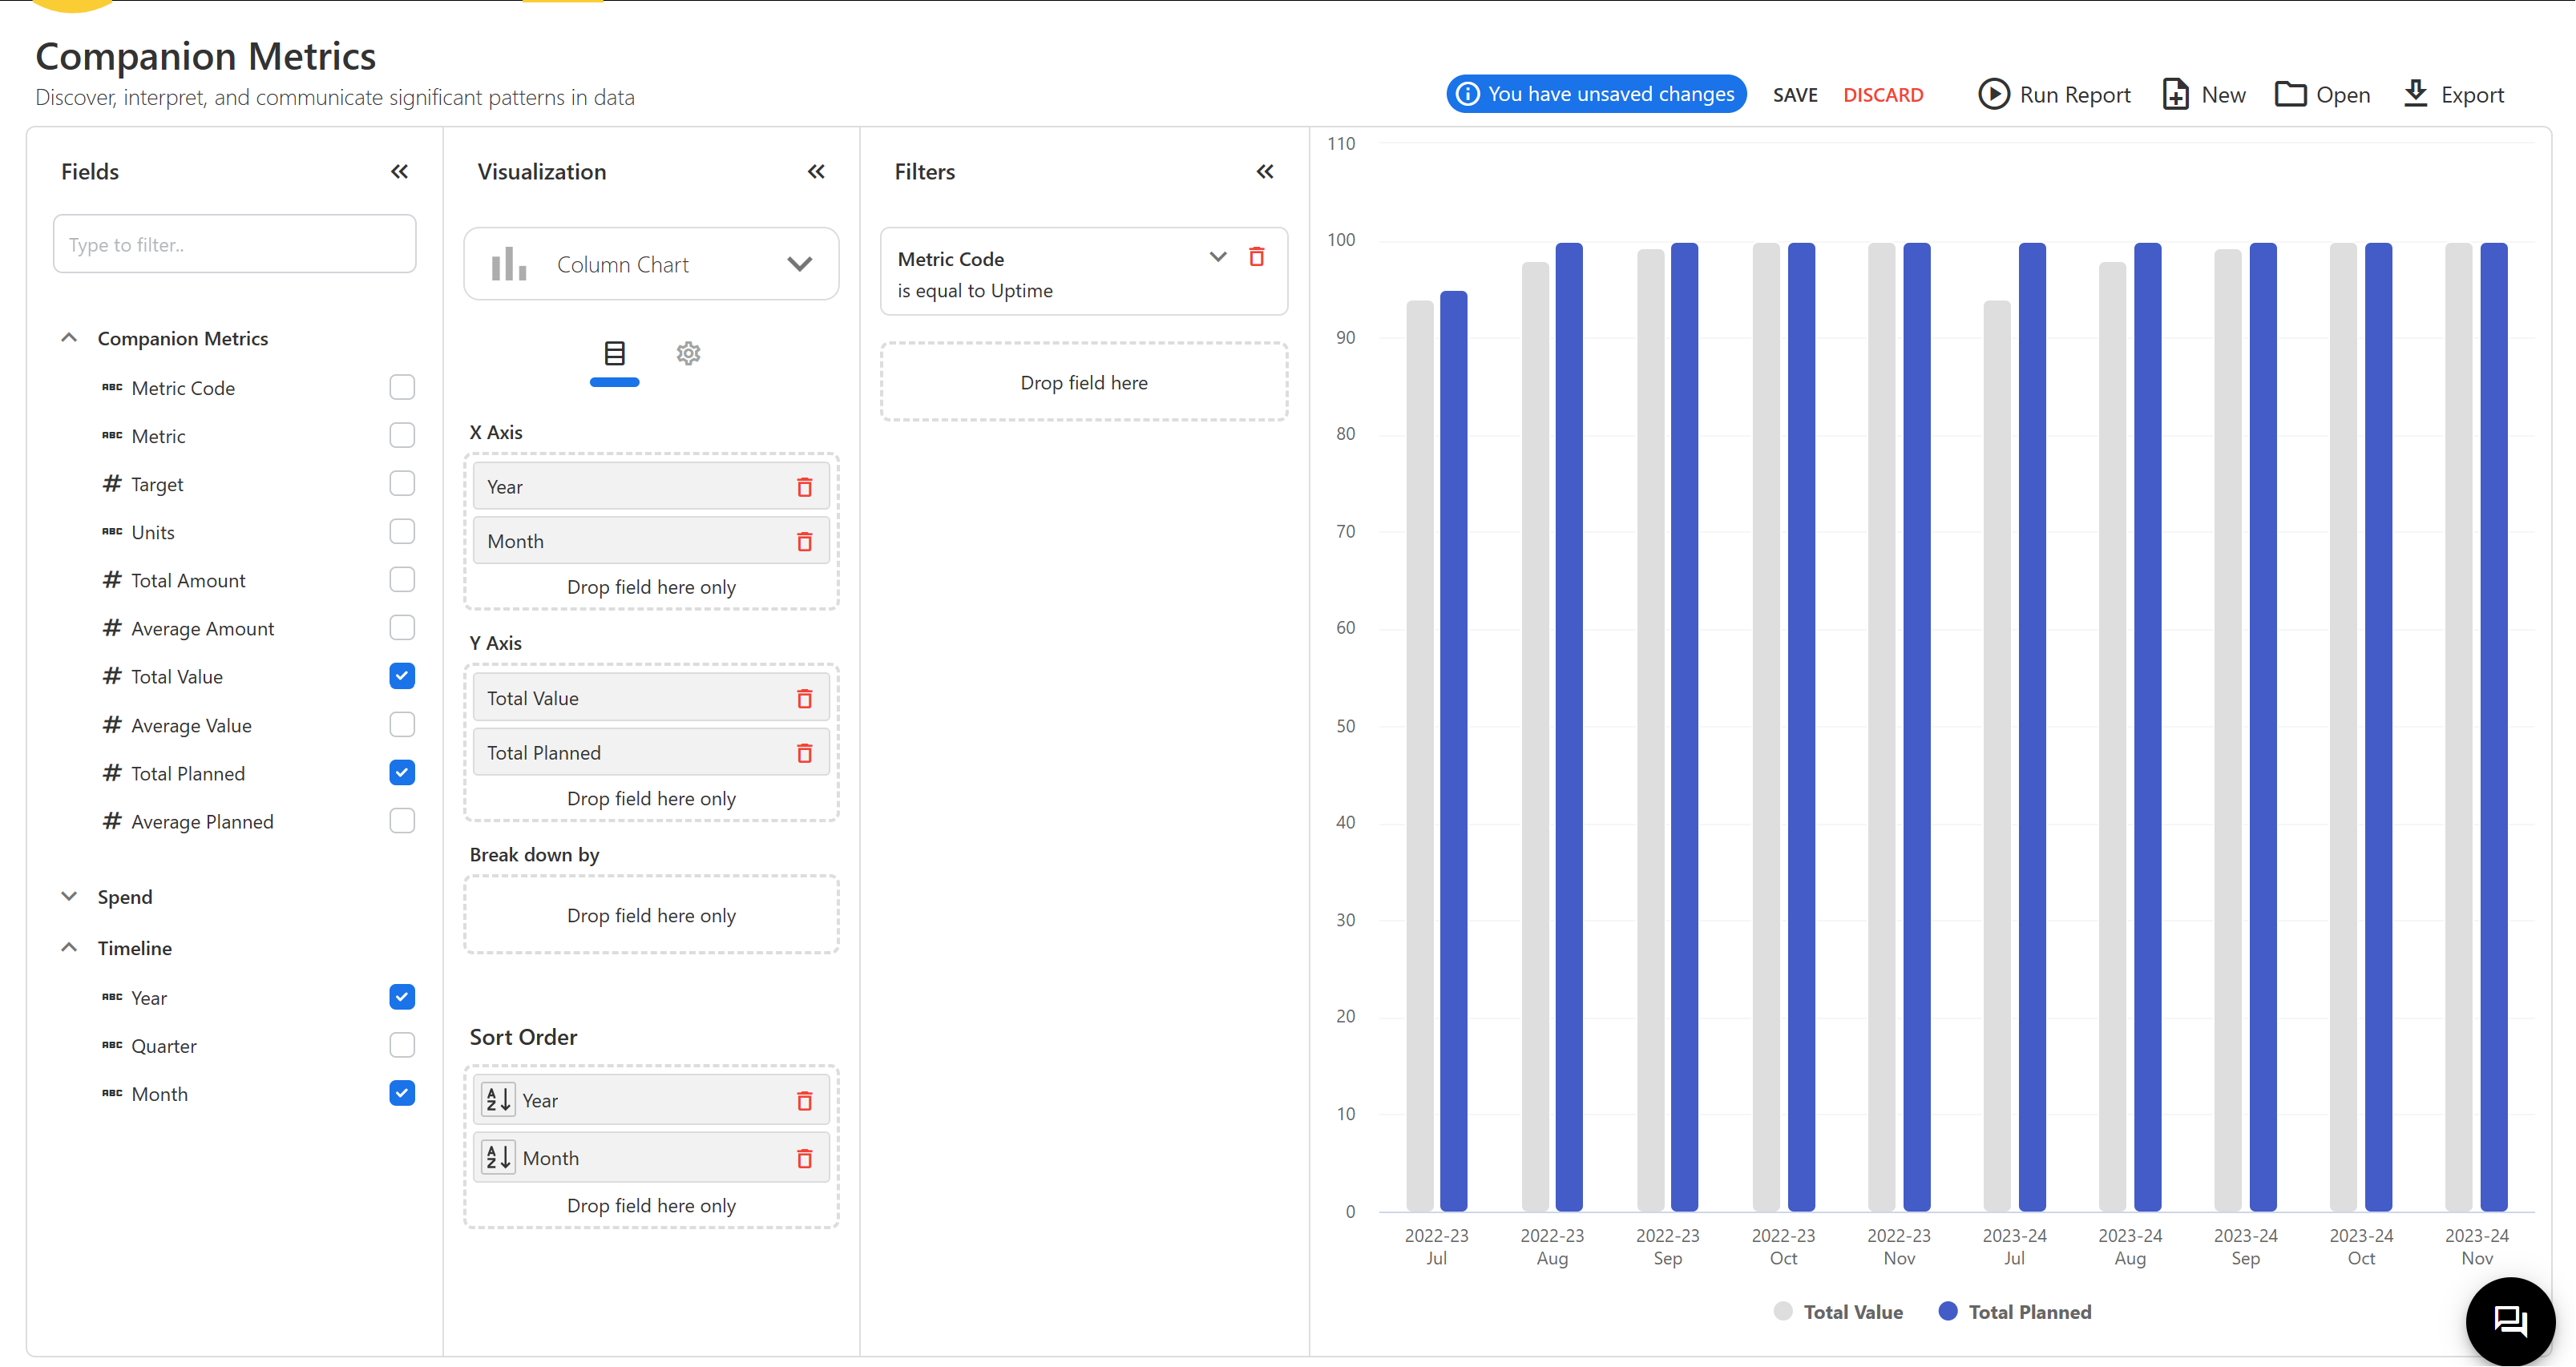
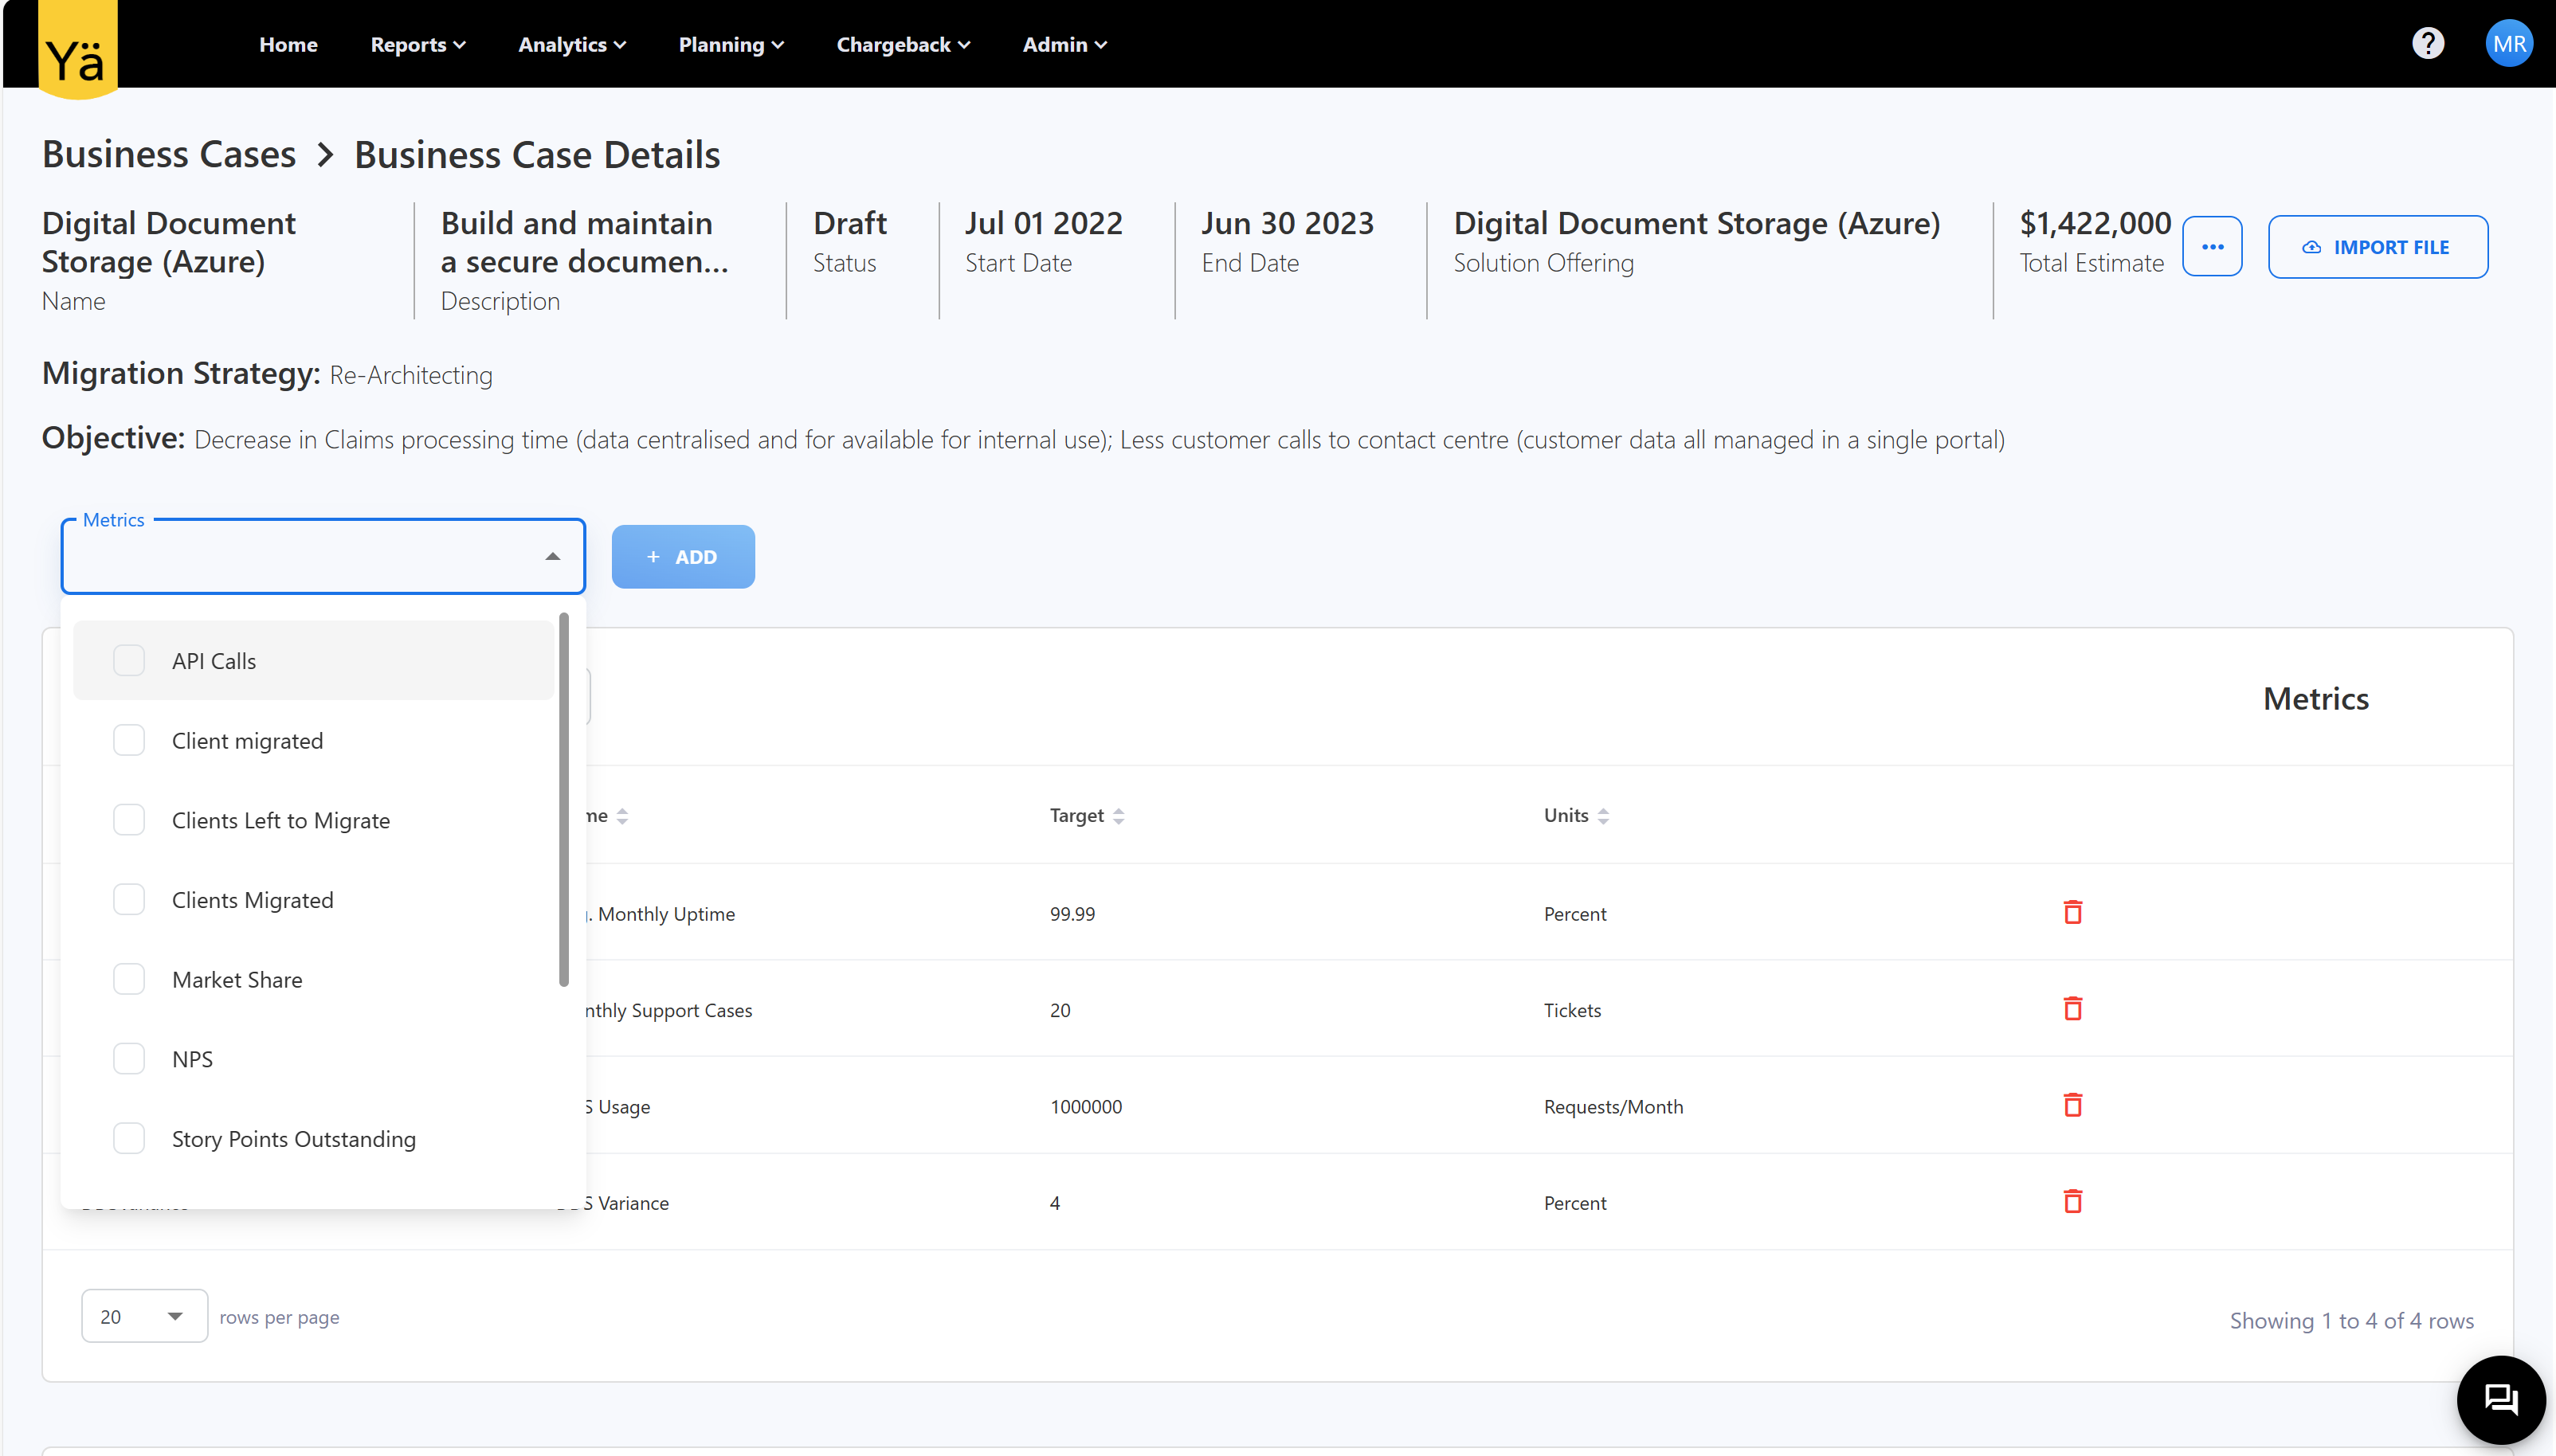
Business cases not only look at spend but also at expected outcomes and assumptions. Ideally outcomes and assumptions can be quantified, tracked and verified during and after a business case was selected and implemented. You can now use Yarken's companion metrics to create this additional dimension on your business case and set quardrails for your build and run phase.
Related content