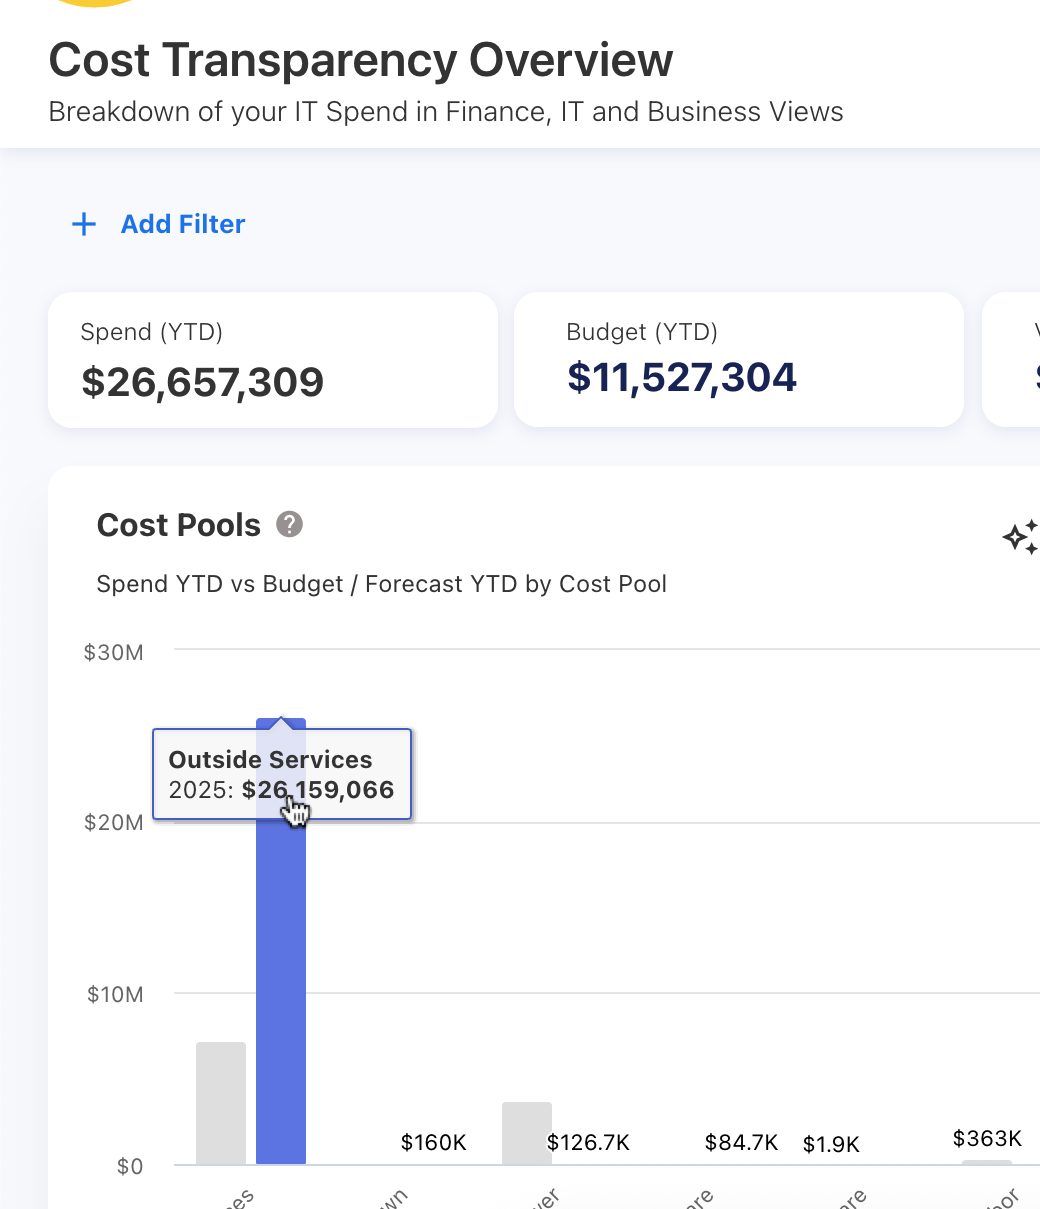
Dashboard and report titles
Each dashboard or report displays a title and description at the top of the page.
-
Hover over the title to access the Help icon, which provides context-specific guidance for that dashboard or report.
-
Titles help you quickly understand the purpose and scope of the data being displayed.
Global filters
Global filters apply across dashboards and reports and remain sticky as you navigate through the application.
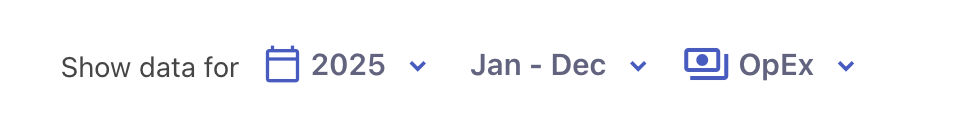
The following global filters are available:
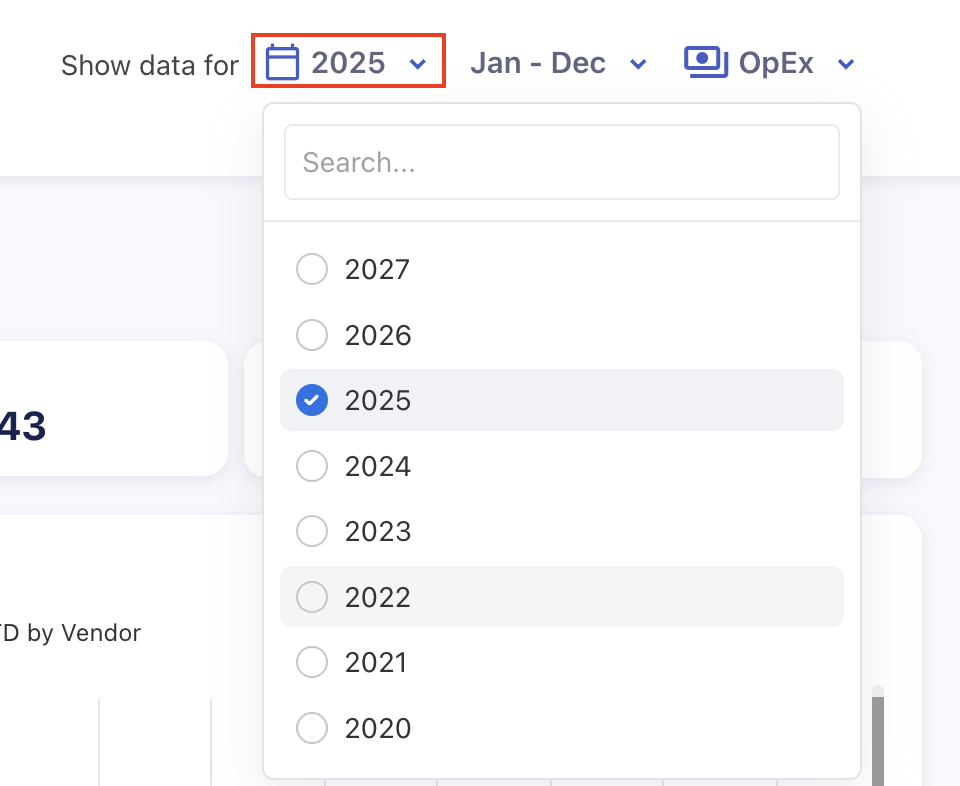
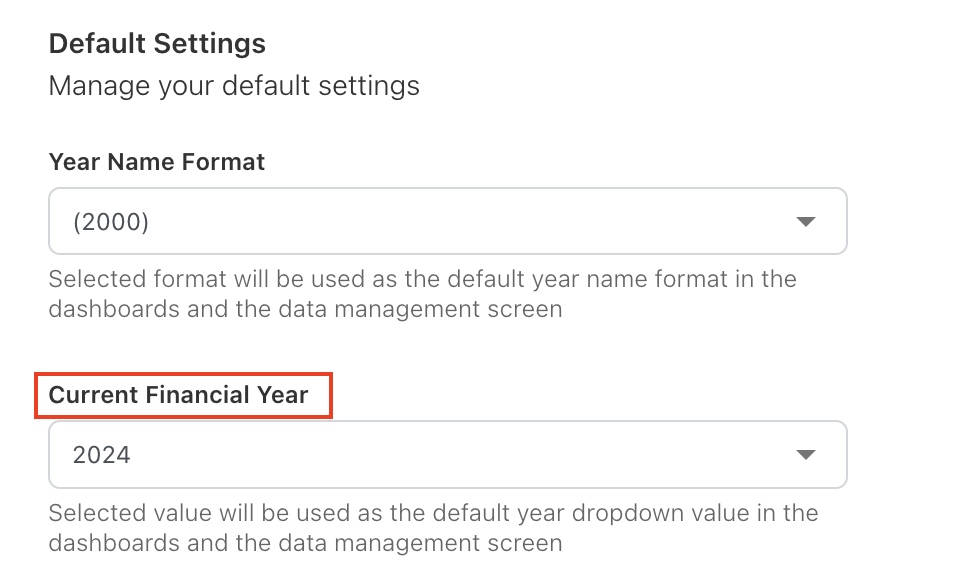
Financial year
-
Select the financial year to view data for that period.
-
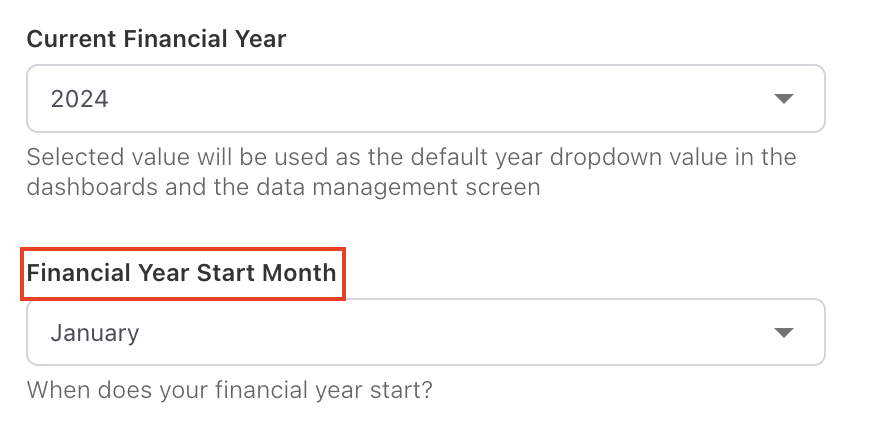
By default, the current financial year is selected and it can be configured in the Default Settings section.
-
The list of available years is sourced from the Financial Years defined in Settings.
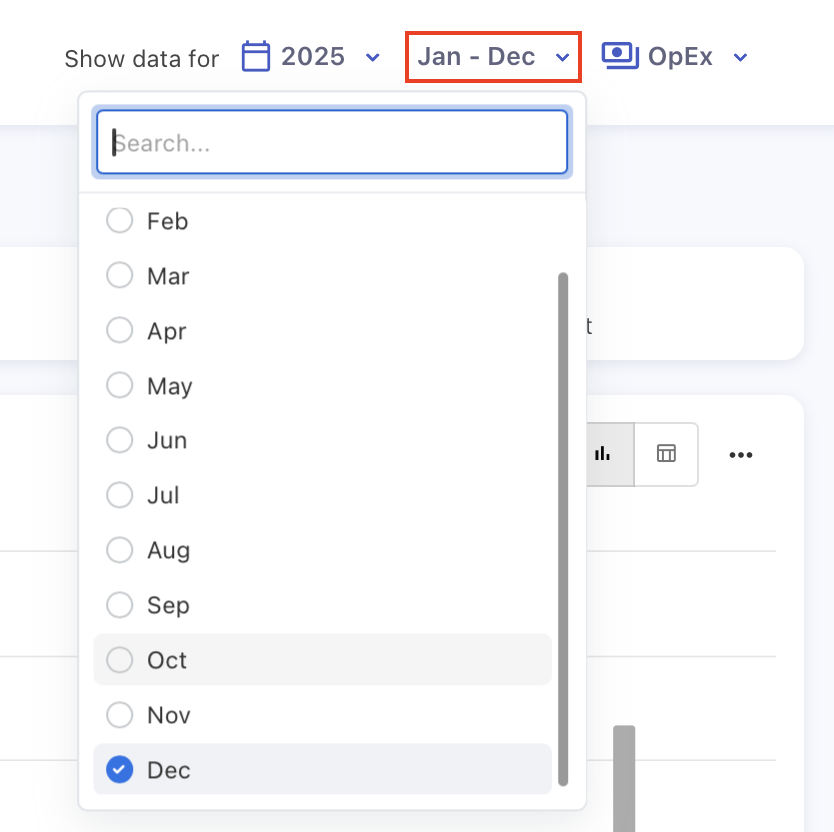
Month filter
The Month filter allows you to control how much of the selected financial year’s data is included in dashboards and reports.
-
The filter lists all months within the selected financial year.
-
The start month can be defined from the Financial Year Start Month configuration in Default Settings.
-
Data is displayed beginning from the configured starting month up to the selected month.
-
Year-to-date (YTD) values are calculated up to and including the selected month.
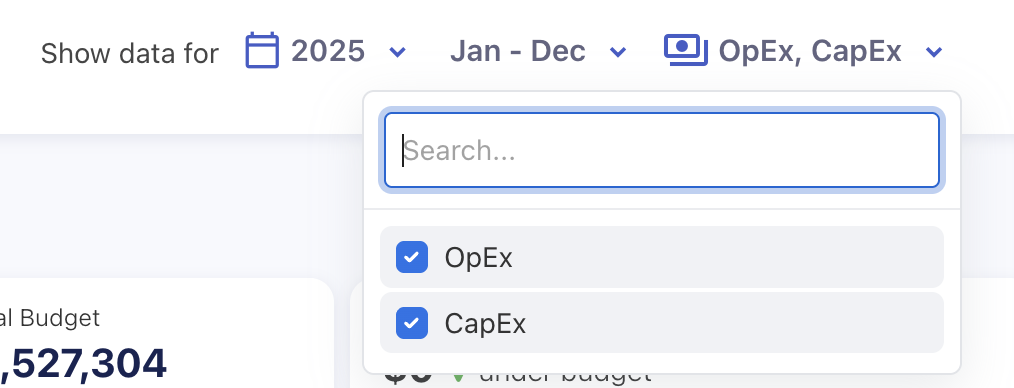
Expense type (OpEx / CapEx)
-
By default, all spend is filtered to OpEx.
-
You can change the filter to view CapEx or both OpEx and CapEx, depending on your analysis needs.
Drill-down
Yarken supports interactive drill-down across dashboards and reports.
-
Click on any chart element to drill down into a more detailed view.
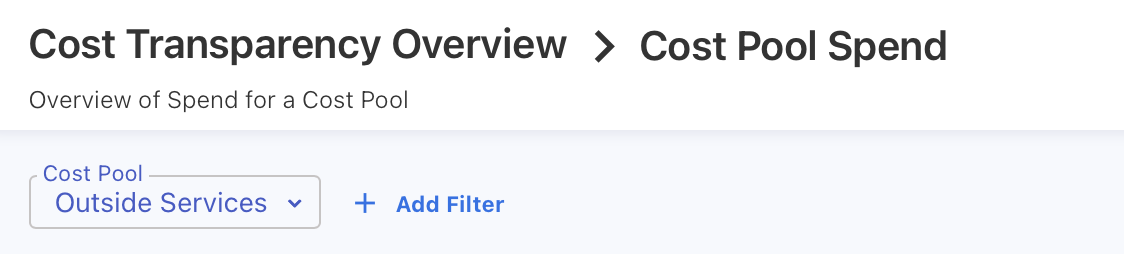
Breadcrumb navigation
When you drill into a dashboard, Yarken displays a breadcrumb trail at the top of the page.
-
The breadcrumb shows where you are within the navigation hierarchy.
-
Click the dashboard name in the breadcrumb to return to the higher-level view.

Filters within dashboards and reports
Default filters
-
When you drill into a report, certain filters are applied automatically based on the context.
-
These filters are required for the report and can be changed.
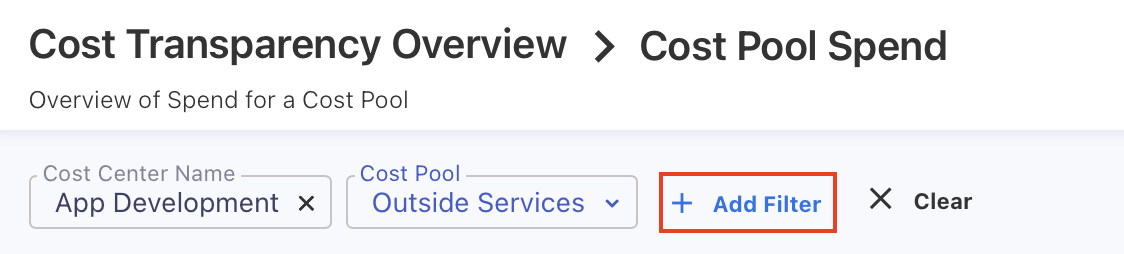
Additional filters
-
You can add additional filters to dashboards and reports to further narrow the data.
-
These filters:
-
Can be added or removed as needed
-
May support multi-select, depending on the field
-
-
Use the search box to quickly locate filter values or specific records.
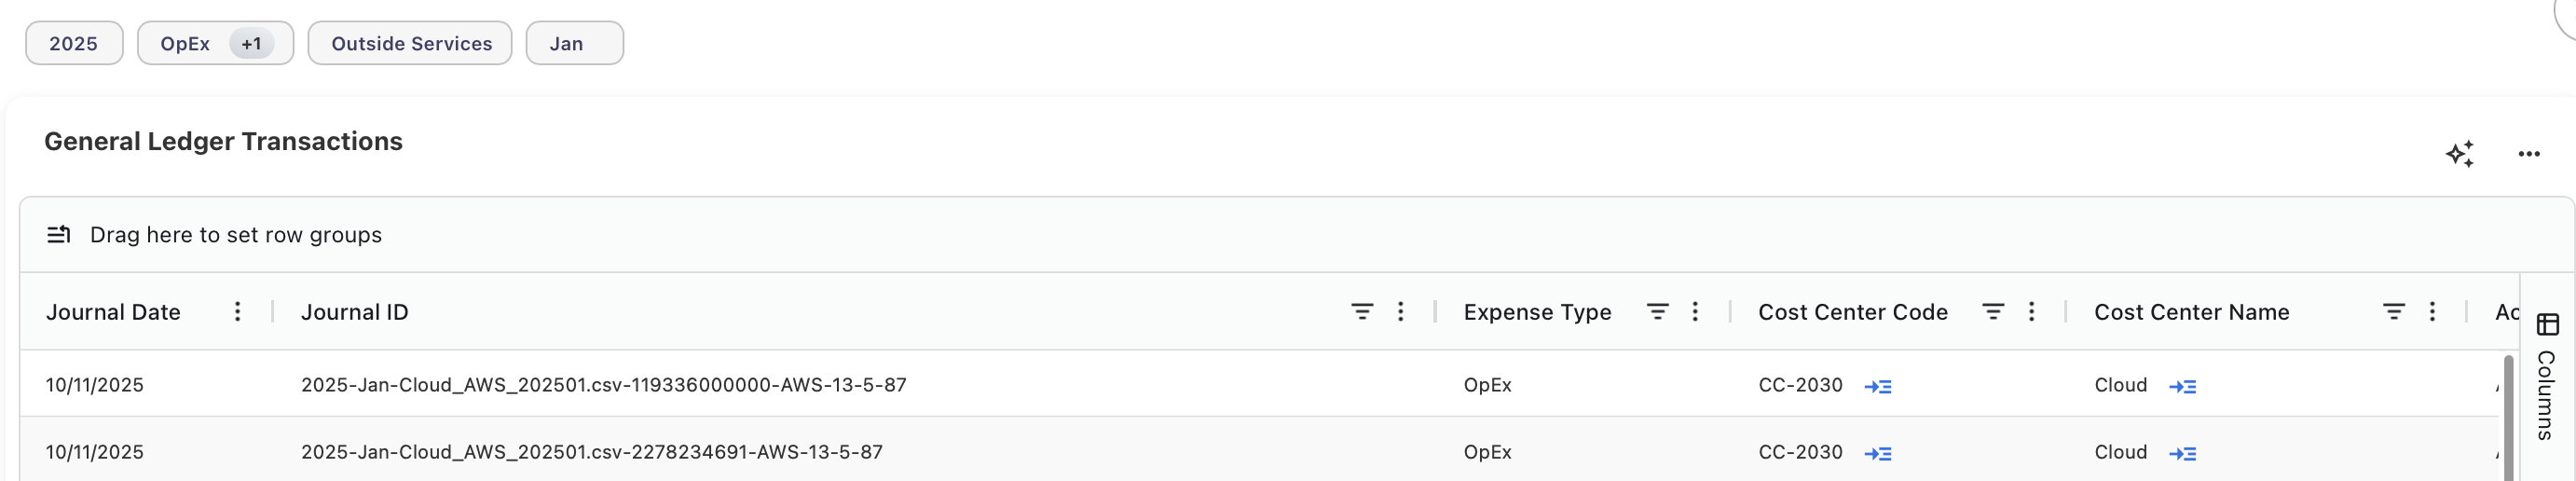
Transaction-level drill-down
From detailed reports, you can drill down further to view transaction-level data.
-
For spend data, this may include General Ledger line items.
-
For usage-based data (for example, phone bills), this may include itemized charges.
-
All active filters and context are preserved when viewing transaction-level details.