
Use this article to manage Copilots in Yarken.
What Copilots do
Copilots provide focused AI assistance within supported Yarken workflows. Administrators manage their availability under Admin > AI Studio > Channels > Copilots.
Current configurable Copilots include:
-
Costpool Rules Copilot — assists with creating and refining cost pool mapping rules.
-
Tower Rules Copilot — assists with creating and refining tower mapping rules.
-
Dashboard AI Narrative — generates AI-written narratives and summaries for selected custom-dashboard widgets and reports.
-
Graph Explanation Copilot — starts a conversation in Ask Yarken from a dashboard chart or widget, using the selected visual as context.
Graph Explanation Copilot uses the selected dashboard and widget as the starting context. You can use it to summarize widget data, investigate other supported widgets on the same dashboard, explore trends, compare reporting periods, adjust supported filters, and ask follow-up questions.
The active dashboard filters provide the starting filter context. During the conversation, you can ask Ask Yarken to adjust supported filters and re-query the data within the current dashboard.
Graph Explanation Copilot and Ask Yarken
Graph Explanation Copilot provides a chart-based entry point into Ask Yarken.
When you open it from a dashboard visual, Ask Yarken starts with the selected dashboard and widget already in context. You can then continue the conversation with follow-up questions without manually describing the reporting context.
Use this workflow when you want to investigate a specific chart, explore trends, compare periods, adjust supported filters, or investigate other supported widgets on the same dashboard.
Dashboard AI Narrative turns selected custom-dashboard content into a written summary. Costpool Rules Copilot and Tower Rules Copilot support their respective mapping workflows. Each Copilot uses the context and task of its supported workflow, while Ask Yarken supports broader conversational analysis across governed Yarken data.
Use Ask Yarken from a chart
To investigate a chart or widget:
-
Open the required dashboard.
-
Locate the chart or widget you want to investigate.
-
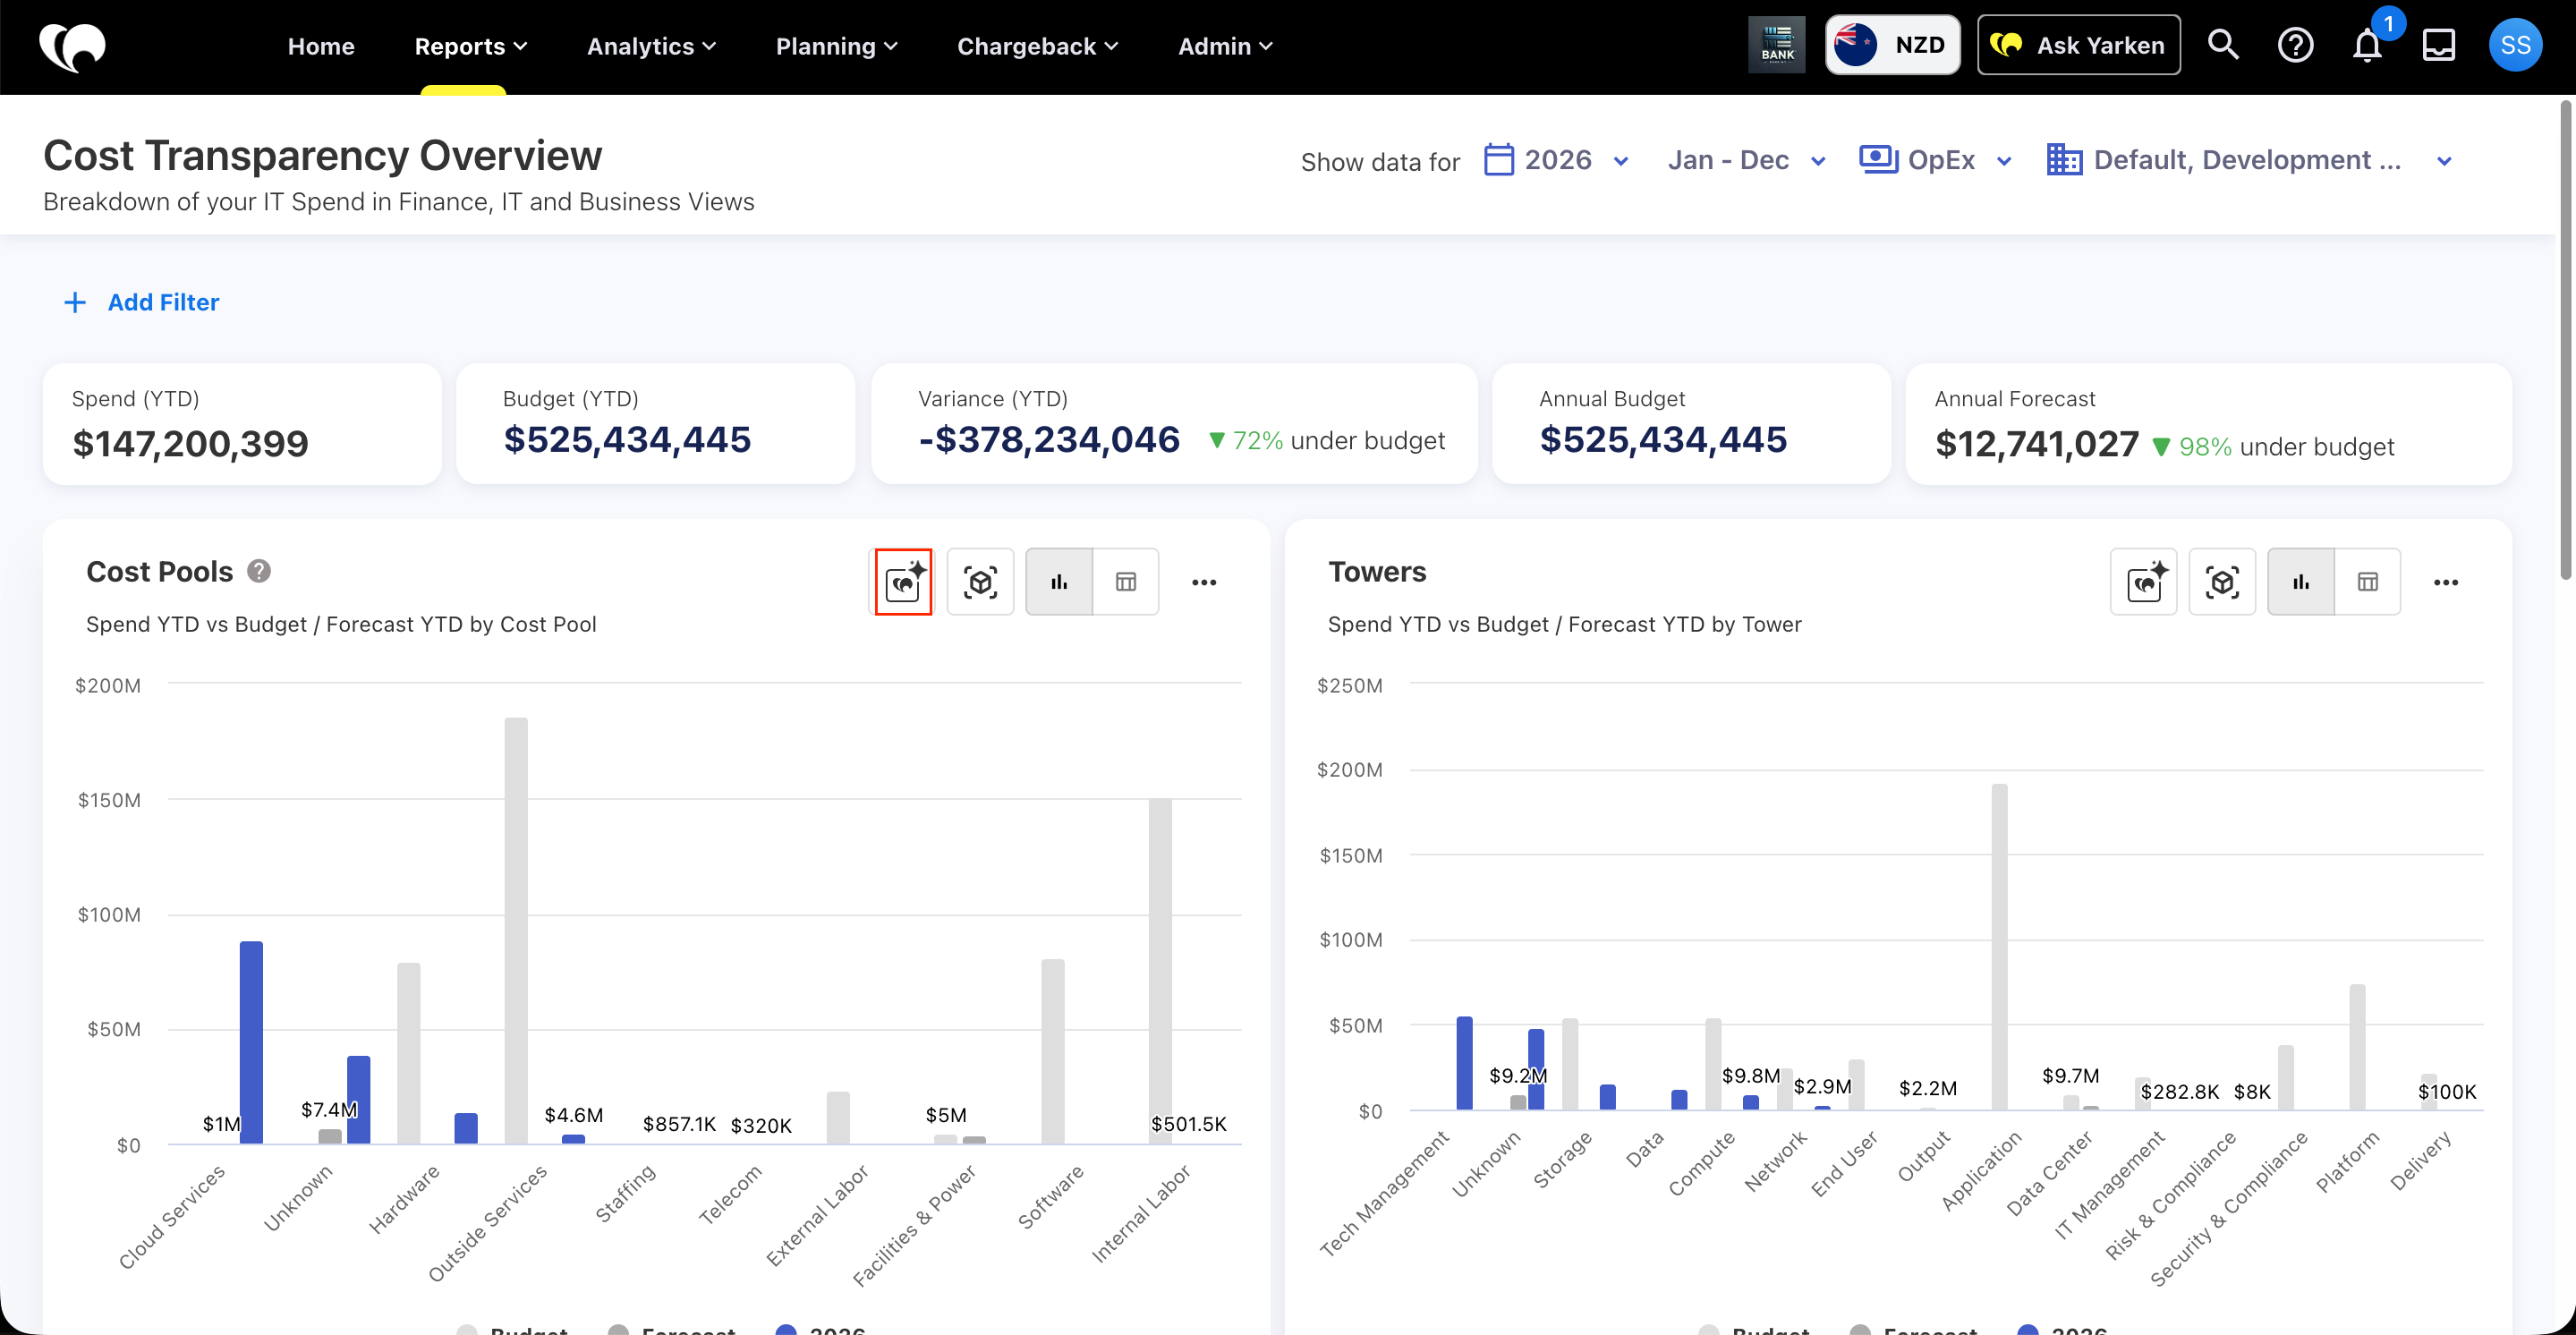
Select the Ask Yarken icon on the visual.
-
Ask Yarken opens with the selected Dashboard and Widget added to the conversation context.
-
Review the initial response.
-
Enter a follow-up question to continue the analysis.
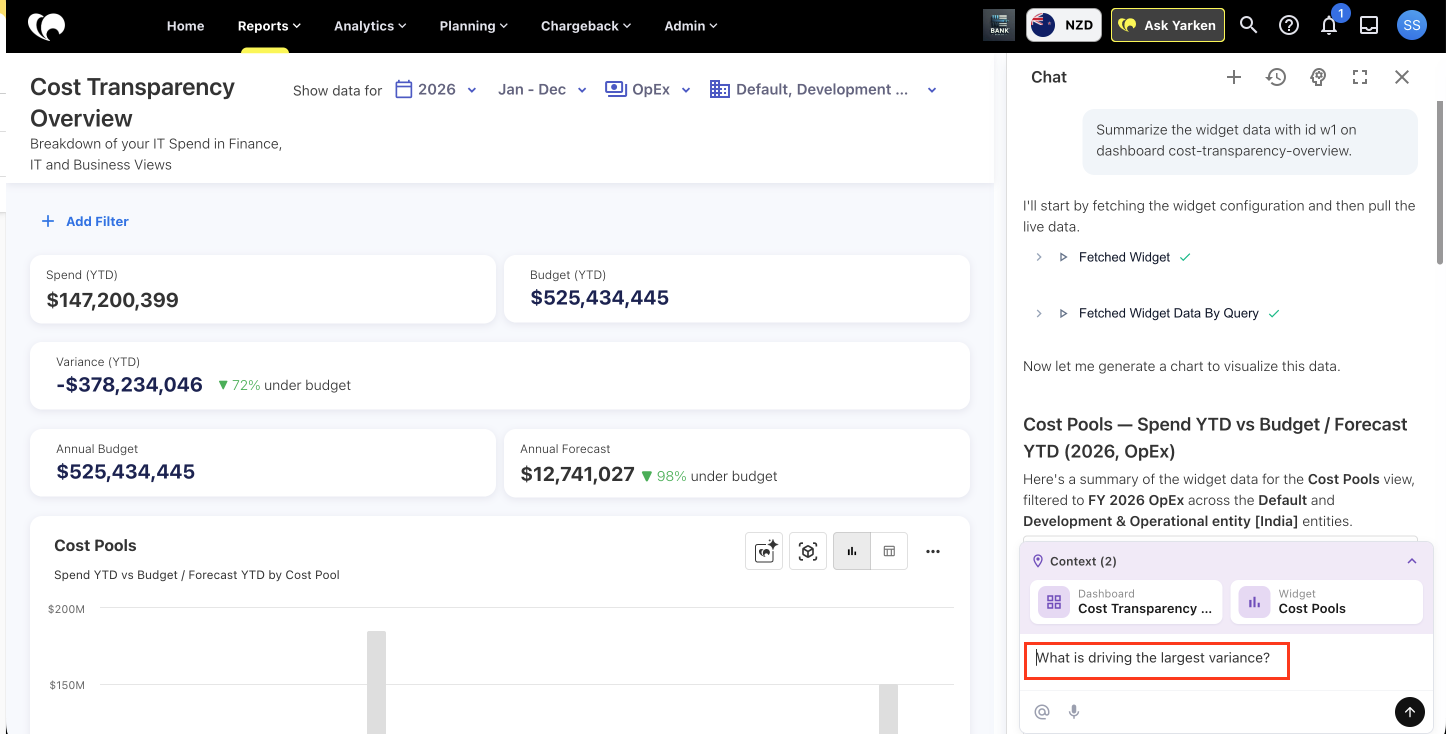
For example, you can ask:
-
What is driving the largest variance?
-
How does this compare with the previous period?
-
Which category changed the most?
-
Show the trend over the last six months.
-
Why is this category above budget?
You do not need to restate the dashboard or widget in each follow-up question. Ask Yarken retains the selected dashboard context during the conversation.
How chart context works
When you open Ask Yarken from a chart, Yarken adds the selected dashboard and widget to the conversation context. This helps Ask Yarken identify the data you want to investigate.
Graph Explanation Copilot works within the context of the selected dashboard. It can query the selected widget and other supported widgets available on that dashboard.
The active dashboard filters, such as Year, Month, Expense Type, and Entity, provide the starting context for the conversation.
You can also ask Ask Yarken to change supported filters during the conversation. Ask Yarken re-queries the dashboard data using the requested filter.
For example, if Expense Type is currently set to OpEx, you can ask Ask Yarken to compare the results with CapEx. Ask Yarken can apply the requested CapEx filter and retrieve the relevant data without requiring you to change the dashboard filter manually first.
You can also ask Ask Yarken to:
-
Change the year or month.
-
Filter to a specific Entity.
-
Switch between OpEx and CapEx.
-
Investigate another supported widget on the same dashboard.
Graph Explanation Copilot remains scoped to the current dashboard. Changing a filter does not extend the conversation to another dashboard or external data source.
What Graph Explanation Copilot can do
Within the current dashboard context, you can use Graph Explanation Copilot to:
-
Summarize widget data — review the current data and identify important patterns.
-
Adjust filters — change supported filters, such as Year, Month, Expense Type, or Entity, and re-query the dashboard.
-
Explore other widgets — ask about other supported metrics, charts, or tables on the same dashboard.
-
Compare data — compare periods, classifications, and other available dimensions.
-
Create charts — generate supported visualizations, including column, stacked column, line, and pie charts.
-
Analyze variances — review actuals against available budget or forecast data and identify significant variances.
-
Identify patterns — highlight areas such as overspend, underspend, unassigned classifications, or spend concentration.
-
Suggest next steps — provide recommendations based on the available dashboard data.
Current limitations
Graph Explanation Copilot operates within the context available from the current dashboard.
Keep the following limitations in mind:
-
Current dashboard only — it can query supported widgets on the current dashboard but cannot retrieve data from another dashboard in the same conversation.
-
Aggregated data only — it can analyze available dashboard dimensions and measures but cannot drill down to individual invoices, GL entries, or transaction-level records unless that detail is available within the dashboard context.
-
No cross-dashboard analysis — it cannot combine the current dashboard data with unrelated contract, cloud resource, license utilization, or other dashboard data in a single query.
-
No write-back — it can identify gaps or issues but cannot directly update budgets, forecasts, mappings, or other Yarken records from this workflow.
-
Dependent on source data — missing, incomplete, or unassigned data can limit the analysis.
-
No predictive forecasting — it can analyze actual, budget, and forecast values already available in the dashboard but does not generate new forward-looking forecasts or trend projections in this mode.
What admins can control
Administrators can:
-
Enable or disable the available Copilots, including Dashboard AI Narrative.
-
Add Graph Explanation Context.
-
Save the context used to guide explanations.
The widget author must also turn on Copilot for the dashboard widget before users can use it on that chart.
Graph Explanation Context
Use Graph Explanation Context to guide how chart explanations should be written.
Use it for:
-
Financial terminology.
-
Variance explanation style.
-
Filter interpretation.
-
Preferred emphasis, such as budget impact or operational drivers.
Keep the context short and specific.
Related content