
Overview
The P&L Report provides a structured, account-based view of your financial performance. It enables analysis of Actuals, Forecast, Budget, and Prior Year comparisons across Month-to-Date (MTD) and Year-to-Date (YTD) periods.
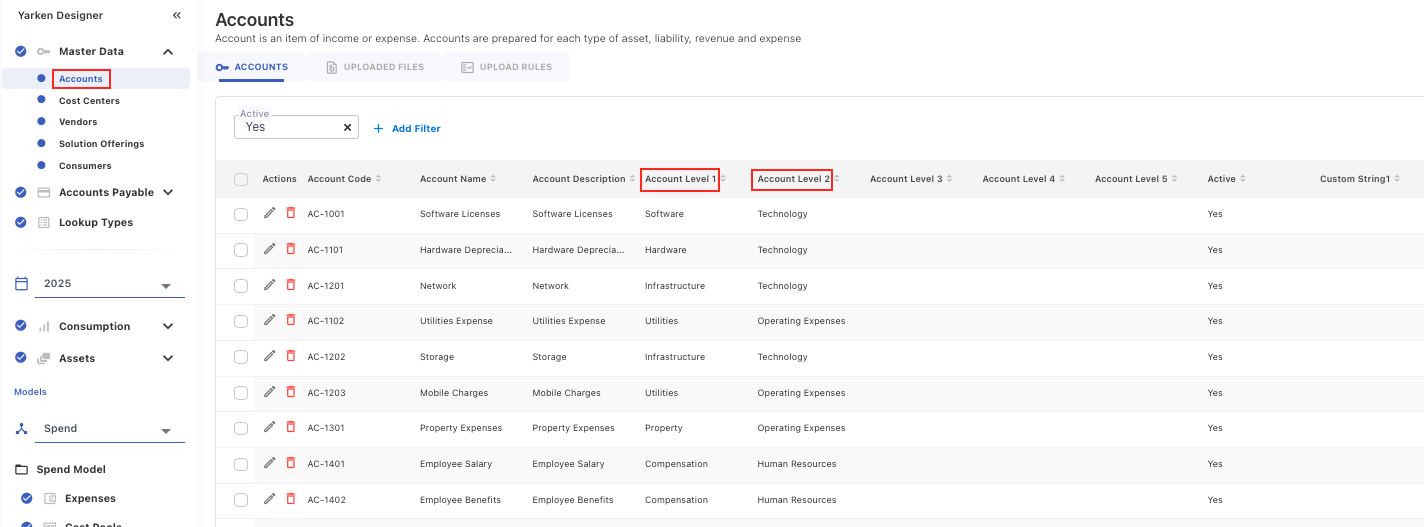
The report uses your account hierarchy from Master Data > Accounts to provide both detailed and aggregated financial insights.
This report is accessible via: Reports → Finance → P&L Report.
Data requirements
To generate this report:
-
Account hierarchy must be defined
-
Level 1 and Level 2 mappings
-
-
Actual spend data must be uploaded
-
Budget data must be available
-
Forecast data must be configured
-
EBITDA must be defined in the Companion metrics
Filters and context
At the top of the report:
-
Year – Select the financial year
-
Month – Select the reporting month
How filters work
-
MTD shows values for the selected month
-
YTD shows cumulative values from the start of the financial year up to the selected month
Report structure
Column definitions and formulas
Each section is split into MTD and YTD, with the following columns:
Actual
-
MTD Actual = Sum of actual spend for the selected month
-
YTD Actual = Sum of actual spend from start of year to selected month
Vs Forecast
Shows the variance between actual and forecast values.
Vs Budget
Shows the variance between actual and budget values.
Vs Prior Year
Compares current performance with the same period in the previous year.
How to read values
-
Positive numbers typically indicate higher spend than expected (depending on the column)
-
Negative numbers (often shown in brackets) indicate lower spend or unfavorable variance
Account hierarchy
The report is structured using Account Levels defined in master data.
Level 1 (Detailed accounts)
Individual accounts such as:
-
Compensation
-
Property
-
Utilities
-
Consulting
-
Hardware
-
Software
Level 2 (Aggregated categories)
Grouped categories displayed in bold, such as:
-
Human Resources
-
Operating Expenses
-
Professional Services
-
Technology
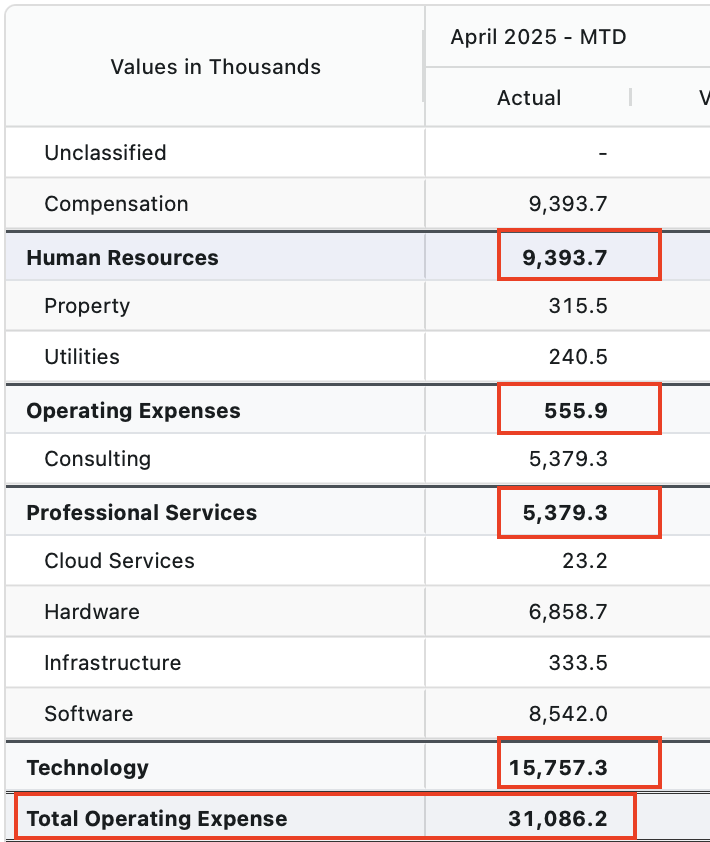
How Level 2 values are calculated
Level 2 values are derived as the sum of associated Level 1 accounts.
Examples:
-
Operating Expenses (Level 2)
= Property + Utilities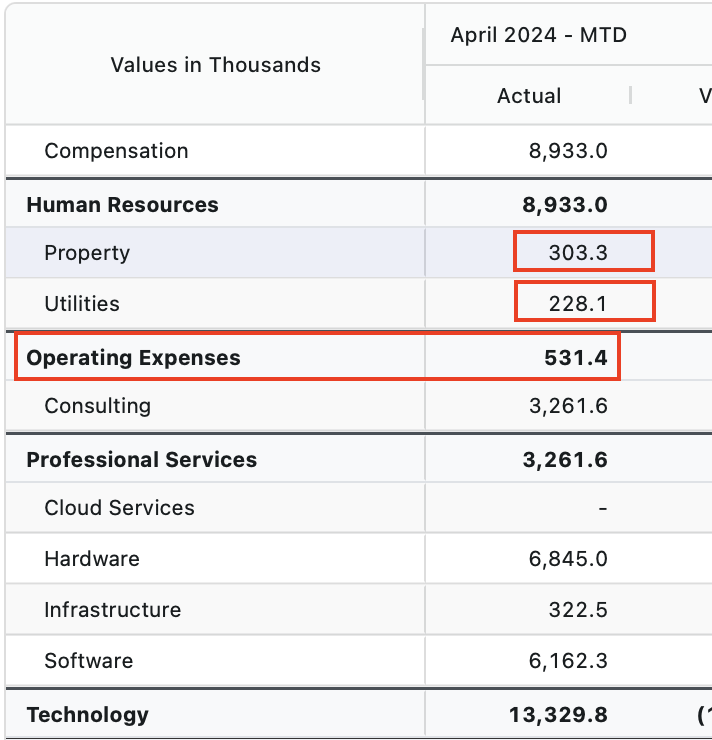
-
Professional Services (Level 2)
= Consulting -
Technology (Level 2)
= Cloud Services + Hardware + Infrastructure + Software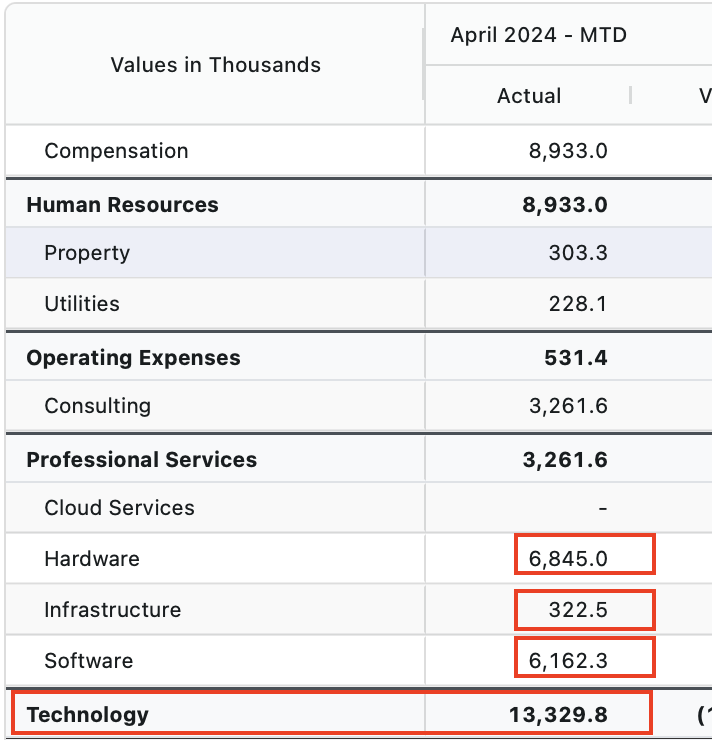
Unclassified data
If account hierarchy is not defined:
-
Data appears under Unclassified
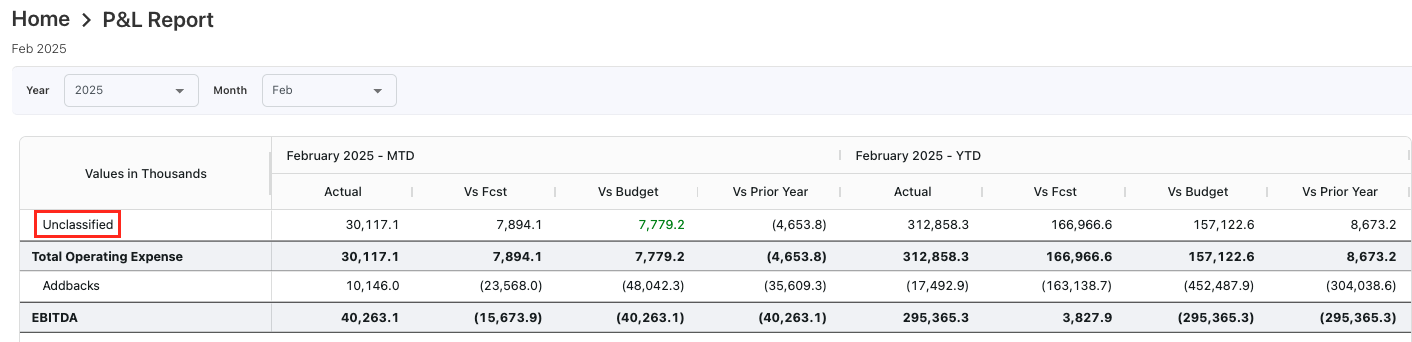
-
No Level 1 or Level 2 grouping is applied
Key financial metrics
Total Operating Expense
Represents the total of all operating expense categories.
EBITDA
EBITDA is calculated using Companion Metrics configuration.
Formula:
-
EBITDA = Total Operating Expense ± Addbacks
EBITDA values are fully user-defined and must be configured in Companion Metrics. Ensure that both Actual and Planned values are maintained for all months in the financial year to enable accurate reporting and variance analysis.
The exact calculation depends on how EBITDA is defined in Companion Metrics.
How to configure EBITDA in Companion Metrics
EBITDA is configured as a Companion Metric for the P&L Report.
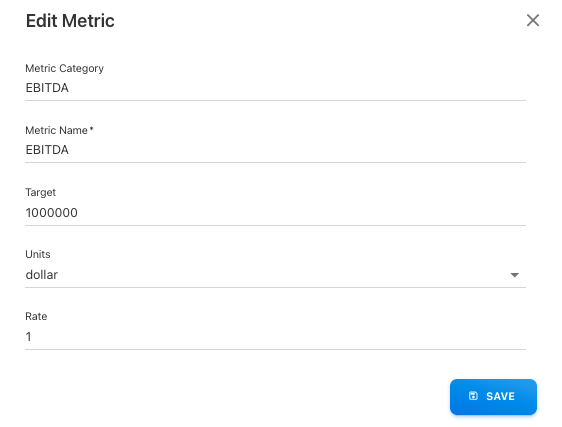
Step 1: create the EBITDA metric
-
Navigate to Settings → Companion Metrics.
-
Click Add New Metric.
-
Enter the following details:
-
Metric Category: EBITDA
-
Metric Name: EBITDA
-
Target: Define the target value (user-defined)
-
Units: Select the unit (e.g., dollar)
-
Rate: Define the rate (user-defined)
-
-
Click Save.
This creates the EBITDA metric structure.
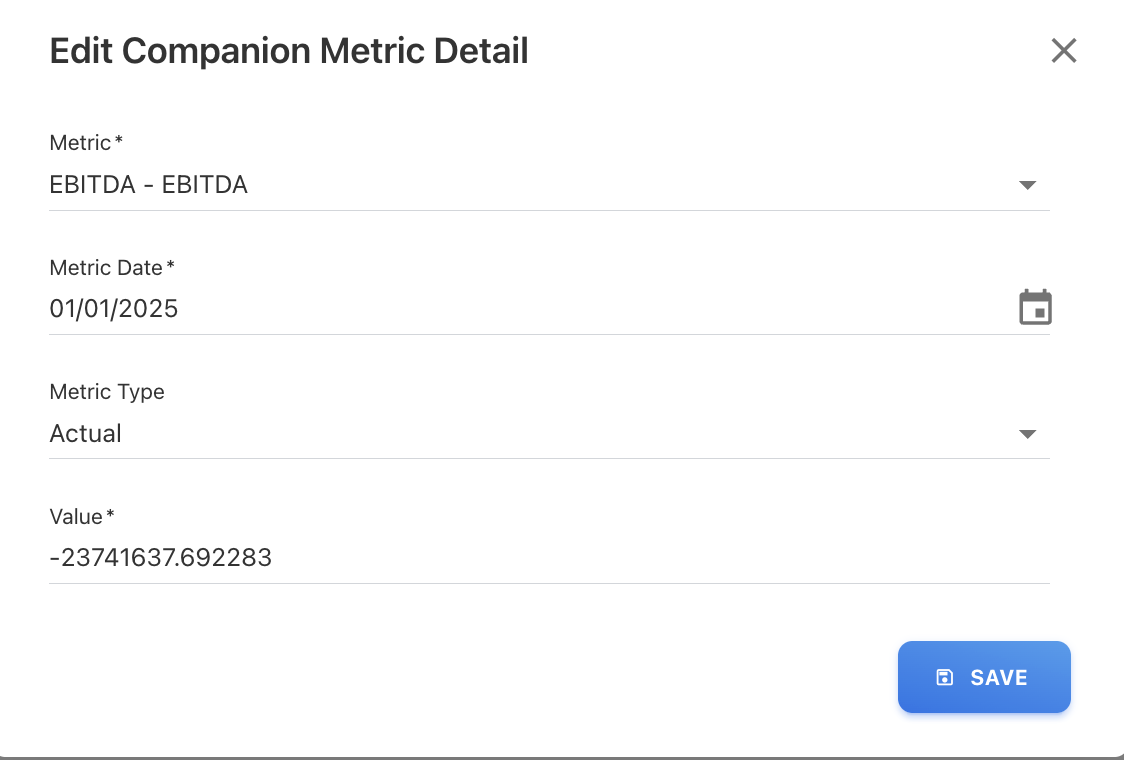
Step 2: add EBITDA values
-
Open the created EBITDA metric.
-
Add values for each month in the financial year.
-
For each entry, provide:
-
Metric Date: Select the month
-
Metric Type:
-
Actual
-
Planned
-
-
Value: Enter the EBITDA value (user-defined)
-
-
Click Save for each entry.
Once configured, EBITDA will be reflected automatically in P&L report and used in calculating Addbacks.
Important considerations
-
Ensure values are entered for all months in the financial year.
-
Both Actual and Planned values should be maintained for accurate reporting.
-
These values are used in:
-
P&L Report calculations
-
Variance analysis (Actual vs Forecast/Budget)
-
Addbacks
Addbacks represent adjustments applied to operating expenses.
These typically include:
-
Non-operational costs
-
One-time or exceptional expenses
Addbacks are calculated using formula:
-
Addbacks = Total Operating Expense − EBITDA
Where, EBITDA is defined in the Companion Metrics.
Addbacks are not directly configured. They are system-derived values, calculated as the difference between Total Operating Expense and EBITDA.
How to use the report
-
Select the Year and Month
-
Review MTD and YTD performance
-
Compare:
-
Actual vs Forecast
-
Actual vs Budget
-
Actual vs Prior Year
-
-
Analyze:
-
Level 2 categories for high-level trends
-
Level 1 accounts for root cause analysis
-
-
Identify:
-
Cost drivers
-
Variance patterns
-
Over/under performance
-