
Use this article to structure better Ask Yarken questions and interpret responses with more confidence.
What makes a good question
A strong Ask Yarken question usually includes:
-
The topic, such as spend, budget, forecast, cloud, vendor, contract, application, cost center, or entity.
-
The time period, such as month, quarter, year, year-to-date, or a comparison period.
-
The fields, such as vendor, account, provider, application, cost center, tower, solution, consumer, or entity.
-
The outcome needed, such as explain, compare, summarize, chart, recommend, or drill down.
Example:
Compare actual cloud spend against budget for the current quarter by provider and identify the top variance drivers.
Common request types
Summarize
Use summarize when you need a high-level view.
Examples:
-
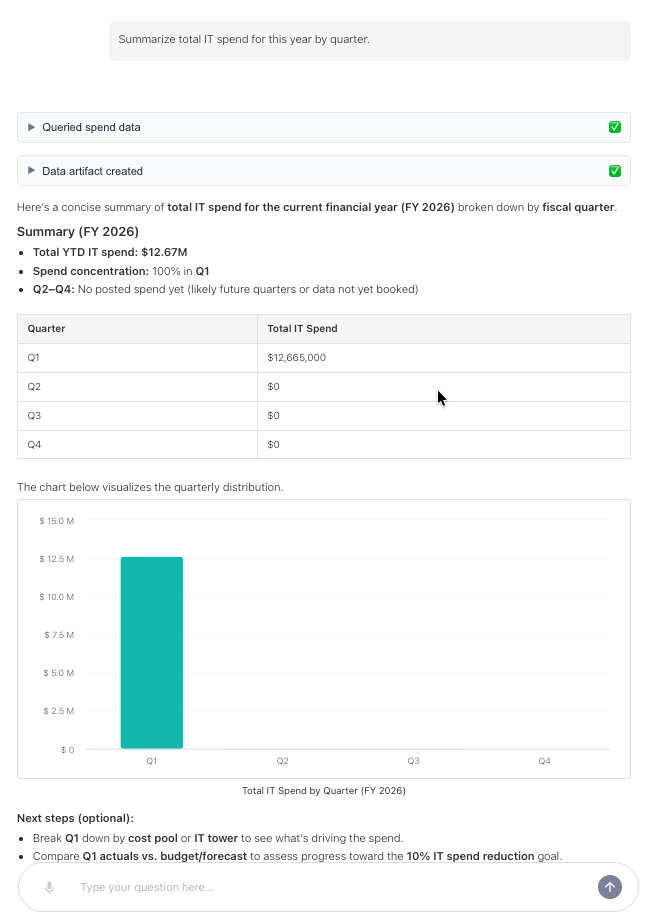
Summarize total IT spend for this year by quarter.
-
Summarize cloud spend by provider for the last 6 months.
-
Summarize vendor spend by cost center.
Explain
Use explain when you need the reason behind a change.
Examples:
-
Explain why infrastructure spend increased this month.
-
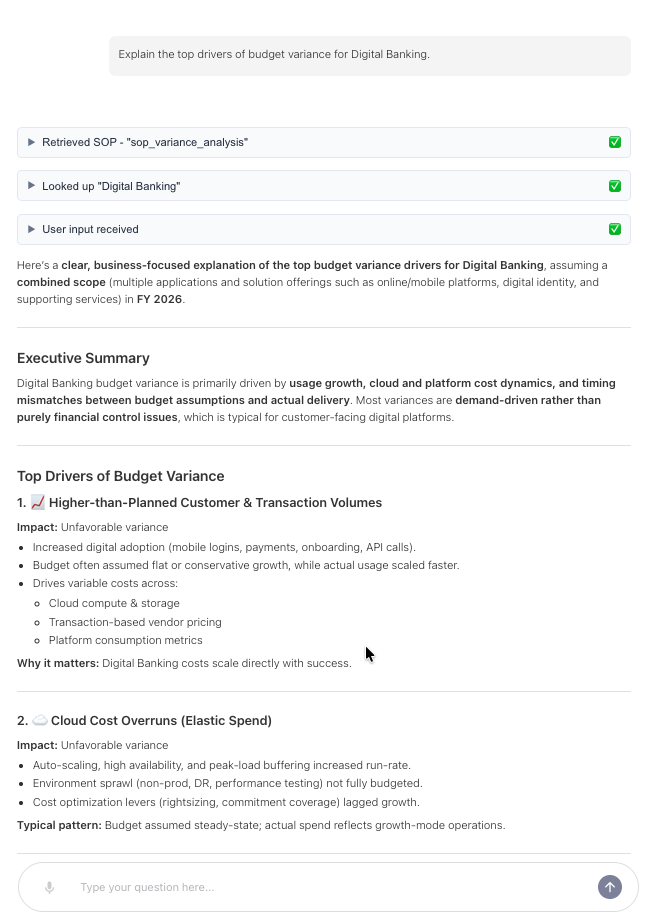
Explain the top drivers of budget variance for Digital Banking.
-
Explain why forecasted spend differs from actual spend in Q2.
Compare
Use compare when you need differences across periods, plans, or dimensions.
Examples:
-
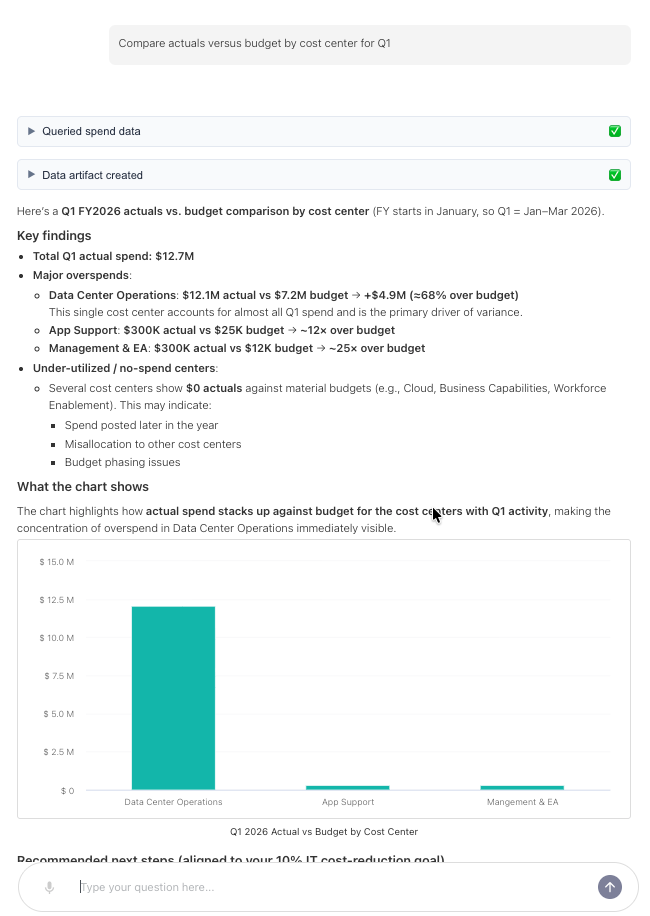
Compare actuals versus budget by cost center for Q1.
-
Compare AWS and Azure spend by service category.
-
Compare vendor spend this year versus last year.
Drill down
Use drill down when you need more detail behind a result.
Examples:
-
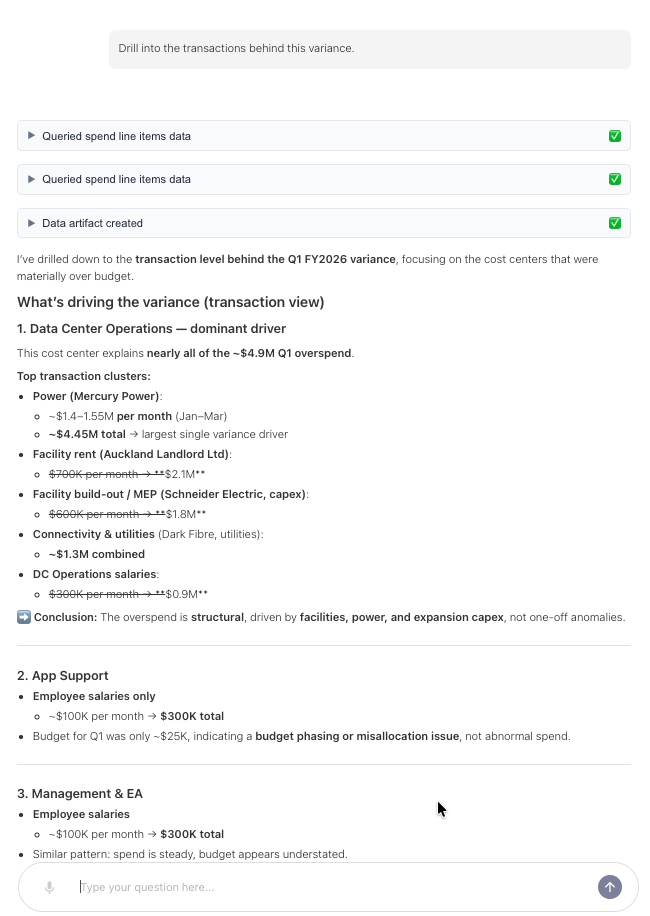
Drill into the transactions behind this variance.
-
Show granular-level detail for the top 5 spend increases.
-
Break this result down by account and consumer.
Recommend
Use recommend when you need a practical action path.
Examples:
-
Recommend actions to reduce cloud overspend this quarter.
-
Identify vendors that should be reviewed for renegotiation.
-
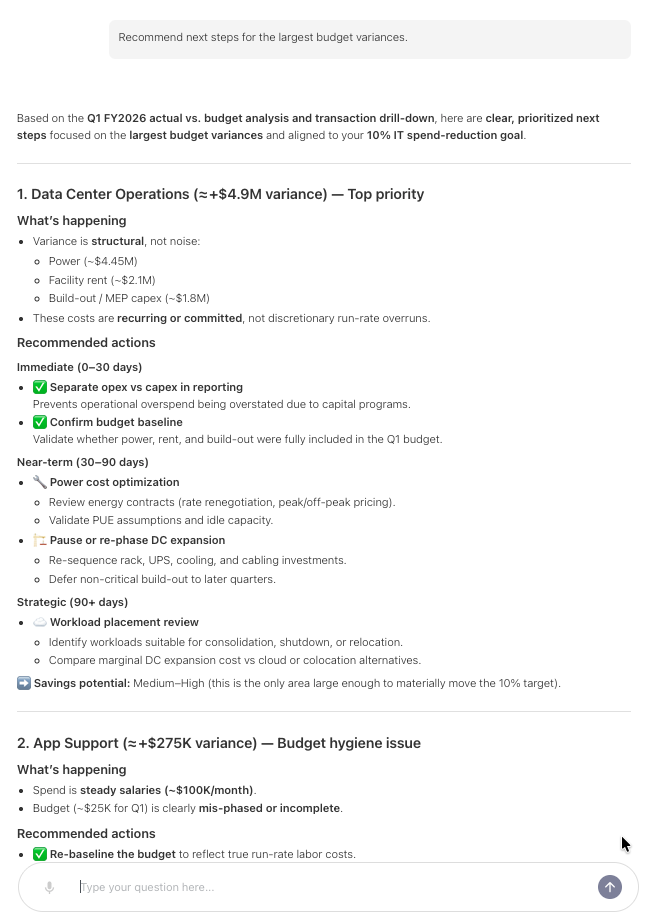
Recommend next steps for the largest budget variances.
Visualize
Use visualize when you need a chart.
Examples:
-
Create a line chart of monthly cloud spend by provider.
-
Show a column chart of top applications by spend.
-
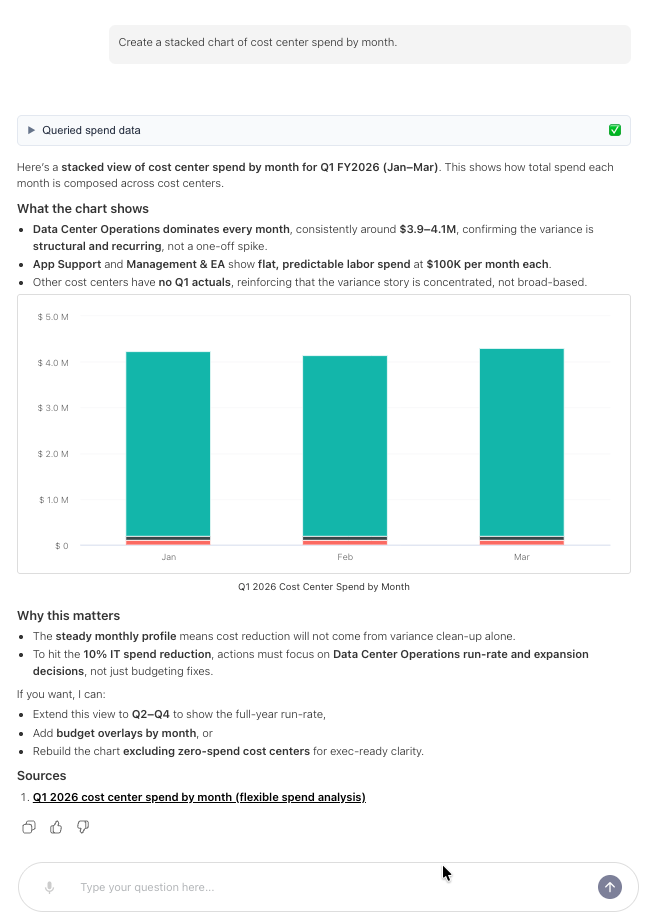
Create a stacked chart of cost center spend by month.
How Ask Yarken handles unclear names
Your data may contain similar names across vendors, applications, accounts, cost centers, and consumers.
Ask Yarken uses search lookup to match names in your question to the right data values.
If more than one match exists, Ask Yarken follows the ambiguity behavior set by your administrator:
-
Agent chooses best match.
-
Prefer asking the user to clarify.
If Ask Yarken asks for clarification, select or restate the intended meaning before continuing.
How to ask follow-up questions
Ask Yarken keeps context within a thread.
You can ask follow-up questions such as:
-
Break that down by cost center.
-
Show the same view for last quarter.
-
Which vendors caused the increase?
Follow-up questions work best when they clearly refer to the prior result in the same conversation.
Tips for better results
-
Include the time period you care about.
-
Name the dimension you want to analyze.
-
Say whether you want a summary, explanation, comparison, recommendation, or chart.
-
Start a new chat when you change topics.
-
Ask follow-up questions in the same thread when you want deeper detail on the same topic.
Next step
Use Ask Yarken for spend, variance, cloud, contracts, and planning analysis
Related articles
Use Ask Yarken for spend, variance, cloud, contracts, and planning analysis