
See how spend moves through the model
Cost Explorer provides a visual representation of spend propagation through the hierarchical layers of the Yarken cost model. It enables the tracing of financial data from foundational structures into granular technology and business perspectives, including Cost Pools, Resource Towers, Solutions, and Consumers.
This utility is essential for auditing allocation outcomes, validating model integrity, and identifying spend that remains unmapped within the current configuration.
What you can do
-
Audit Allocation Flow: Review the distribution of total spend across discrete model layers.
-
Trace Node Connectivity: Inspect the movement of cost between specific nodes to verify mapping logic.
-
Identify Allocation Gaps: Isolate unallocated or partially allocated spend for remediation.
-
Configure Period and Context: Filter the visualization by specific timeframes and model contexts.
-
Analyze Node Metadata: Drill into individual nodes to review mapped percentages, source and destination attributes, and total amounts.
-
Execute Manual Refreshes: Batch multiple filter updates to optimize performance when working with high-density datasets.
How Cost Explorer fits the Yarken model
Yarken leverages a TBM-aligned framework to synthesize financial, operational, and consumption data into actionable business insights. The model typically comprises four interconnected layers:
-
Technology Cost Pools: The financial foundation representing spend sources.
-
Technology Resource Towers: The intermediate technology lens for resource categorization.
-
Technology Solutions and Consumers: The final layers connecting spend to specific products, services, and business units.
Cost Explorer serves as a diagnostic interface to explain how dashboard outcomes are derived by visualizing these underlying connections.
How the view works
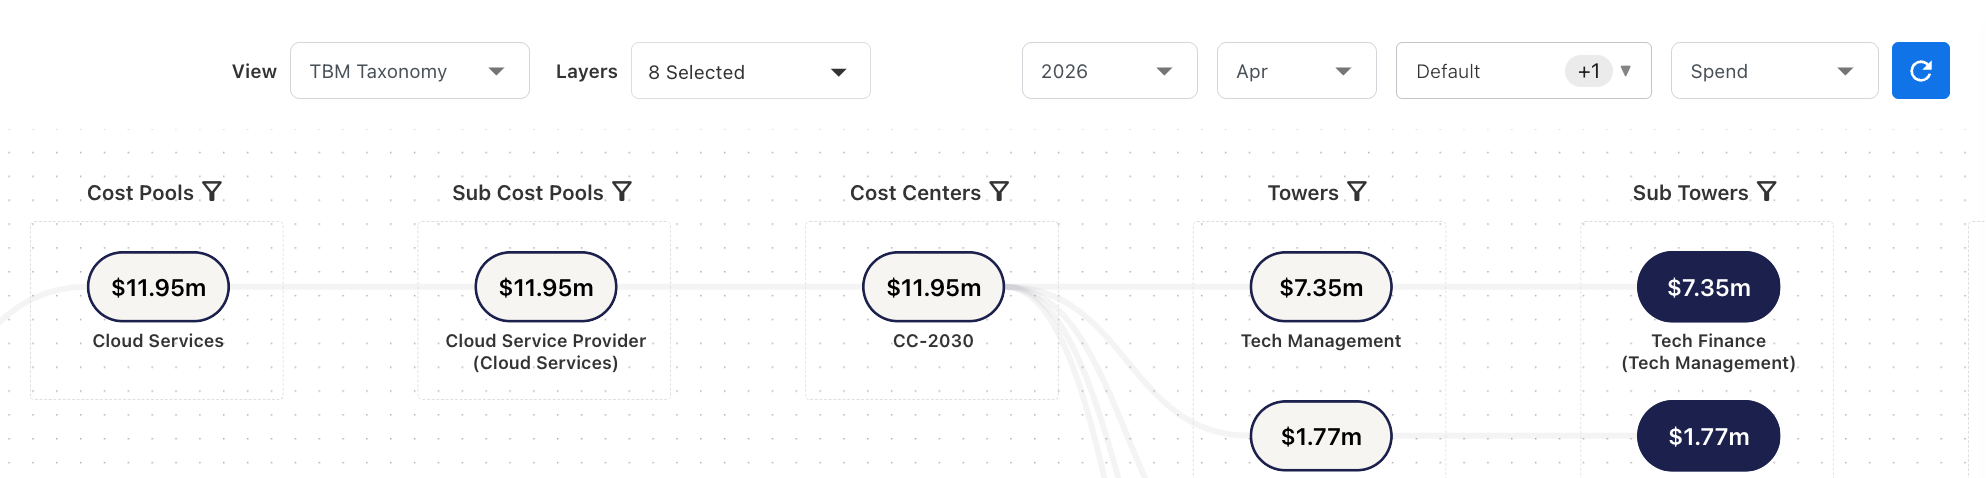
The interface utilizes a node-link diagram where each node represents a cost element and connections represent the flow of spend between layers.
-
Navigation: Use click-and-drag to pan across the explorer and zoom controls to inspect dense clusters within the model.
-
Node Details: Selecting a node opens a detail panel containing the specific allocation results and mapping attributes for that element.
-
Filtering and Refresh: Use the year, month, and model filters to define the validation scope. To ensure optimal responsiveness, the explorer uses a manual refresh mechanism. The visualization does not update automatically when you select a filter; click the Refresh button to apply the changes and reload the data.
When to use Cost Explorer
Use Cost Explorer to:
-
Validate monthly allocation results before reporting.
-
Explain the logic behind spend movement through the model.
-
Investigate the root cause of unallocated costs.
-
Verify that mapping rules are functioning as intended.
-
Prepare for deep-dive analysis in Analytics or planning workflows.
Next step
Review the relevant mapping or allocation guide for the layer you are investigating, such as Cost Pools or Towers.
Related articles