
The Insights page is your central workspace for monitoring, reviewing, and acting on anomalies detected across spend and usage data. Insights are generated automatically based on configured Insight Rules and help you proactively identify risks, unexpected changes, and optimization opportunities—without relying on manual reviews.
Each insight represents a specific event (for example, a spend spike or sudden drop) and follows a defined lifecycle so teams can acknowledge, investigate, and resolve issues in a consistent way.
Insight status
Each Insight moves through defined statuses during its lifecycle.
New
-
A fresh insight is created whenever a rule is triggered.
Acknowledged
-
The insight is marked as acknowledged once a user starts reviewing it.
-
This stage includes investigation, ownership assignment, and data validation.
Resolved
-
The Insight is resolved once the issue is explained or corrected.
Reopened
-
An Insight can be reopened if it reappears or the resolution is incomplete.
-
Reopened Insights return to the New status for further review.
View insights
The Insights list provides a consolidated view of all generated insights.
From the Insights page, you can:
-
View and acknowledge triggered Insight
-
Search insights using keywords
-
Sort by severity, status, or generation time
-
Quickly scan anomaly summaries
-
Identify high-priority issues using severity labels
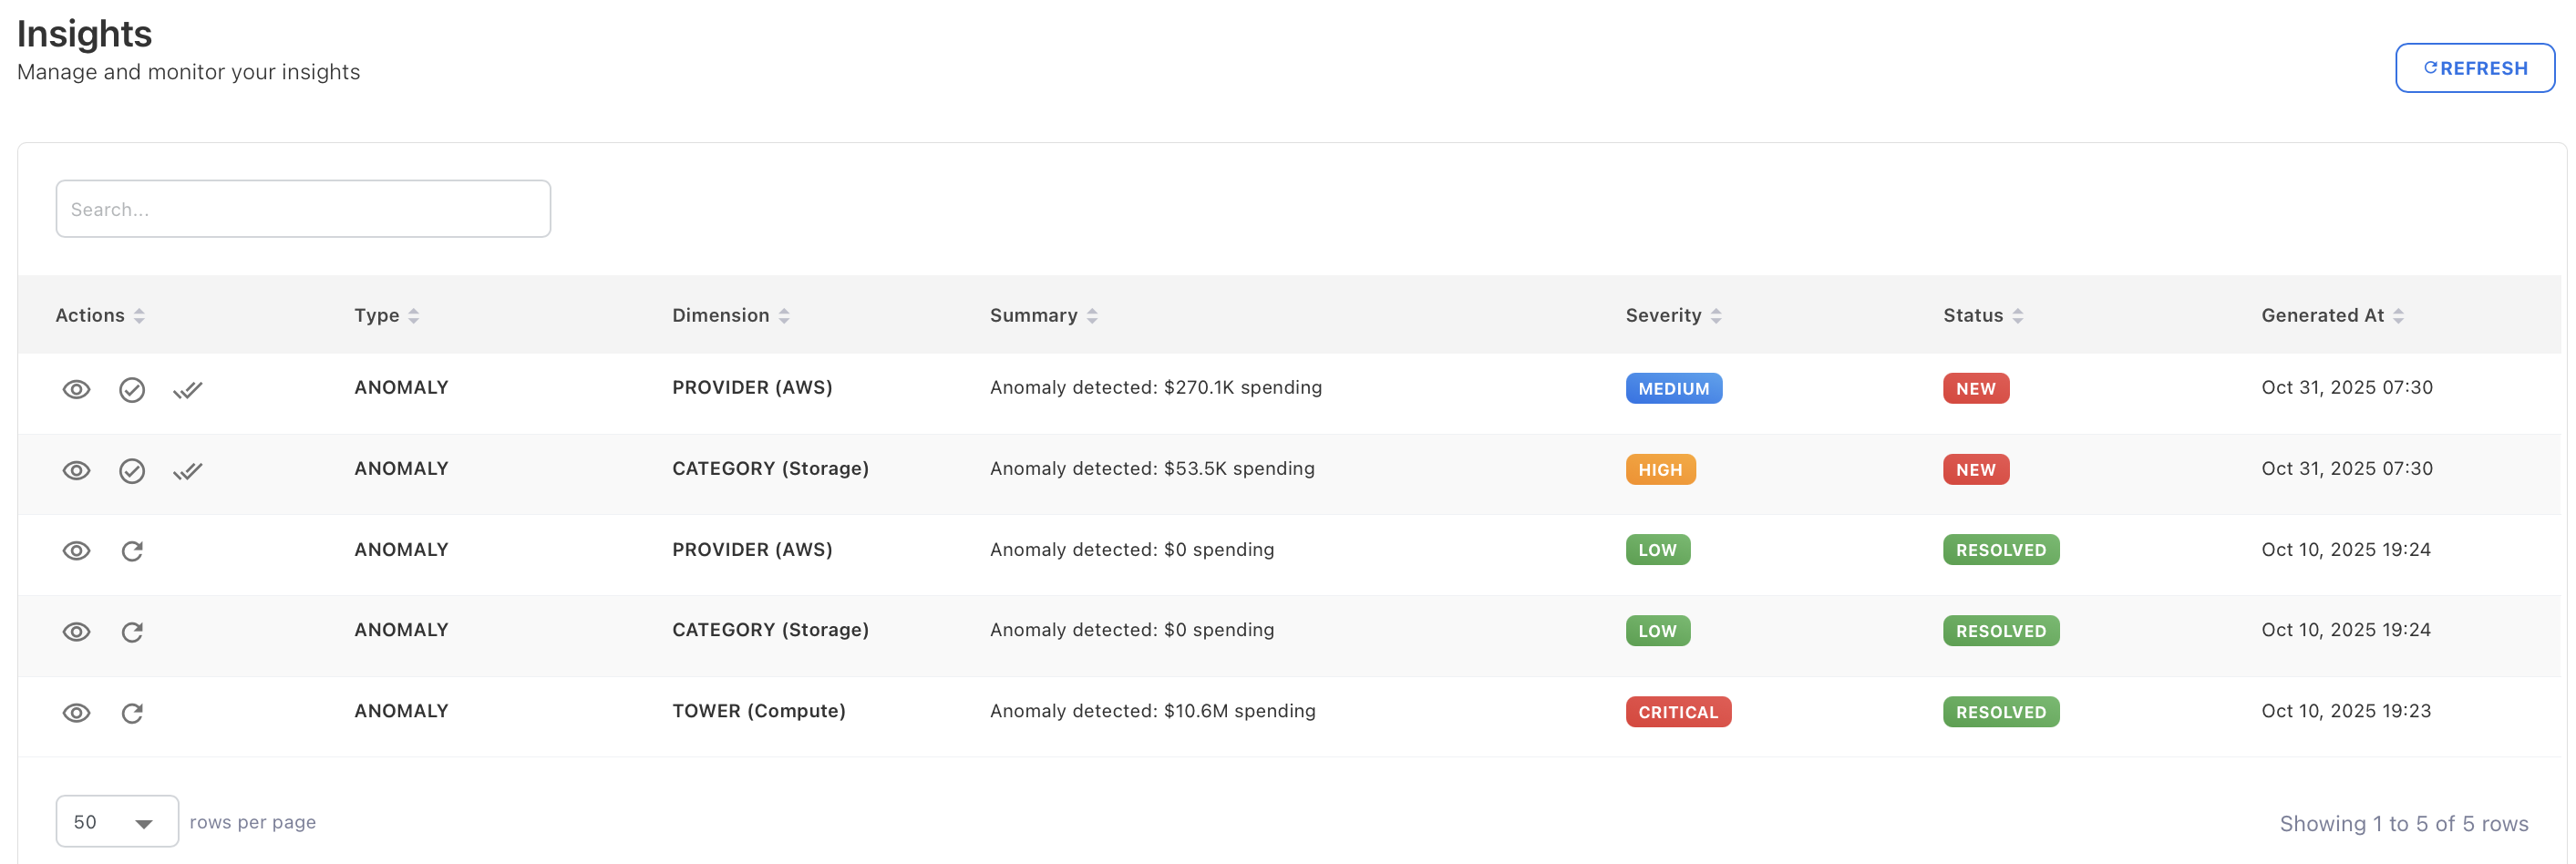
Key columns explained
-
Type – The nature of the insight (for example, Anomaly)
-
Dimension – The data slice where the anomaly occurred (Provider, Category, Tower, etc.)
-
Summary – A brief description of the detected event
-
Severity – Business impact level (Low, Medium, High, Critical)
-
Status – Current lifecycle state
-
Generated At – Timestamp when the insight was triggered.
Insight details
Selecting an Insight opens the Insight Details view. This view explains what was detected, why it was flagged, and what to do next.
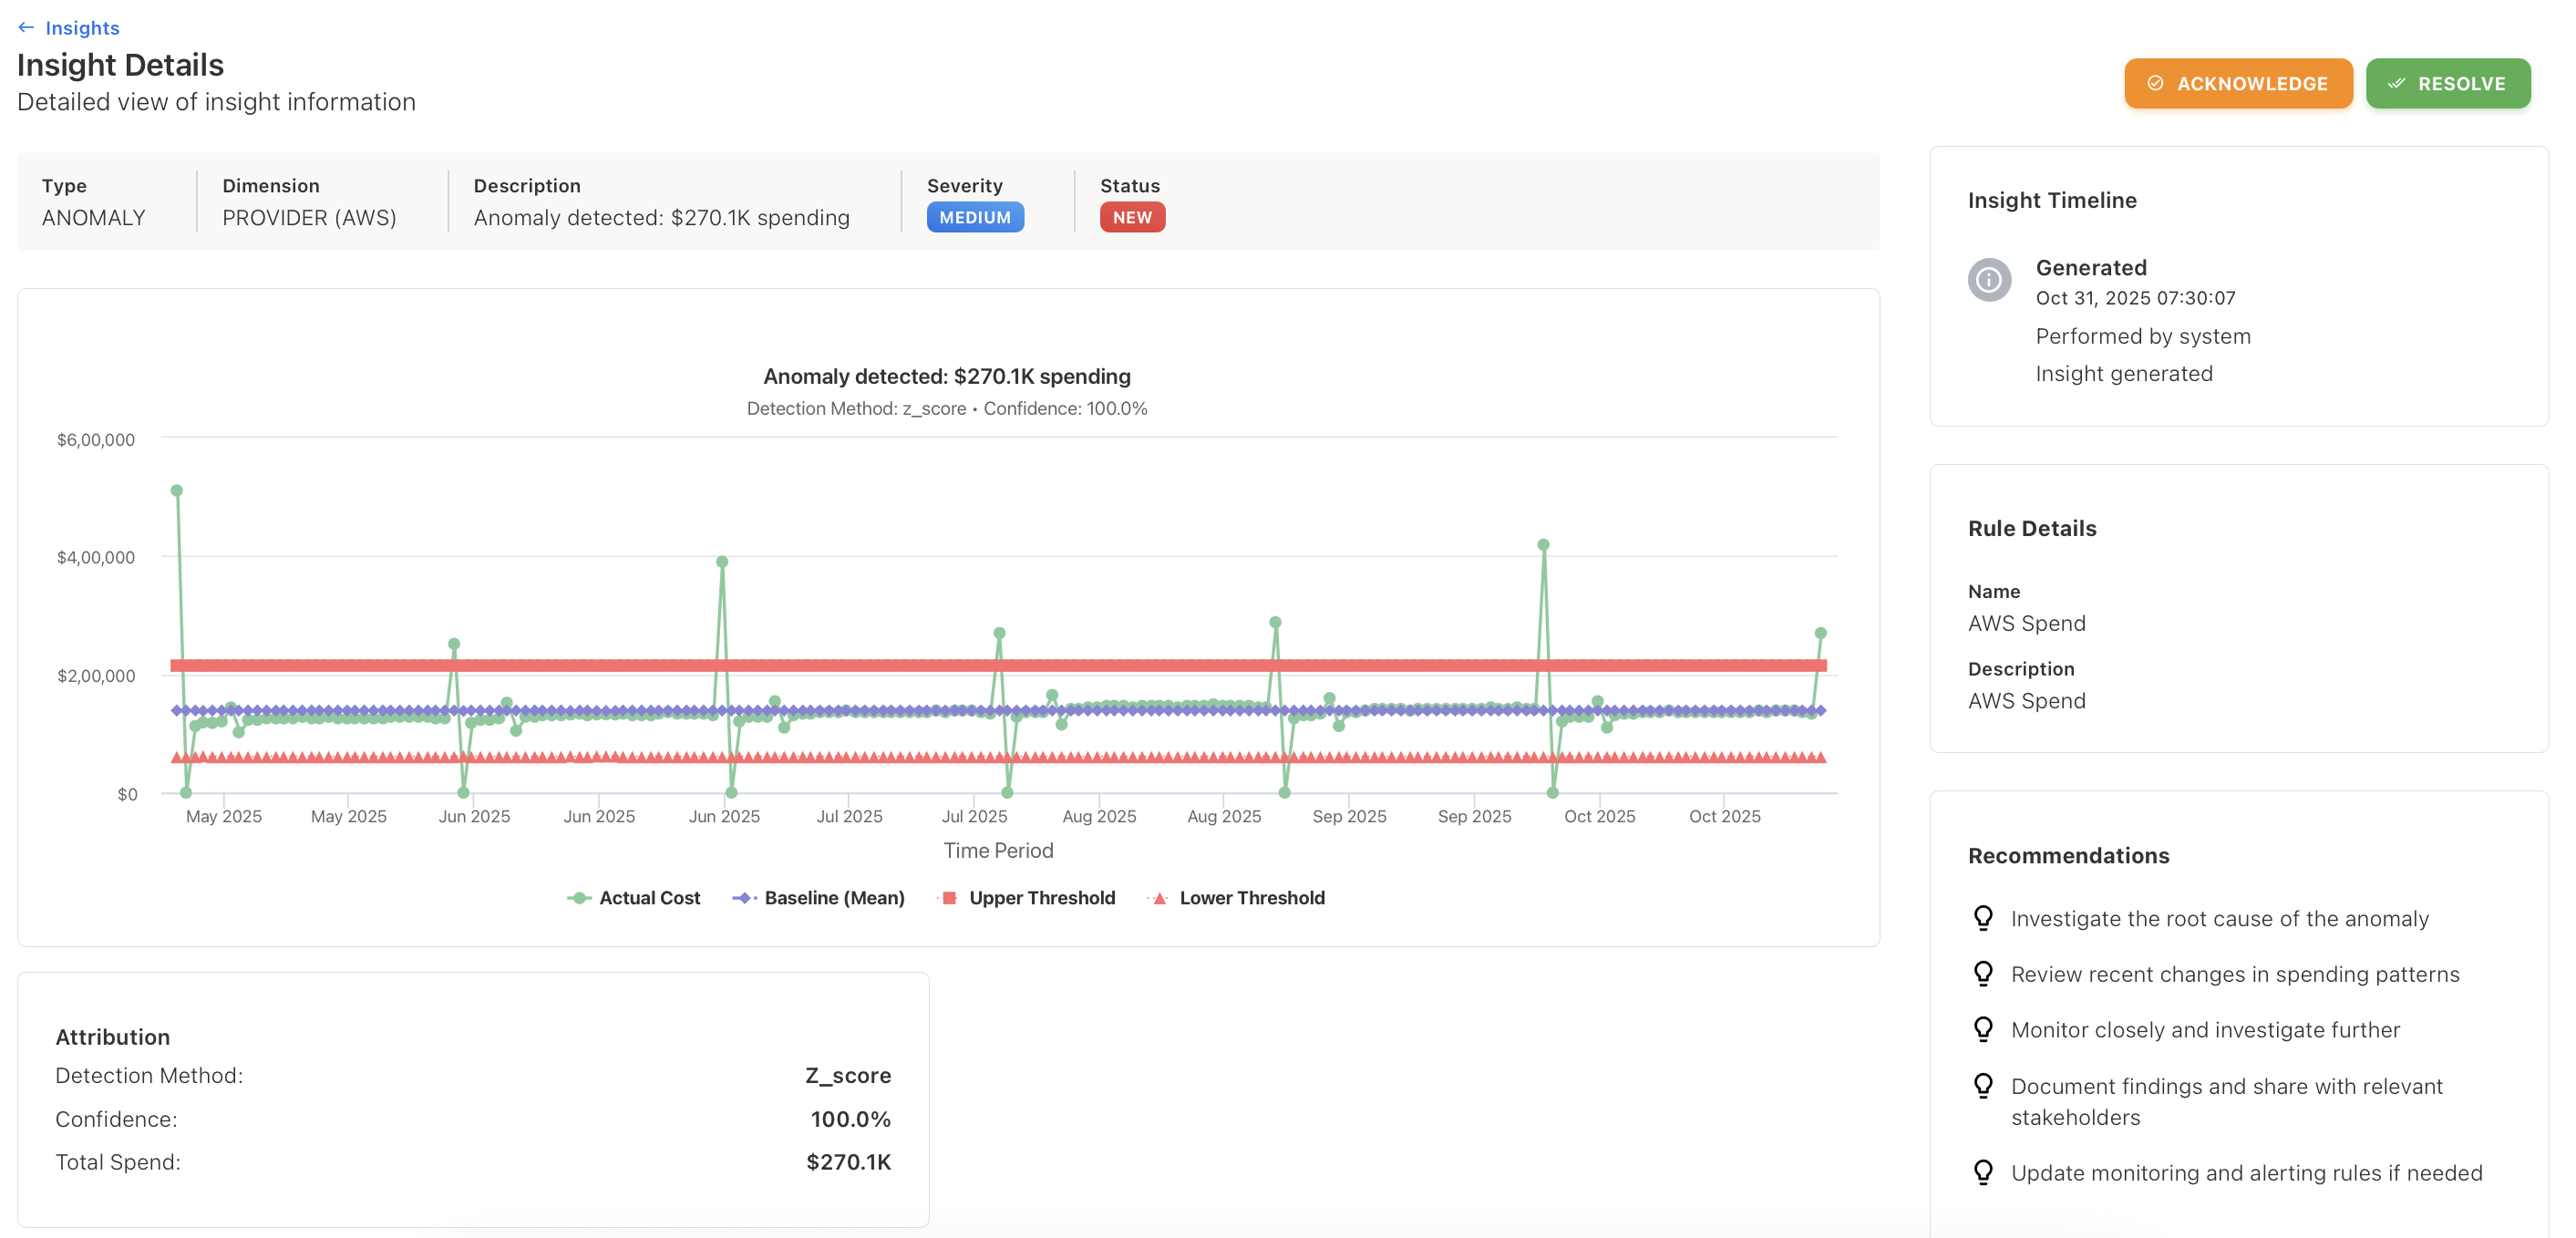
What you see in Insight Details
-
Insight header
Displays the type, dimension, severity, and current status of the Insight. -
Trend visualization
Shows actual values compared against the baseline, with upper and lower thresholds clearly highlighted. -
Attribution
Provides context on how the Insight was generated, including:-
Detection method used
-
Confidence score
-
Impacted spend amount
-
-
Rule details
Shows the rule name and description that triggered the Insight. -
Insight timeline
Tracks key events, including:-
When the Insight was generated
-
System actions and user responses
-
-
Recommendations
Suggests next steps to investigate, validate, or mitigate the issue.
Acting on Insights
Once an insight is generated and appears on the Insights page, you can take structured actions to investigate and resolve the issue.
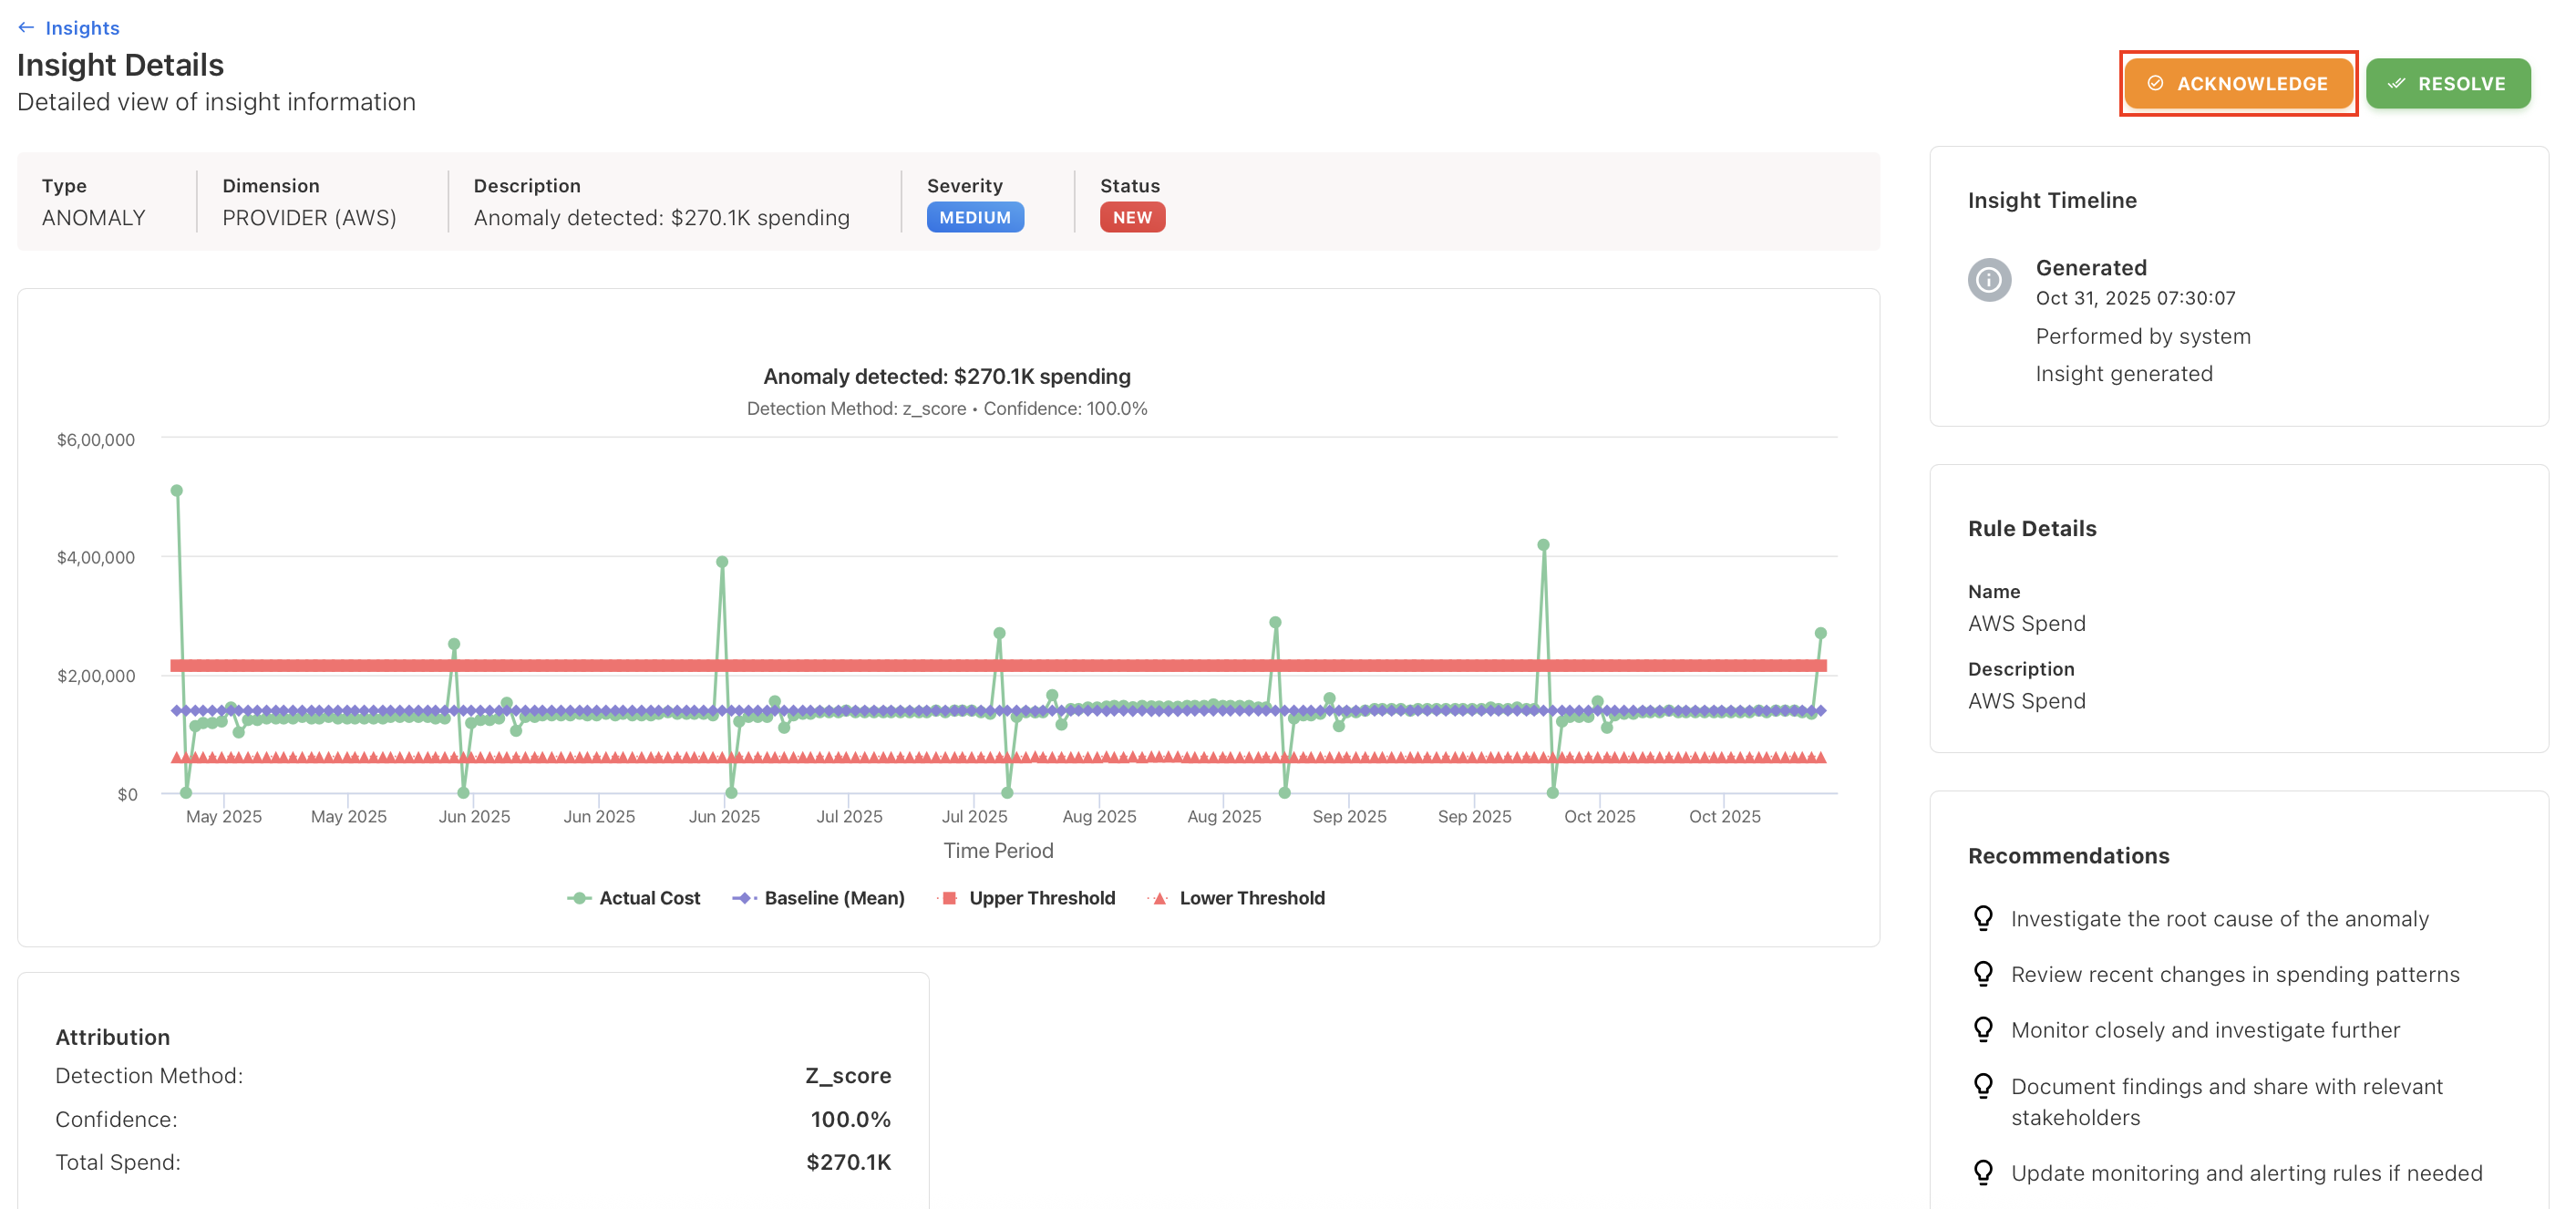
1. Acknowledge the insight
-
Mark the insight as Acknowledged after an initial review.
-
This indicates the insight is being actively investigated.
2. Investigate the root cause
-
Review the trend chart to compare actual values against the baseline and thresholds.
-
Analyze the affected dimensions to identify what triggered the anomaly or threshold breach.
3. Take corrective action
-
Optimize usage or control spend based on the findings.
-
Coordinate with relevant teams if operational or contractual changes are required.
4. Refine the rule (if needed)
If the Insight is a false positive or too sensitive:
-
Adjust threshold values.
-
Add or remove dimensions to improve targeting.
-
Modify the execution frequency or cooldown days to reduce noise.
5. Resolve the Insight
-
Mark the Insight as Resolve once investigation and corrective actions are complete.
-
Resolved Insights remain available for audit and future reference.
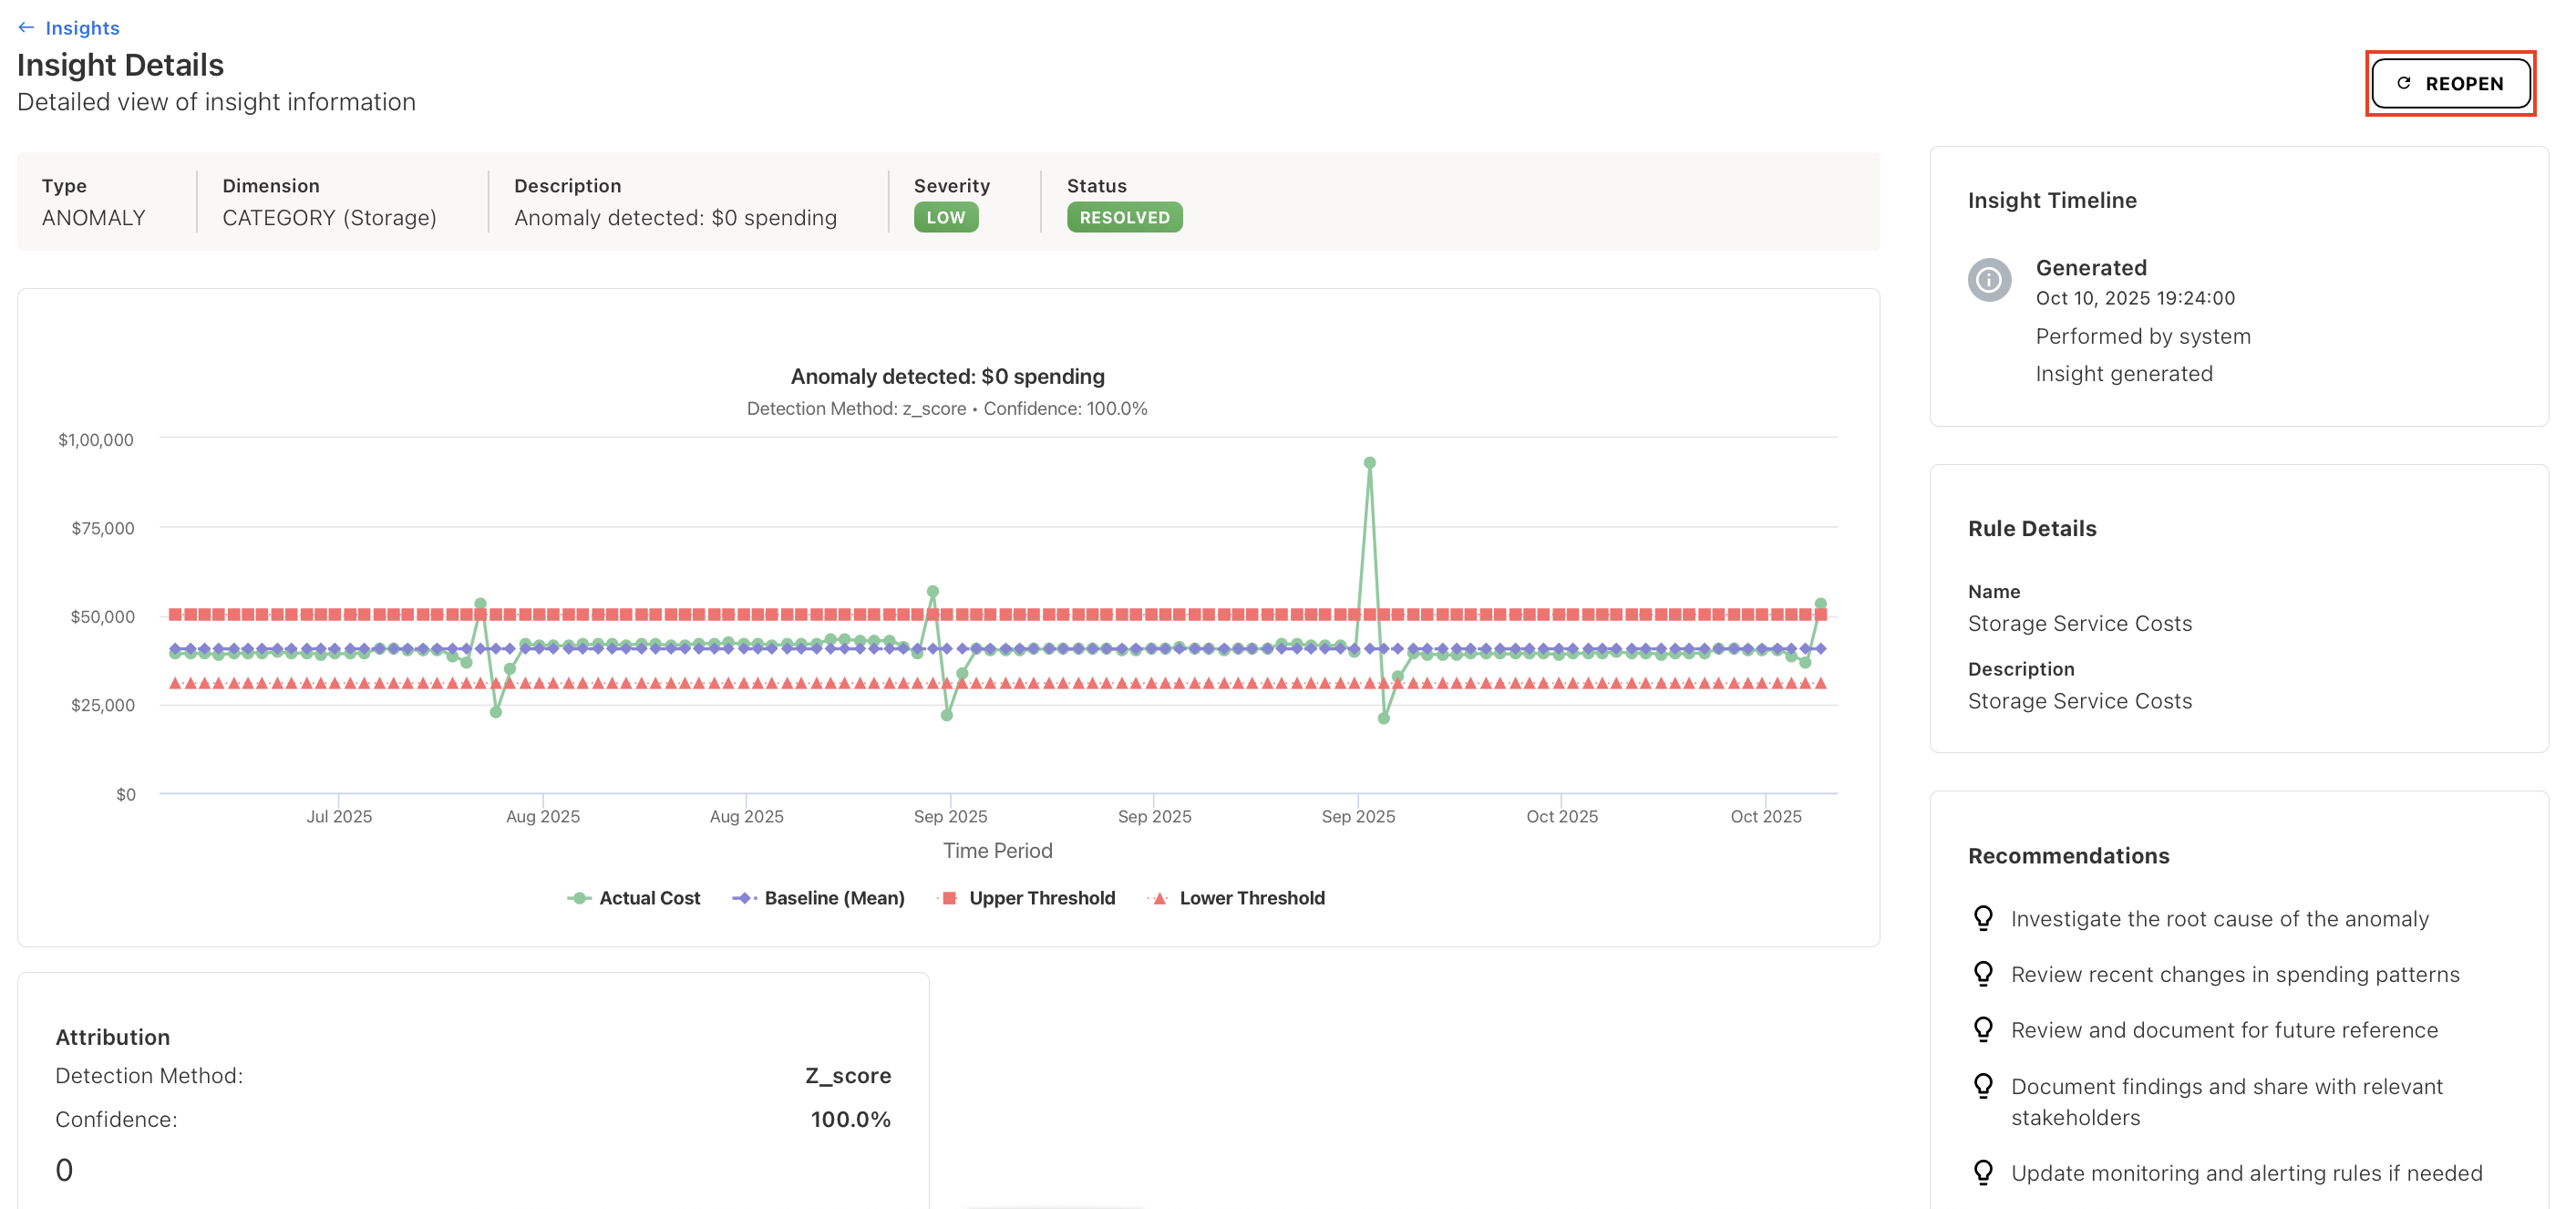
6. Reopen the Insight (optional)
-
Reopen the Insight if the issue reoccurs or requires further analysis.
-
Reopening returns the Insight to the active workflow for review and resolution.
Related content