
Prerequisites
Before creating Insight Rules, ensure the following conditions are met:
Data availability
-
Historical spend or usage data is uploaded or ingested into the platform.
-
Data is continuous and consistent, with no significant gaps or missing periods.
-
The available data range aligns with the requirements of the Z-score detection method.
Data accuracy
-
Uploaded files (such as spend, usage, or cloud consumption) are validated and mapped correctly.
-
Currency conversions, account mappings, and master data configurations are set up properly.
-
Data values accurately reflect actual spend or usage to ensure meaningful anomaly detection.
Sufficient historical range
-
Sufficient historical data exists to establish a reliable baseline.
-
Historical data should represent normal spending or usage patterns so that unusual behavior can be identified accurately.
Configured dimensions
-
Required dimensions (such as services, applications, business units, or accounts) are properly configured.
-
At least one data cube (Spend Cube or Cloud Cube) is active and available for monitoring.
Rule setup
-
You have identified the metric to monitor (such as spend, budget, or variance).
-
You understand the anomaly category and detection method appropriate for your data behavior.
-
Notification groups are configured with recipients (Email, Microsoft Teams, or Slack). For more information on how to configure Notification Channel Groups, refer Set up notification channel group.
Checklist for creating Insight Rules
Use this checklist to ensure your Insight rules are accurate, actionable, and generate meaningful signals instead of noise.
-
Assess data behavior
-
Identify the volatility level of the data.
-
Confirm whether recurring or seasonal patterns are present.
-
Determine if baseline shifts or structural changes are expected.
-
-
Define a clear scope
-
Apply dimensions to focus on critical services, accounts, or units.
-
Use multi-value selection within dimensions to cover related values (for example, multiple providers or regions) in a single rule instead of creating duplicates.
-
Avoid overly broad rules that generate excessive alerts.
-
-
Set meaningful thresholds
-
Align thresholds with real business impact.
-
Avoid overly sensitive settings that lead to false positives.
-
-
Configure notifications thoughtfully
-
Ensure alerts reach the right teams and owners.
-
Use severity levels to support prioritization and response.
-
-
Test and refine
-
Validate rules against known historical events.
-
Adjust scope, or thresholds as data patterns evolve.
-
Create an Insight rule
Procedure
Follow these steps to create a rule for detecting anomalies in your cost or usage data:
-
Navigate to Admin > Insights Rules.
-
Click + CREATE RULE.
-
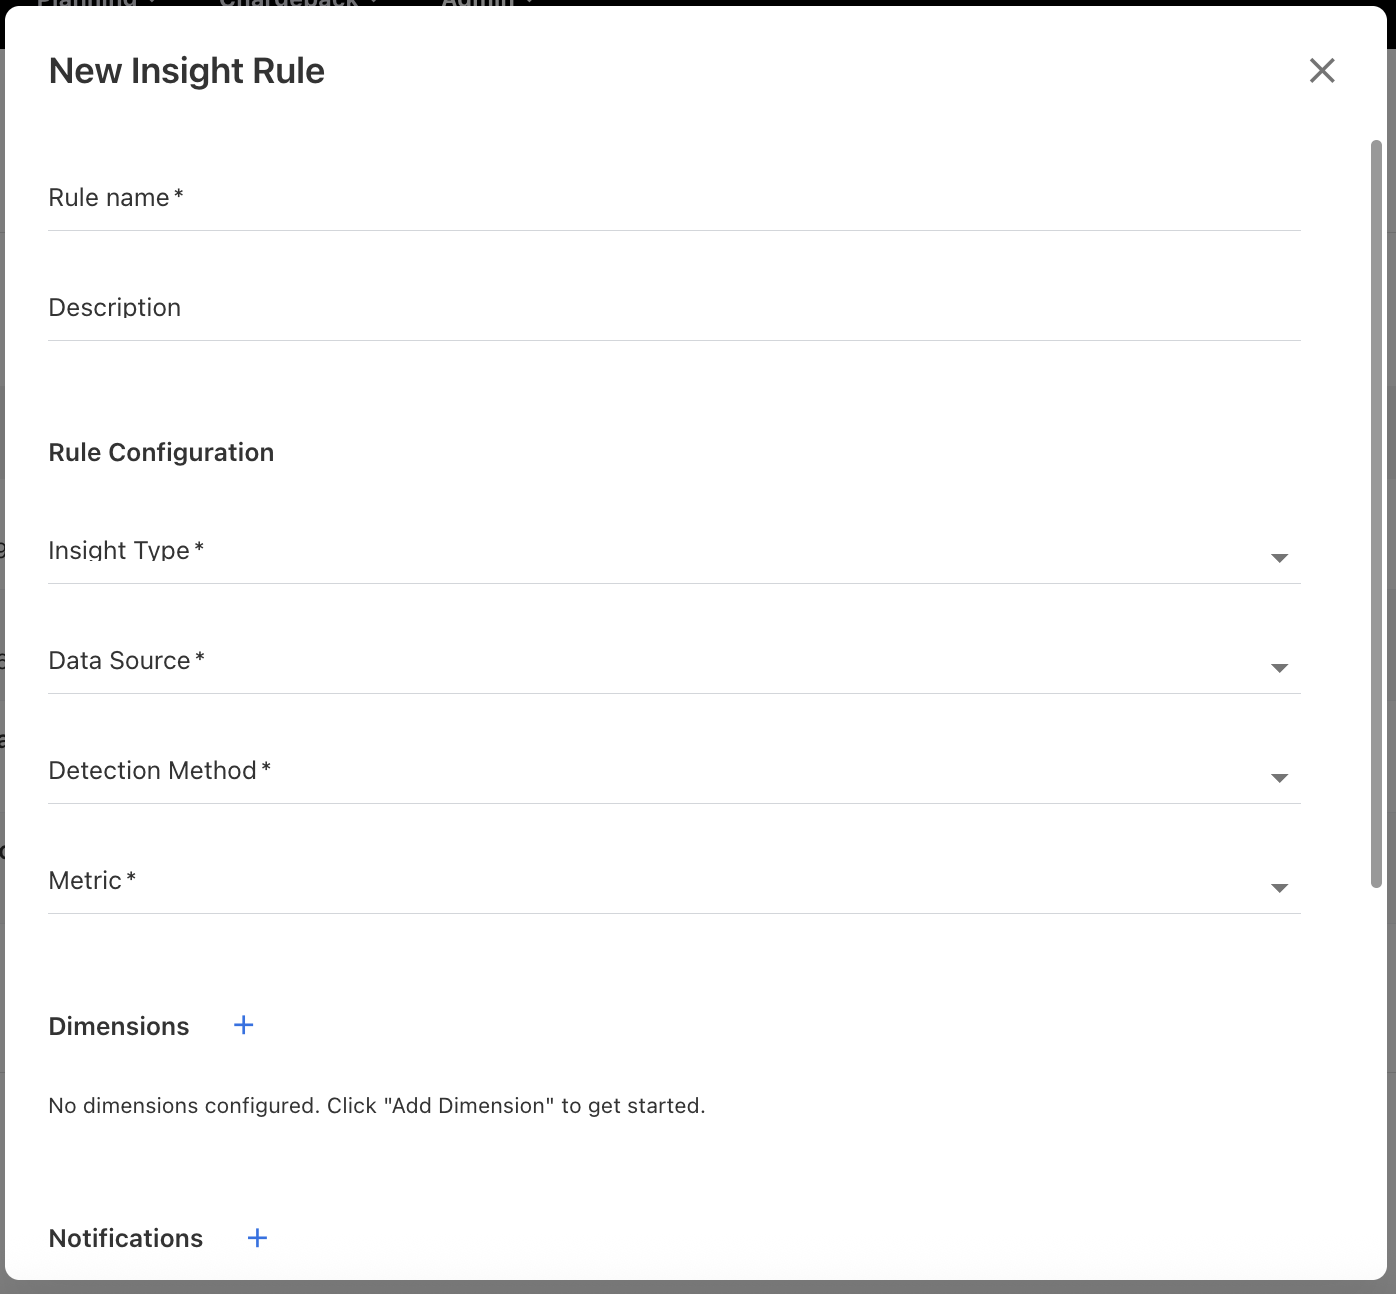
On New Insight Rule popup, fill in the rule details.
-
Rule name: Provide a clear, descriptive name for your rule.
-
Description: Add a summary of what this rule is intended to detect.
-
-
In the Rule Configuration, select:
-
Insight Type: Select the type of insight, for example, Anomaly - Detect unusual patterns.
-
Data Source: Choose the cube where anomalies should be detected.
-
Spend Cube View: Use this when you want to analyze anomalies in overall IT spend, cost allocation, budgets, and chargeback-related metrics. The spend cube's available frequency is monthly.
-
Cloud Cube View: Use this when you want to analyze anomalies in cloud usage and billing data, such as service-level costs, usage metrics, or commitment discounts. The cloud cube’s available frequencies are hourly, daily, weekly, and monthly.
-
-
Detection Method: Pick the detection method suited for your use case.
-
Metric: Select the metric to be monitored for the insights, for example, Spend, Budget, or Variance.
-
-
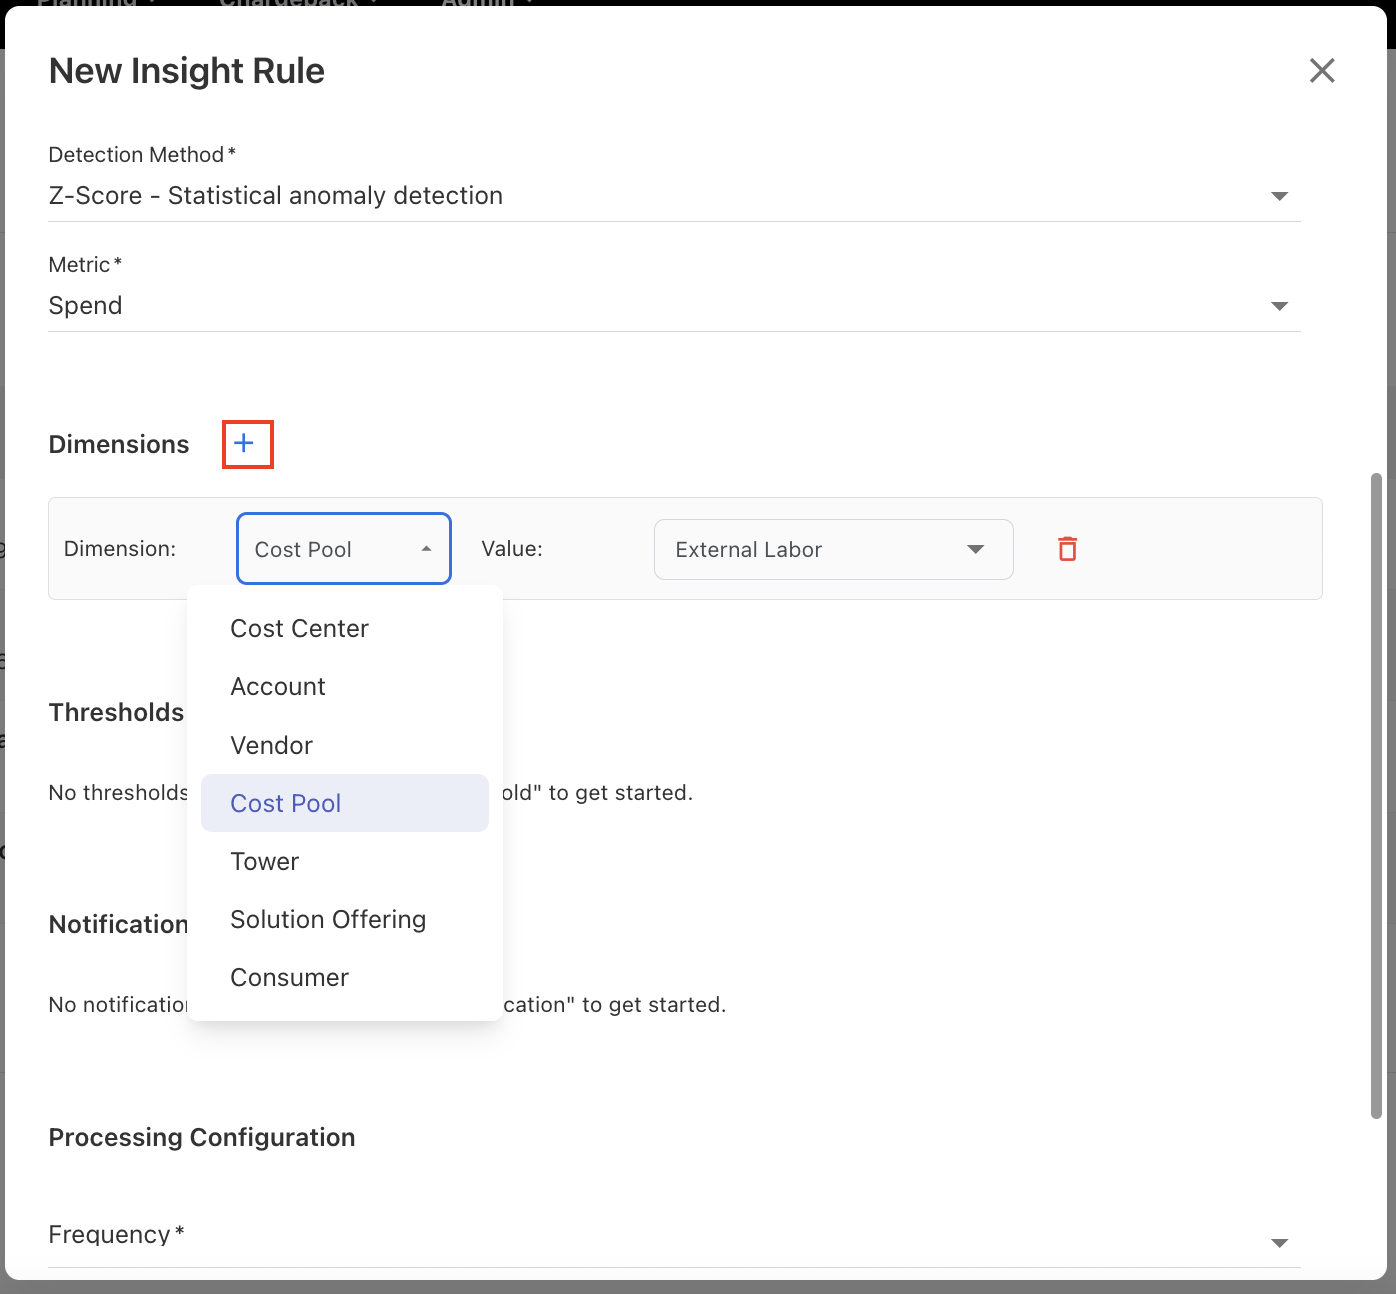
In Dimensions,
-
Click + to add a dimension to scope the rule to specific attributes from the cube. For spend cube, the dimensions could be Account, Cost Center, Vendor, Tower, and so on. For the cloud cube, they can be Provider, Region, Service, and so on.
-
Select a dimension value. It is the actual dimension value within that cube. The rule will only monitor anomalies or thresholds for this value.
-
How dimension selection works:
-
Within a dimension
-
selected values are evaluated using OR logic — the rule monitors any of the selected values.
-
-
Across dimensions
-
selections are combined using AND logic — the rule monitors data that matches at least one value from each configured dimension.
-
Example:
Selecting Provider = AWS, Azure and Category = Compute, Storage results in the rule evaluating:
(AWS OR Azure) AND (Compute OR Storage)
This covers all four combinations (AWS–Compute, AWS–Storage, Azure–Compute, Azure–Storage) within a single rule.
Tip: Use multi-value selection to reduce rule duplication. Instead of creating separate rules for each value combination, configure one rule with multiple values per dimension to cover a broader monitoring scope.
-
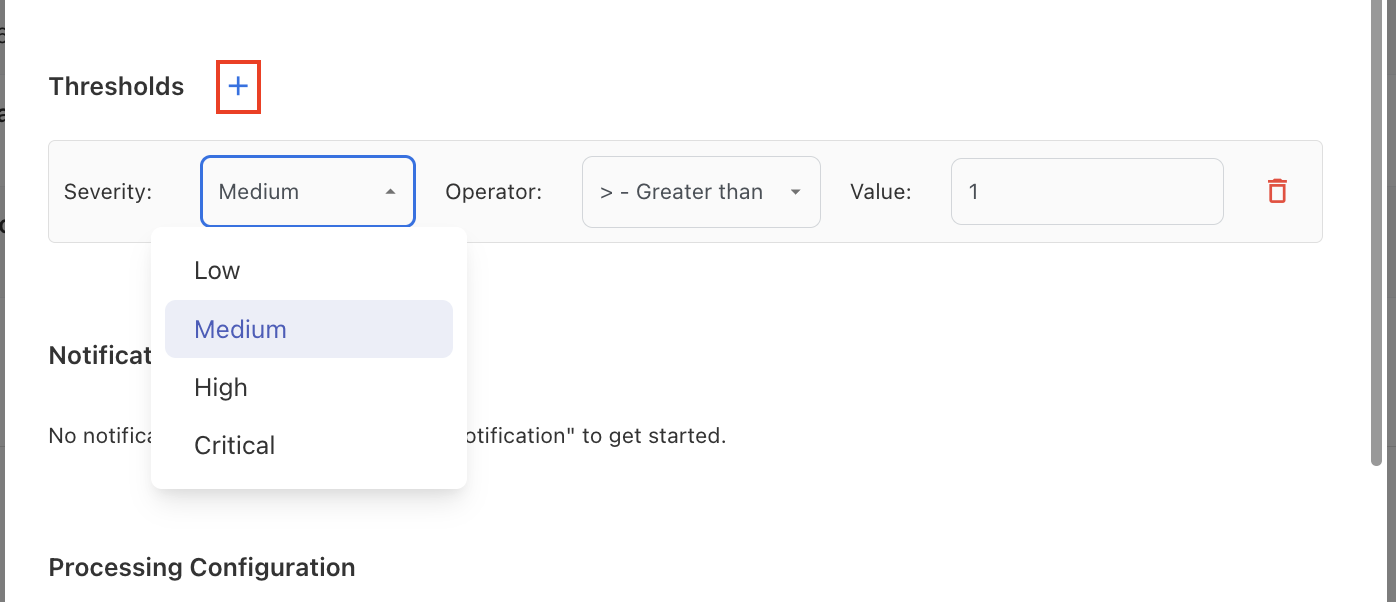
In Thresholds,
-
Click + to define thresholds to control when alerts should be triggered. Each threshold requires:
-
Severity – Choose the impact level (Critical, High, Medium, or Low).
-
Operator – Select the condition, for example, greater than, less than, equal to.
-
Value – Enter the numeric value that represents the threshold limit.
-
-
-
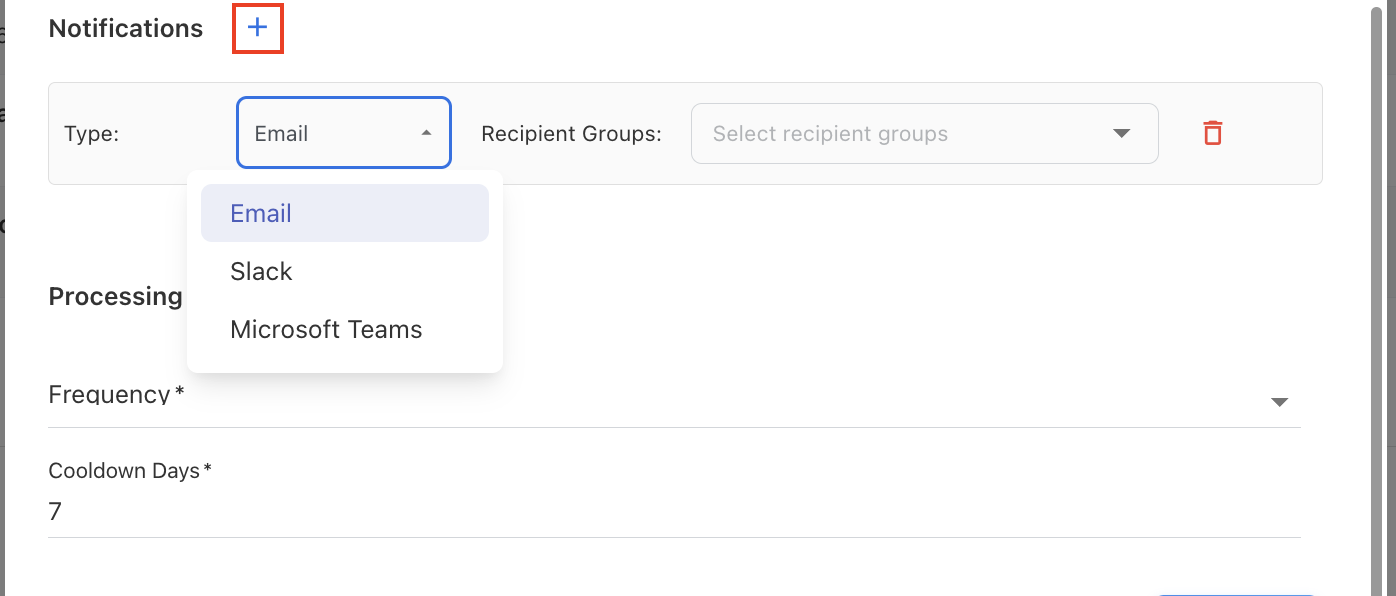
In Notifications,
-
Click + to add a notification to configure how you want to be notified when the rule is triggered, for example, Email, Microsoft Teams, or Slack.
-
Type: Choose Email, Microsoft Teams, or Slack.
-
Recipient Groups: Select a one or more group recipient(s).
-
-
Note: Only preconfigured and active notification groups can be selected during rule creation. For more details on how to configure the groups, refer Set up notification channel group.
-
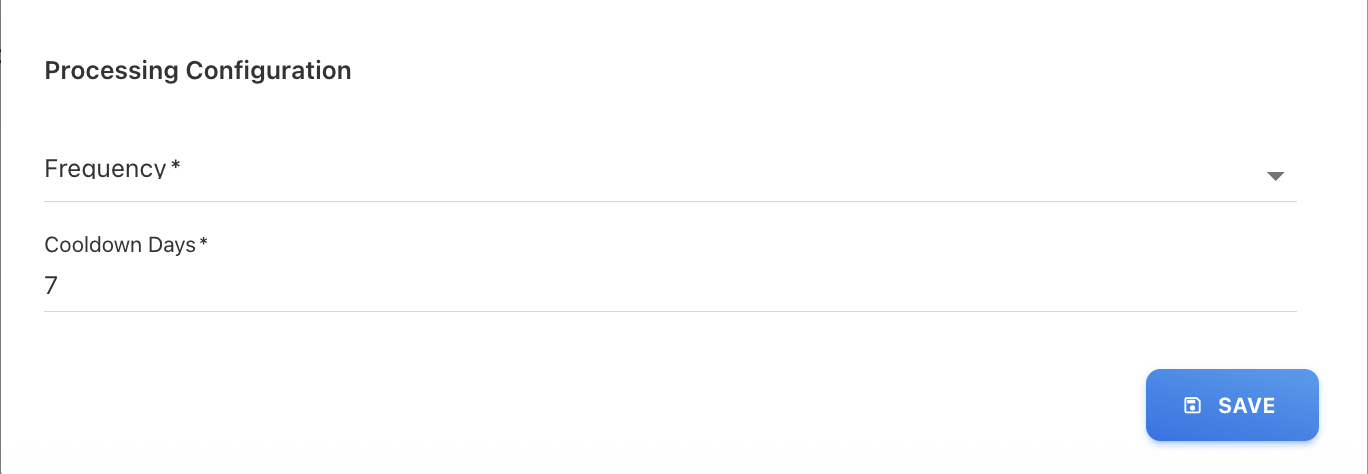
In Processing Configuration,
-
Frequency: Select how often the rule should run (daily, hourly, weekly, or monthly).
-
Cooldown Days: Define the cooldown period (in days) to prevent duplicate alerts for the same anomaly. The default is 7 days.
-
-
Click SAVE.
Note: The selected frequency determines both how often the rule runs and how the monitored data is grouped before anomaly detection is performed.
After the rule is saved:
-
The rule runs automatically according to the configured schedule.
-
Historical data is used to establish the expected baseline.
-
Newly completed periods are evaluated during each scheduled execution.
-
When the configured detection criteria are met, an Insight is generated and appears on the Insights page.
Related content