
Overview
Beta feature
The AI Narrative widget is a Beta feature. An administrator must enable the required AI settings (from Admin > Settings > AI > Copilot) before you can add the widget.
Use the AI Narrative widget to turn information from your custom dashboard into a written summary. The widget reviews selected dashboard reports and widgets and generates a formatted narrative that can highlight key findings, explain possible drivers, and identify areas that may need attention.
Narrative generation runs in the background, so you can continue working with the dashboard while Yarken prepares the narrative.
Before you begin
Before adding an AI Narrative widget, confirm that:
-
Ask Yarken Beta is enabled.
-
Your user account is included in the Beta users list.
-
An administrator has enabled Dashboard AI Narrative Feature (Beta) under Admin > Settings > AI > Copilots.
-
You have permission to create or edit the custom dashboard.
What the AI Narrative widget does
Use the AI Narrative widget to:
-
Review reports and widgets on the current dashboard.
-
Generate formatted narrative content from dashboard data.
-
Apply the dashboard's active filters when generating and displaying the stored narrative.
-
Generate narratives in the background without blocking the dashboard.
-
Add instructions to control the narrative's focus, tone, and level of detail.
-
Regenerate the narrative when the underlying data, filters, or configuration changes.
The AI Narrative widget works directly within the dashboard. You don't need to configure a separate Automation to generate the narrative.
Add an AI Narrative widget
-
Go to Analytics > Custom Dashboards.
-
Open the dashboard.
-
Select Edit.
-
Select Add Widget.
-
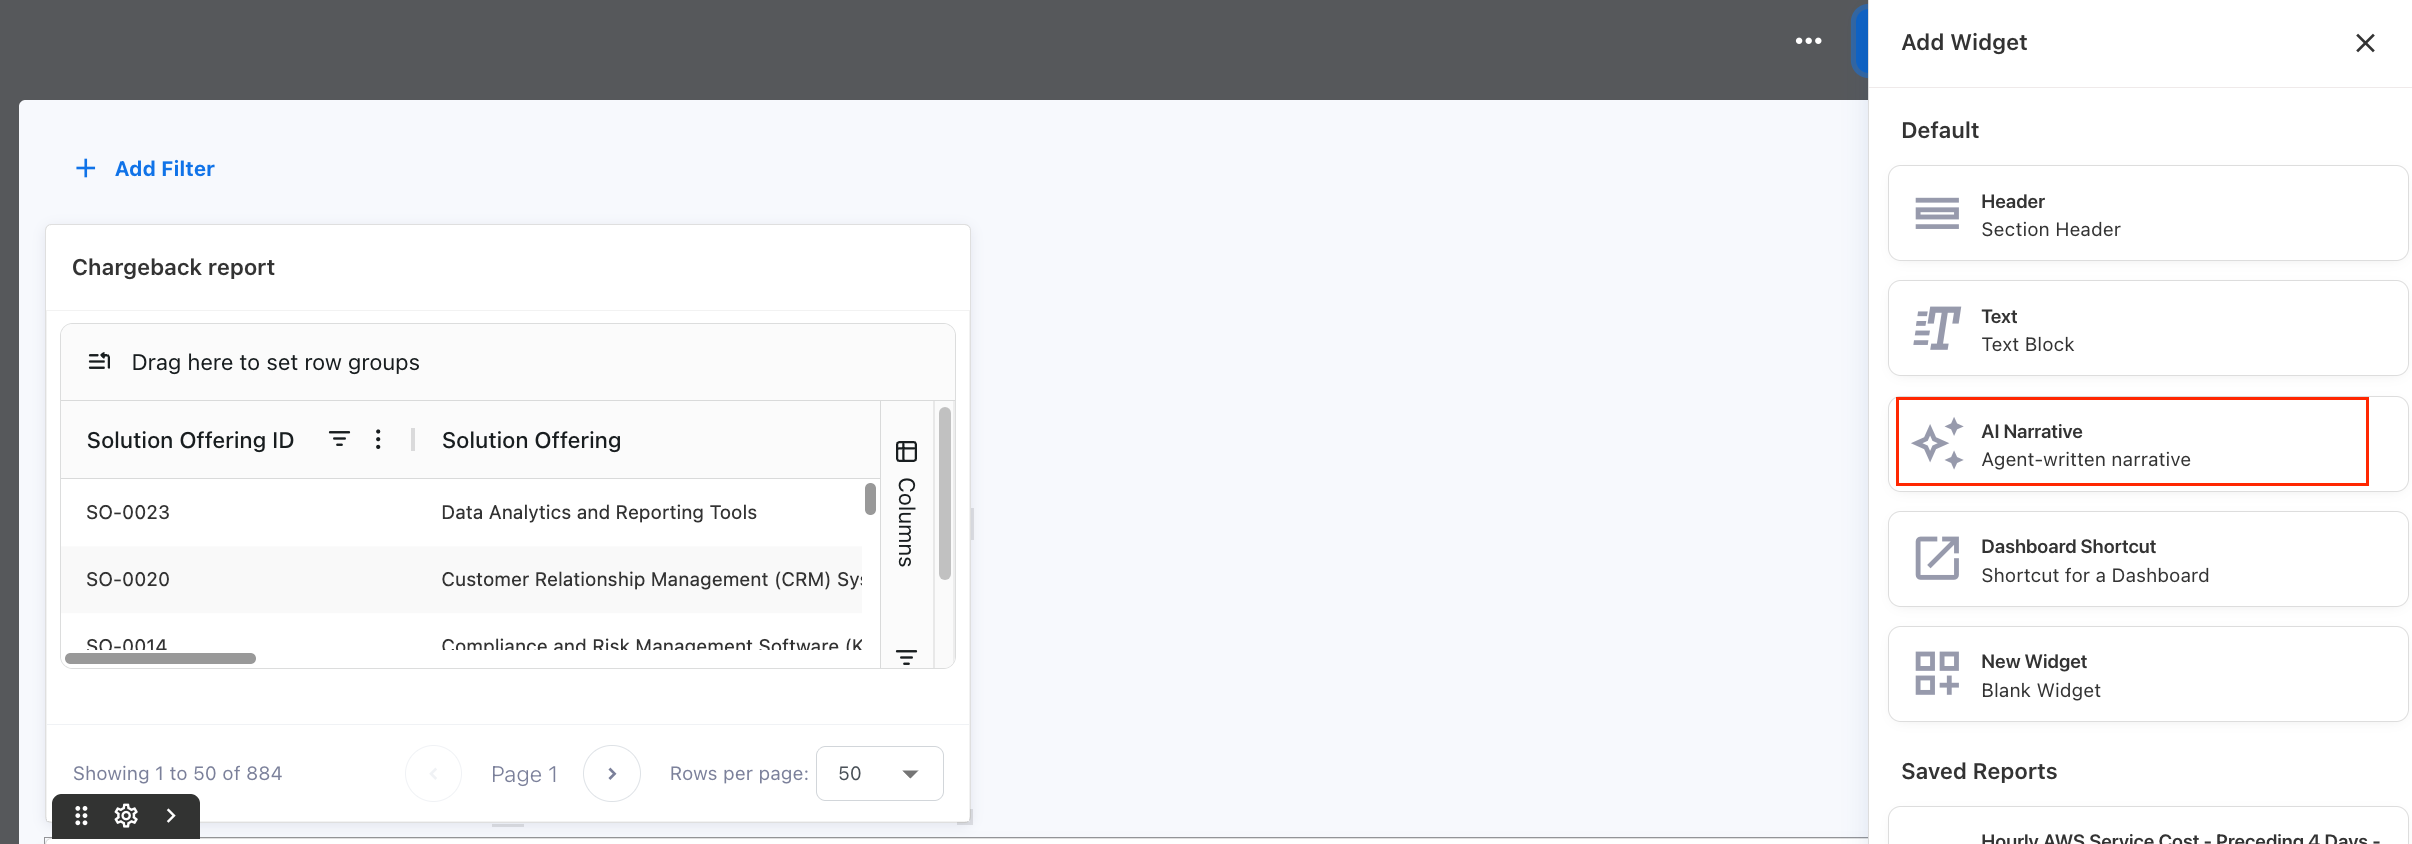
In the widget panel, select AI Narrative.
-
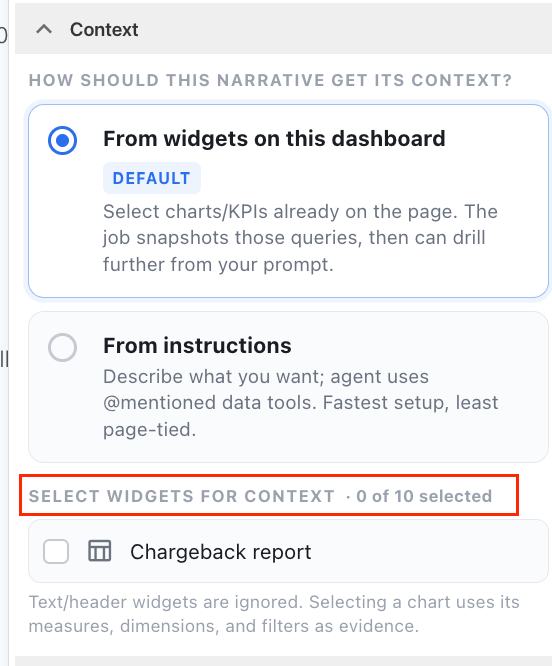
Select at least one dashboard widget to use as a source for the narrative.
-
Configure the AI Narrative widget.
-
Select Done.
After you add the widget, the customization panel opens on the right side of the dashboard.
Configure the widget
Configure card settings
Use the standard card settings to control how the AI Narrative widget appears on your dashboard.
|
Setting |
Description |
|---|---|
|
Title |
Enter the heading displayed above the narrative. |
|
Subtitle |
Add supporting context below the title. |
|
Border |
Show or hide the card border. |
|
Border radius |
Choose the corner style. |
|
Background |
Set the card background. |
|
Text |
Set the appearance of the narrative text. |
|
Show updated time |
Show when the narrative was last generated. |
Choose a content source
Choose the information you want the AI Narrative widget to use when generating the narrative.
From widgets on this dashboard
Select From widgets on this dashboard to generate the narrative from selected reports or widgets on the current dashboard.
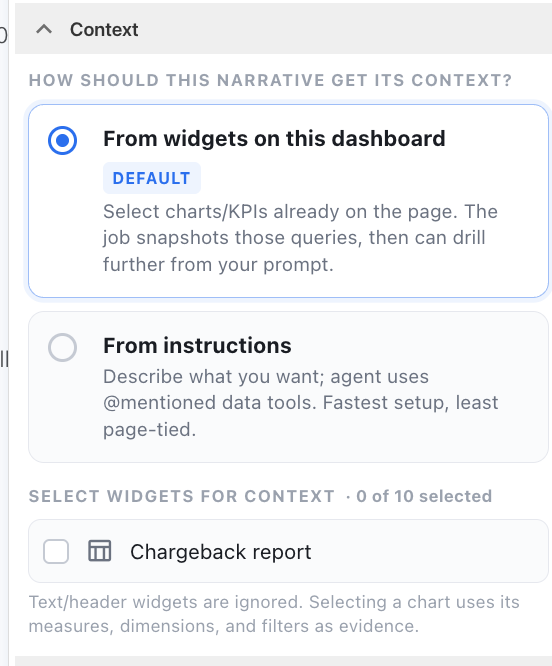
Use this option when you want the narrative to explain or summarize results displayed on the dashboard.
From instructions
Select From instructions to generate the narrative using the instructions you provide instead of relying only on selected dashboard widgets.
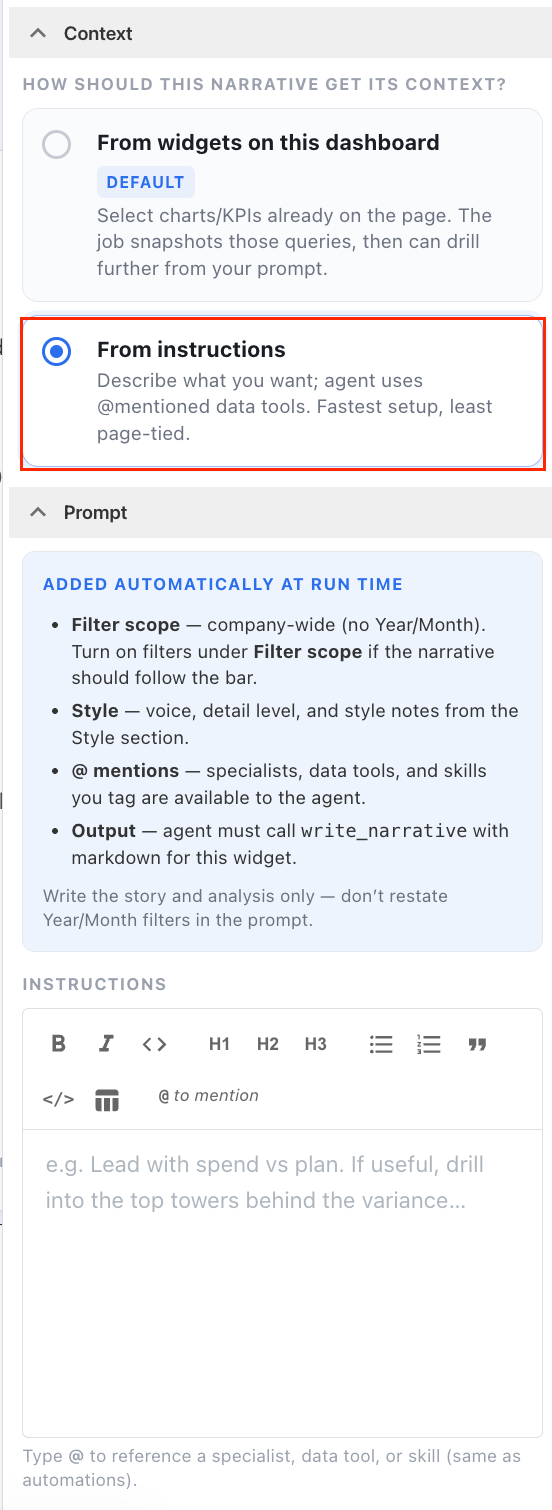
Use this option when you want to provide broader guidance or additional context for the narrative.
Add instructions
In Instructions, describe what you want the narrative to focus on.
For example:
-
Lead with the main variance against plan.
-
Explain the top cost drivers.
-
Compare the current month with the previous month.
-
Identify unusual movements and suggest possible causes.
-
Keep the summary suitable for an executive audience.
You can use instructions to control:
-
The metrics or findings to emphasize.
-
The order in which information appears.
-
The intended audience.
-
The narrative tone.
-
The level of detail.
The Instructions field supports formatted text.
Tip
Be specific about the outcome you need. For example, "Explain the three largest month-on-month cost changes and identify the business units responsible" is likely to produce a more focused result than "Summarize the dashboard."
Choose a voice
Select the writing style that best matches the intended audience.
|
Voice |
Best suited to |
|---|---|
|
Executive |
Senior leaders who need concise findings and business implications. |
|
Analyst |
Users who need more interpretation and supporting detail. |
|
Controller |
Finance users who need a control, variance, or governance-oriented view. |
Choose the level of detail
Select the approximate length of the generated narrative.
|
Option |
Approximate length |
|---|---|
|
Snapshot |
1–25 words |
|
Short |
About 60 words |
|
Brief |
About 200 words |
|
Balanced |
About 350 words |
|
Detailed |
About 500 words |
Use Snapshot or Short for compact dashboard cards. Use Balanced or Detailed when users need more in-depth analysis.
Highlight key information
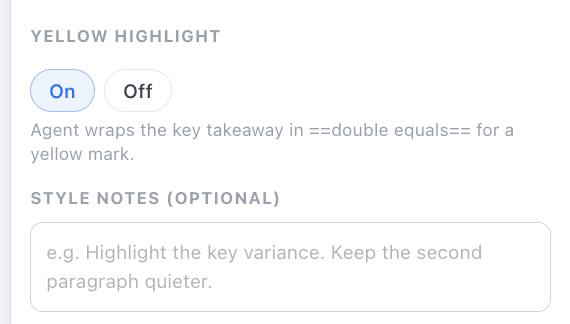
Turn on Yellow highlight to highlight key findings in the generated narrative.
Add optional style notes
Use Style notes (optional) to provide additional guidance about how the narrative should be written or presented.
For example, you can ask the narrative to:
-
Highlight a key variance.
-
Give less emphasis to supporting information.
-
Emphasize risks or actions.
-
Adjust how specific parts of the narrative are presented.
You can leave this field blank if you do not need additional style guidance.
Choose the run mode
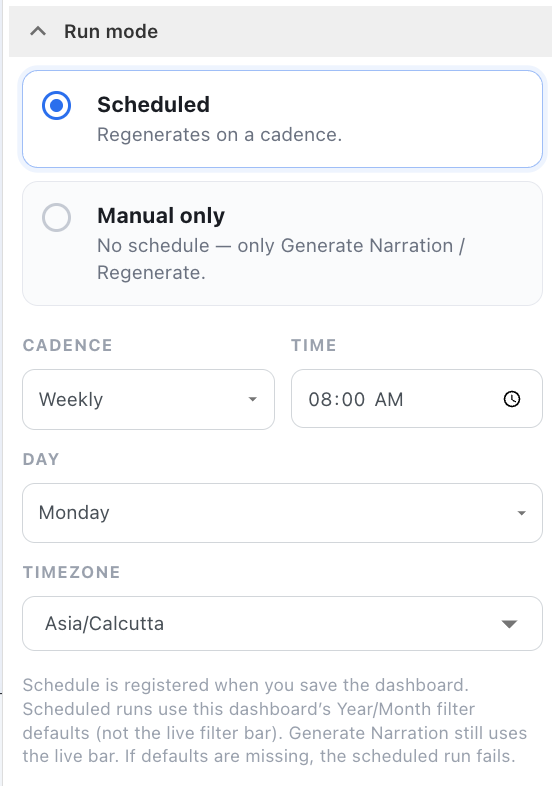
Under Run mode, choose when the AI Narrative should be generated.
Scheduled
Select Scheduled to regenerate the narrative automatically on a defined cadence.
Before setting a schedule, make sure the dashboard data is available and refreshed before the scheduled narrative runs. This helps ensure that the narrative is generated using the latest available data.
To schedule the narrative:
-
Under Run mode, select Scheduled.
-
Under Cadence, select how often the narrative should run:
-
Daily — Runs every day.
-
Weekly — Runs once a week. Select the Day of the week.
-
Monthly — Runs once a month. Select the Day of the month.
-
-
Under Time, select the time when the narrative should run.
-
Under Timezone, select the timezone for the schedule.
-
Save the dashboard to register the schedule.
Note:
The schedule is registered when you save the dashboard. Make sure the source data is available before the scheduled run time. For example, if dashboard data is refreshed every Monday at 7:00 AM, schedule the narrative to run after the data refresh is complete.
Manual only
Select Manual only if you do not want the narrative to run on a schedule.
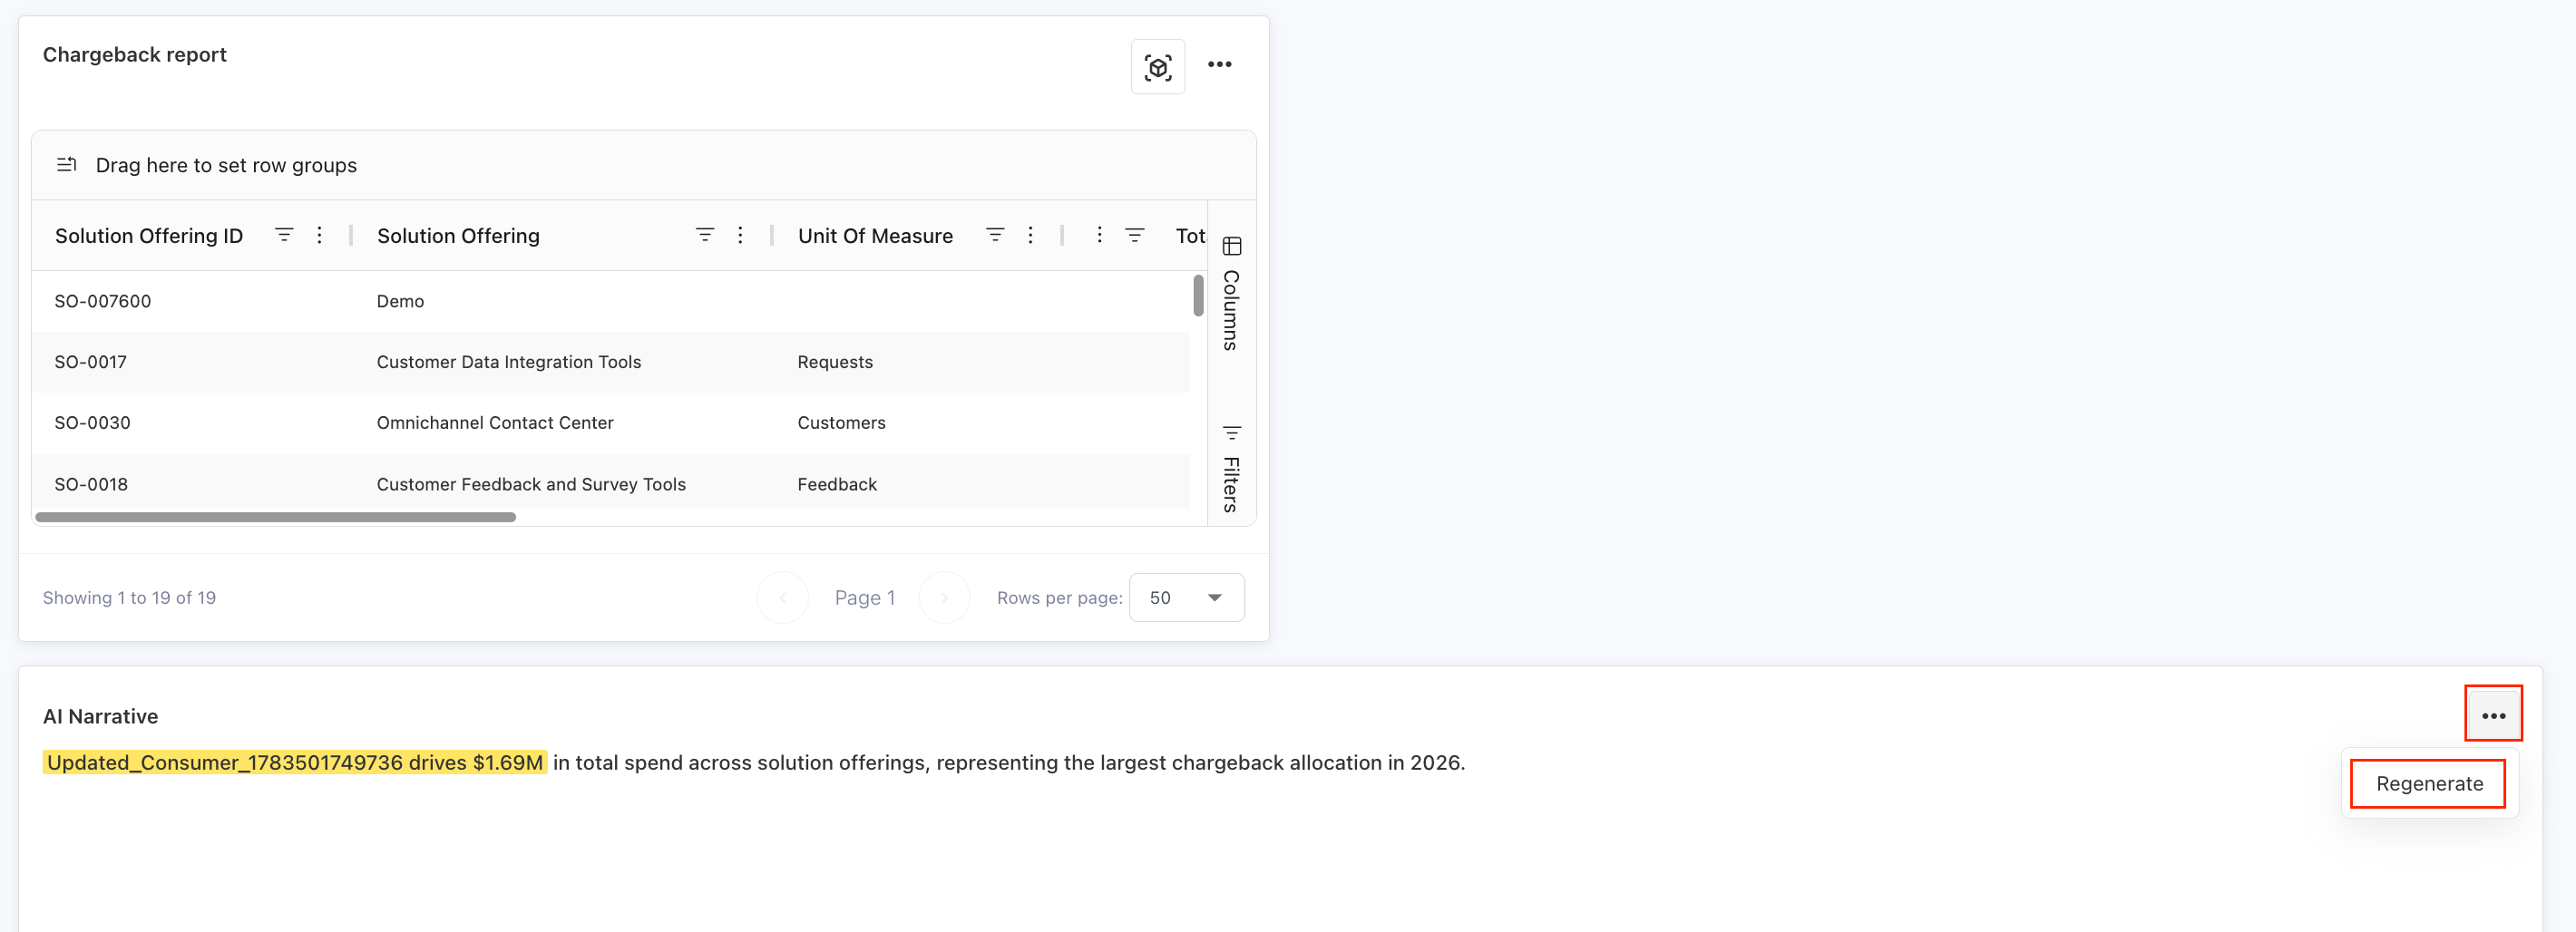
After saving the dashboard, use Generate Narration to generate the narrative for the first time or Regenerate to update an existing narrative.
Set the filter scope
Use Filter scope to control whether the narrative follows the Year and Month filters on the dashboard.
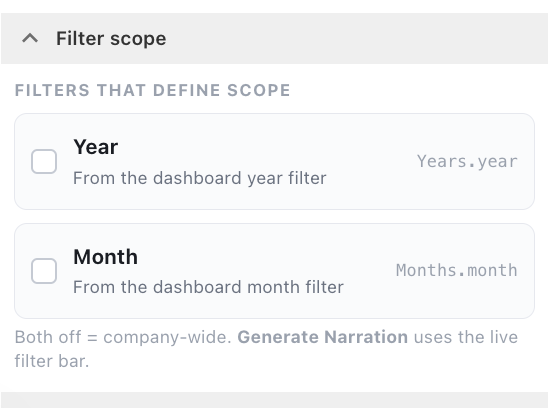
The following options are available:
|
Filter |
Description |
|---|---|
|
Year |
Uses the year selected in the dashboard filter bar to define the narrative scope. |
|
Month |
Uses the month selected in the dashboard filter bar to define the narrative scope. |
Turn on the filters under Filter scope if the narrative should follow the corresponding dashboard Year or Month filter.
If neither Year nor Month is selected, the narrative uses a company-wide (global) scope.
The stored narrative is associated with the dashboard's active filters. As a result, a narrative generated for one month or year may differ from a narrative generated with another filter selection.
After changing a relevant filter, regenerate the narrative to ensure that it reflects the updated dashboard context.
Filter scope for scheduled narratives
For scheduled narratives, the selected Filter scope also determines whether the scheduled run uses dashboard Year or Month scope.
If neither Year nor Month is selected, scheduled runs generate a company-wide narrative, even when the dashboard currently has filters applied.
Generate the narrative
After configuring the widget:
-
Select Done to save the dashboard.
-
Locate the AI Narrative widget.
-
Select Generate Narration.
-
Continue using the dashboard while generation runs in the background.
-
Review the narrative when it appears.
Success
Yarken stores the generated narrative and displays it in the widget. This means users don't need to wait for a new narrative to be generated each time the dashboard loads.
Regenerate a narrative
Regenerate the narrative when you:
-
Change the instructions.
-
Select different source widgets.
-
Change the voice or level of detail.
-
Apply different dashboard filters.
-
Refresh the underlying dashboard data.
-
Update assumptions or contextual information used by the dashboard.
Use the widget's ellipsis (…) menu to access the regeneration action.
View narrative run history
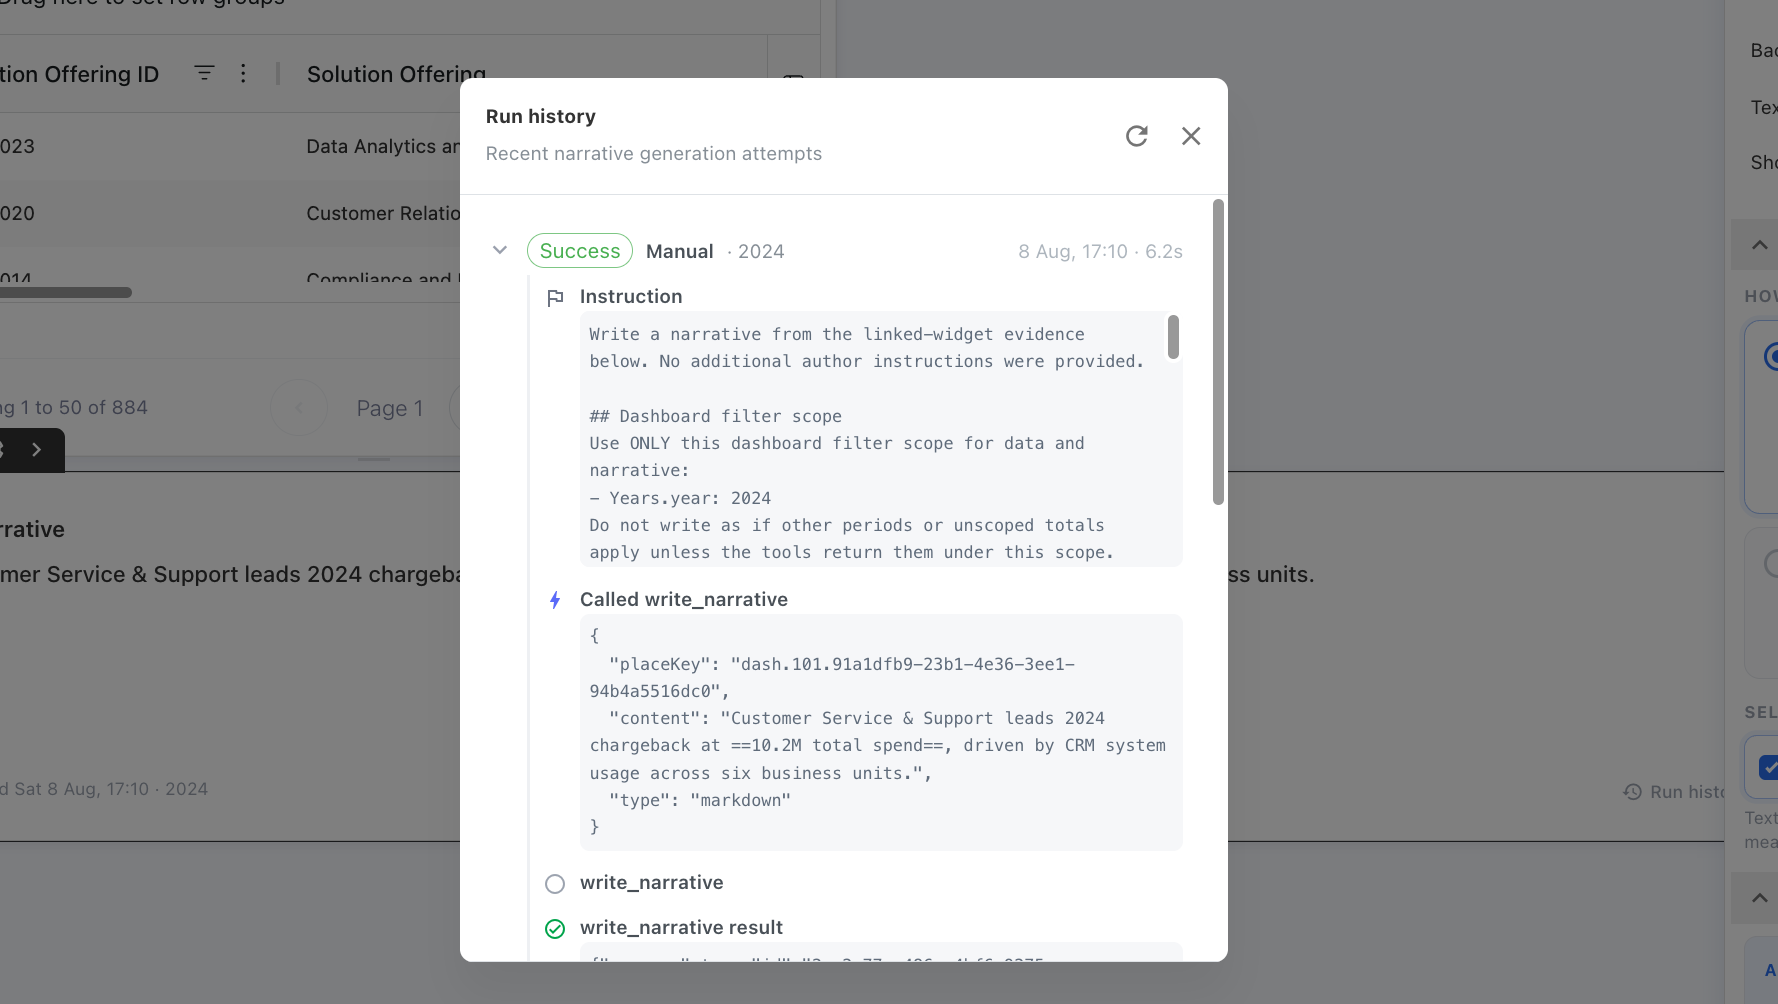
Use Run history to review recent AI narrative generation attempts. From the dashboard, you can review the status of recent runs. To view the details of a run, including the instructions, context, and generation details for a run, open the dashboard in Edit mode.
Run history helps you understand how a narrative was generated, verify the instructions and context used, and investigate unexpected results.
You can use Run history to:
-
Review previous narrative generations.
-
Review instructions used to generate the narrative
-
Verify which dashboard widgets were used.
-
Confirm the dashboard filter scope used during generation.
-
Compare generated narratives.
-
Troubleshoot unexpected narrative results.
Open run history
-
Open the custom dashboard.
-
Click Edit.
-
Open the AI Narrative widget.
-
Click Run history in the lower-right corner of the widget.
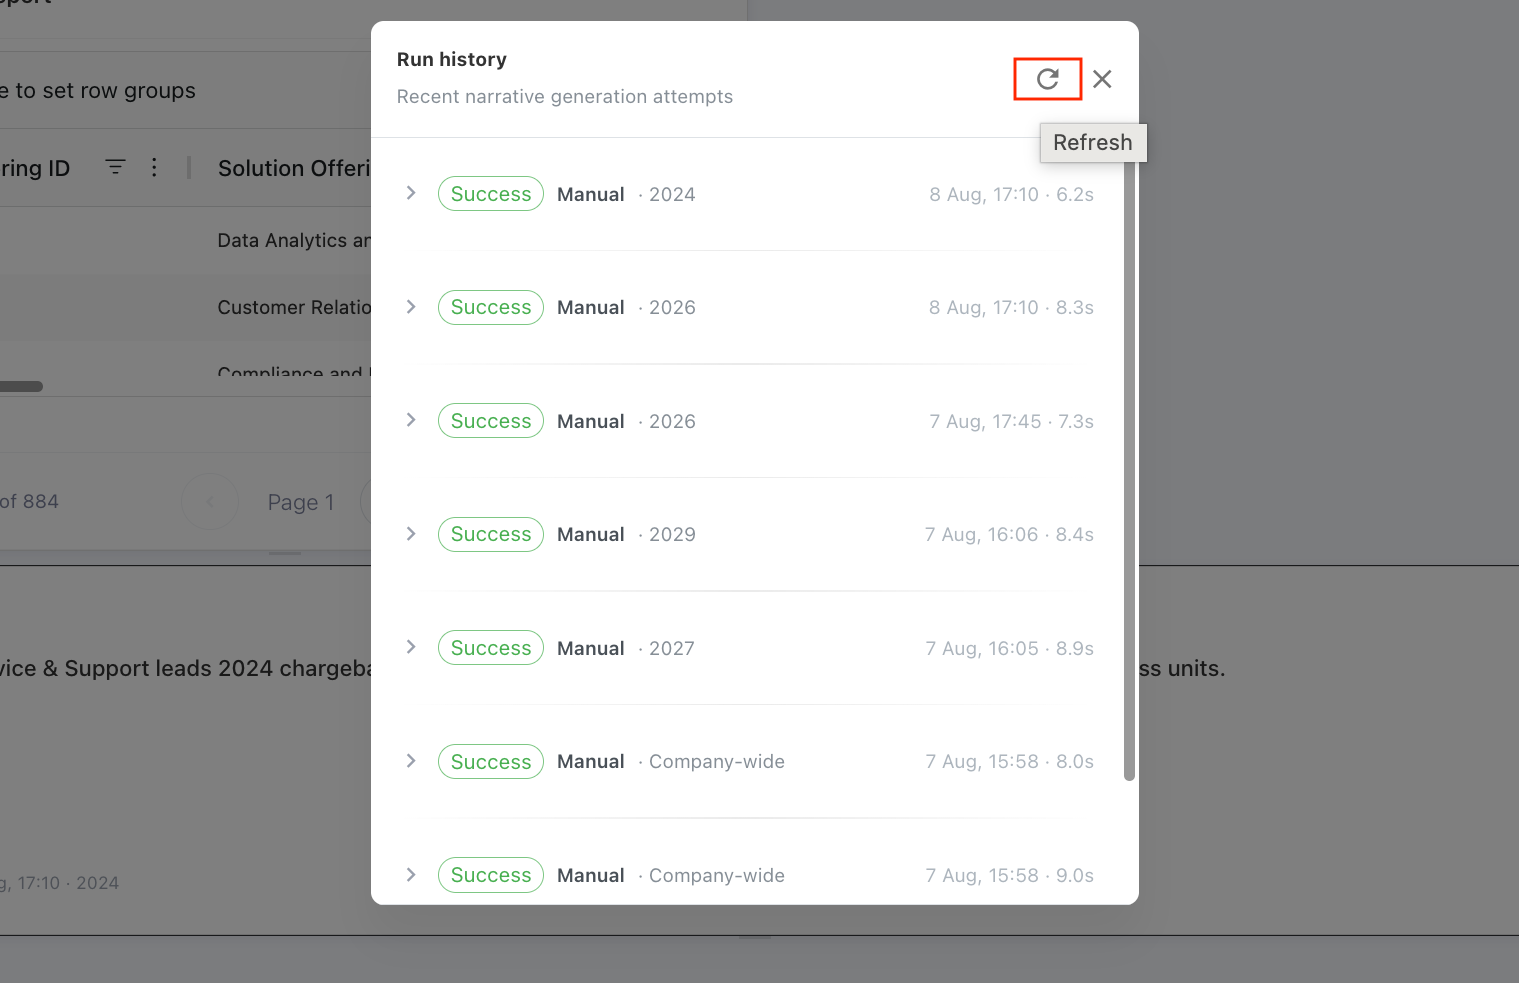
The Run history dialog opens and displays recent narrative generation attempts.
To view the latest generation attempts, click the Refresh icon.
Best practices
-
Select focused source widgets
-
Choose widgets that contribute directly to the same business question. Combining unrelated reports can result in a less focused narrative.
-
-
Write specific instructions
-
Include the reporting period, comparison, intended audience, and expected outcome.
-
For example:
-
Summarize July cloud expenditure for the CFO. Compare actual cost with budget, identify the three largest variances, and end with recommended follow-up actions.
-
-
Match the voice to your audience
Use:
-
-
Executive for concise findings and decision support.
-
Analyst for deeper interpretation and supporting detail.
-
Controller for finance, control, variance, and governance-oriented commentary.
-
-
Generate narratives after data refreshes
-
Generate or regenerate the narrative after the dashboard data refreshes. Otherwise, the narrative may describe an earlier data state.
-
-
Align scheduled runs with data availability
-
When scheduling a narrative, make sure the dashboard data is available and refreshed before the scheduled run time. This helps ensure that the narrative uses the latest available data.
-
-
Set the appropriate filter scope
-
Before generating or scheduling a narrative, check the Filter scope settings.
-
Turn on Year or Month if the narrative should follow the corresponding dashboard filter.
-
Leave both filters off if the narrative should use the company-wide scope.
-
-
Review run history when results are unexpected
-
If a narrative does not produce the expected result, review its run information.
-
You can review recent run status from the dashboard. For detailed information about a run, including its instructions and generation context, open the dashboard in Edit mode and review the detailed run history.
-
Related content