
Custom Dashboards help you bring reporting and analytical information together in reusable views for recurring reviews, monitoring, and decision-making.
Use Custom Dashboards when you need a focused view for a team, process, or reporting audience. You can combine Analytics content with dashboard-specific widgets and controls, then configure access for the people who need to view or maintain the dashboard.
Custom Dashboards at a glance
Bring reporting views, metrics, filters, and collaboration tools together in one focused workspace for recurring monitoring and decision-making.
What you can do
Use Custom Dashboards to:
-
Create focused reporting views for teams, functions, and review cycles.
-
Add and arrange charts, tables, KPI widgets, text, and headers.
-
Apply dashboard-level and widget-level filters.
-
Customize the dashboard background color.
-
Use Proportional Bar visualizations to compare a metric across categories and review relative values and prior-year variance.
-
Use Heatmap visualizations to compare a measure across two dimensions and identify patterns or concentrations across categories.
-
Add detected Insights alongside other dashboard metrics.
-
Add AI-generated narratives to summarize dashboard information.
-
Add Ask Yarken so users can ask questions and explore dashboard information in context.
-
Create Dashboard Shortcuts to connect related dashboards.
-
Share dashboards with viewers and editors.
-
Import and reuse dashboard configurations where supported.
-
Copy, rename, and manage existing dashboards.
-
Add comments and collaborate in the dashboard context.
-
Organize Custom Dashboards into folders and publish selected dashboards or folders to the Yarken menu for easier navigation.
Access Custom Dashboards
To open Custom Dashboards:
-
Go to Analytics.
-
Select Custom Dashboards.
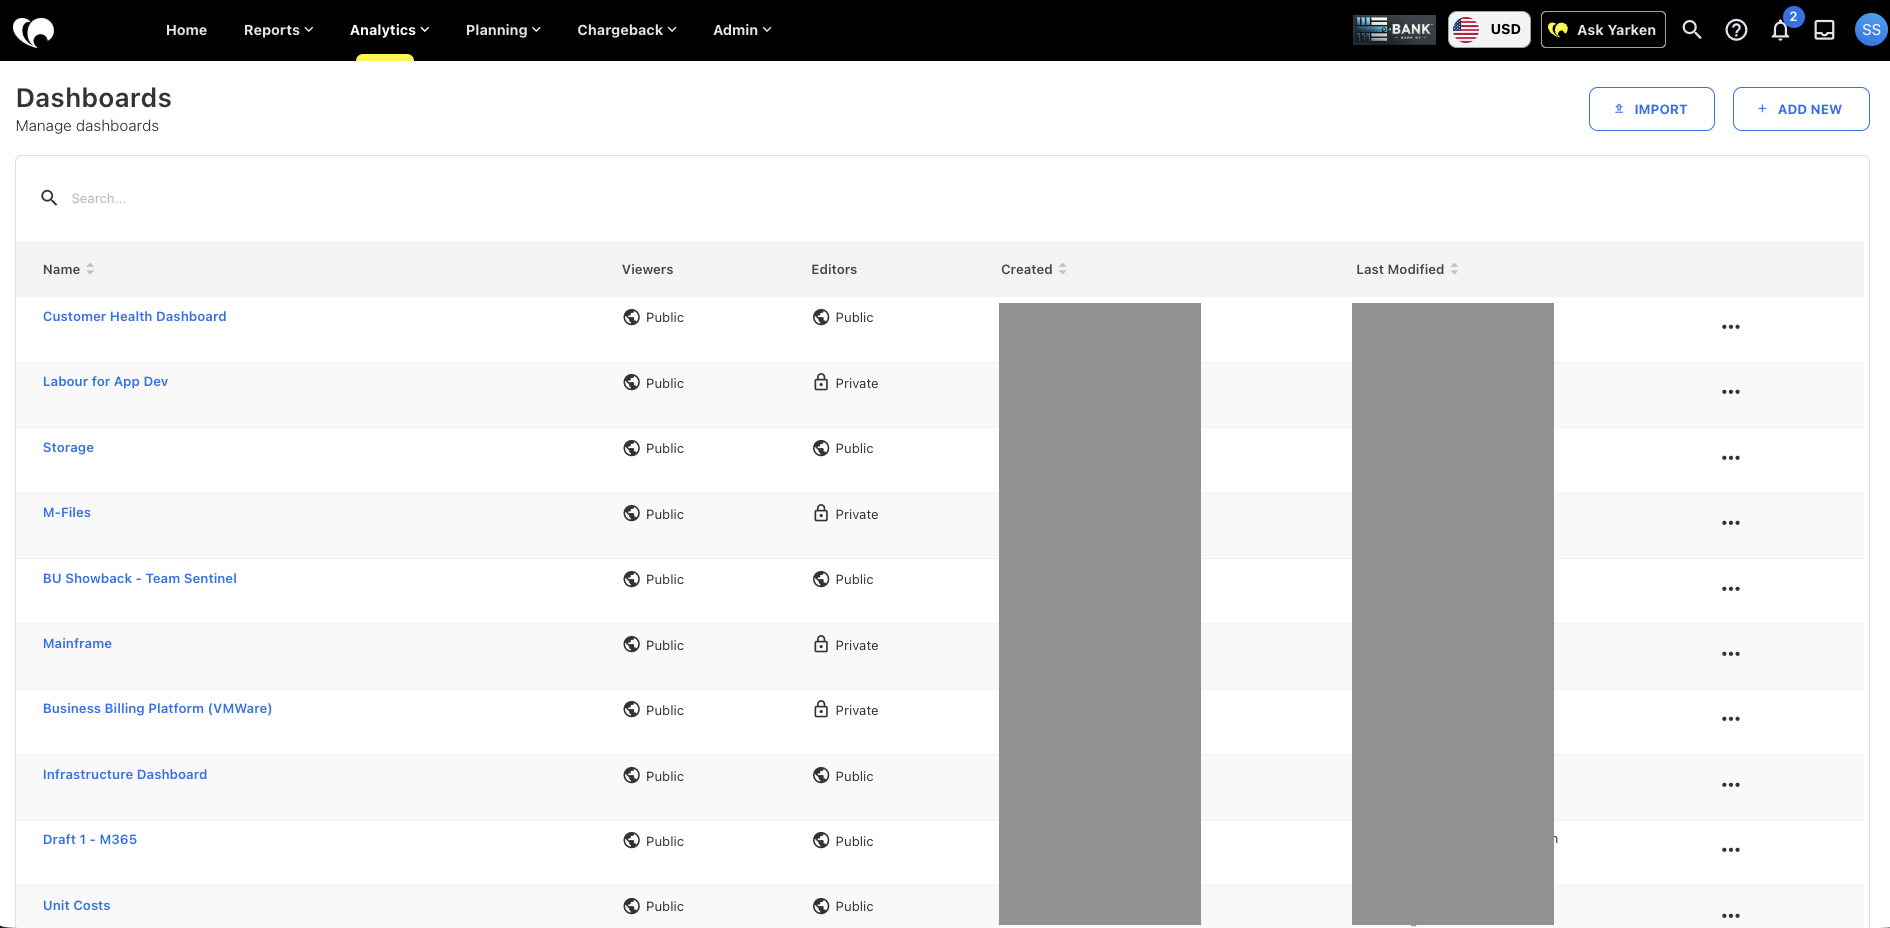
The Dashboards page lists the dashboards available to you and provides controls to search, import, and create dashboards.
Understand the Dashboards list
The Dashboards list shows the dashboards available to you.
|
Column |
Description |
|---|---|
|
Name |
Dashboard name. Select the name to open the dashboard. |
|
Viewers |
Shows whether viewer access is public or private. |
|
Editors |
Shows whether editor access is public or private. |
|
Created |
Shows who created the dashboard and when it was created. |
|
Last Modified |
Shows who last changed the dashboard and when it was updated. |
|
Actions |
Opens additional actions for the dashboard. |
Access reminder: Review viewer and editor permissions before sharing a dashboard or making changes to its configuration.
Dashboard access
Dashboard access controls determine who can view or edit a dashboard.
Viewer access can make a dashboard available more broadly or limit it to selected users or groups. Editor access controls who can change the dashboard configuration.
Use restricted access for draft dashboards, sensitive financial views, or dashboards intended for a specific audience. Review viewer and editor access before sharing a dashboard broadly.
For detailed creation, access, appearance, and management steps, see Create and manage Custom Dashboards.
Dashboard content
A Custom Dashboard can include different types of content depending on the reporting experience you want to create.
Common dashboard content includes:
-
Analytics charts and tables
-
KPI widgets
-
Text and header widgets
-
Dashboard Shortcuts
-
Insight widgets
-
AI Narrative widgets
-
Ask Yarken widgets
Available configuration options depend on the widget and visualization type.
How Custom Dashboards work with Analytics
Use Analytics to explore data, build detailed report views, and save reports.
Use Custom Dashboards to bring relevant reporting views together in a focused workspace for recurring monitoring and review.
This lets analysts work with detailed data in Analytics while giving other stakeholders a dashboard designed for their reporting needs.
Common uses
Custom Dashboards work well for recurring reporting and review processes, including:
-
Monthly finance reviews
-
Budget and forecast reviews
-
Vendor spend analysis
-
Cost center reporting
-
Executive reporting
-
FinOps reviews
-
Chargeback reviews
-
Optimization tracking
-
Service performance reporting
-
Portfolio-level cost reviews
Explore Custom Dashboards
Use the following guides to configure and manage Custom Dashboards:
-
Create and manage Custom Dashboards — Create a dashboard, customize its background, work in Edit mode, and manage existing dashboards.
-
Add and configure dashboard widgets — Add, arrange, duplicate, and configure dashboard widgets.
-
Configure chart and table widgets — Configure visualizations, trend lines, and forecasting.
-
Configure KPI widgets — Configure KPI values, appearance, icons, and forecasting options.
-
Configure Dashboard Shortcuts — Create and style shortcuts to related dashboards.
-
Add Insights to Custom Dashboards — Surface detected Insights alongside other dashboard metrics.
-
Add and configure a Dashboard AI Narrative widget — Generate and schedule AI narratives from dashboard information.
-
Add and configure an Ask Yarken widget — Add Ask Yarken to a dashboard and configure its appearance and suggested questions.
-
Configure dashboard filters — Configure dashboard-level and widget-level filtering.
-
Import and share Custom Dashboards — Import dashboards and manage viewer and editor access.
-
Organize and publish Custom Dashboards — Organize related Custom Dashboards into folders and publish selected content to the Yarken menu.
Recommended practices
-
Build each dashboard around a clear reporting purpose or audience.
-
Keep dashboard content focused and review the widget-count indicator when adding content.
-
Use dashboard-level filters when multiple widgets should share the same reporting context.
-
Choose a dashboard background that keeps widget content easy to read.
-
Review viewer and editor access before sharing a dashboard.
-
Validate dashboard results before using them for financial or executive reporting.
Troubleshooting
If a dashboard does not show the expected information, check:
-
The correct dashboard is open.
-
You have access to view the dashboard.
-
You have editor access before trying to change the dashboard.
-
Active filters match the reporting context you expect.
-
The underlying data is available for the selected period.
-
Source reports and saved reports still contain the expected fields and results.
For widget-specific issues, review the guide for that widget or visualization.
Next step
Related content