
Consumption Data helps teams analyze usage-based cloud, mobile, and service consumption data in Analytics.
Use this page when you need to understand what was consumed, where it was consumed, which provider or team is associated with it, how cost was calculated, and how consumption connects to operational, financial, and sustainability reporting.
For the workspace layout, report builder controls, filters, visualizations, saved reports, and pre-aggregations, start with Getting Started with Analytics.
What Consumption Data helps you answer
Consumption Data is built for usage-level analysis.
Use it to answer questions such as:
-
Which providers, services, or products are driving billed cost?
-
How do list, contracted, effective, and billed costs compare?
-
Which billing accounts, teams, or entities are associated with consumption?
-
Which units, quantities, and pricing attributes explain cost movement?
-
Which mobile teams, employees, or charge types are driving mobile spend?
-
Which consumption records connect to sustainability reporting?
-
Which external or original currency values need reconciliation?
-
Which consumption attributes can support FinOps, TBM, and chargeback analysis?
Consumption Data gives teams a detailed view of usage and cost drivers after consumption records have been loaded into Yarken.
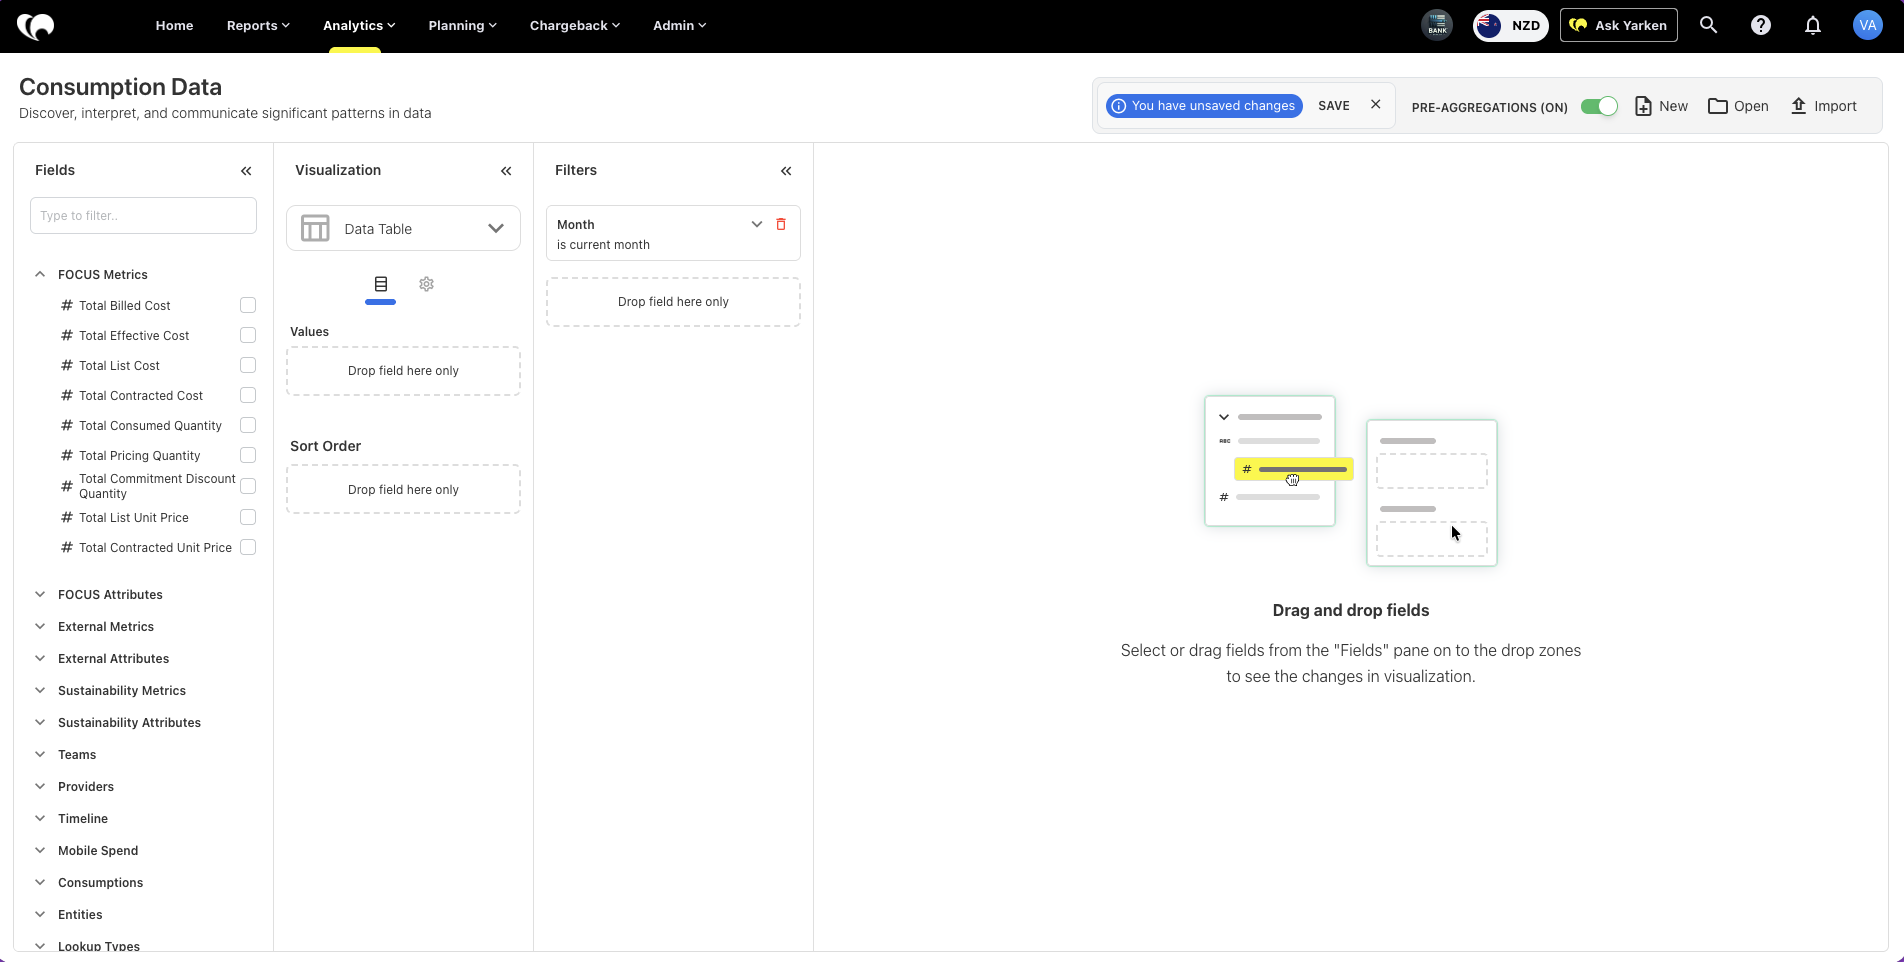
Access Consumption Data
To open Consumption Data:
-
Navigate to Analytics
-
Select Consumption Data
The page opens the Consumption Data analytics cube.
Consumption Data sources
Consumption Data uses usage and consumption records loaded into Yarken.
Consumption records may include:
-
Cloud billing and usage data
-
FOCUS-aligned cloud cost data
-
Mobile usage and charge data
-
Provider and service consumption data
-
Sustainability-related consumption estimates
-
Custom consumption attributes
-
Entity and lookup-based reporting data
The available fields depend on the data loaded into the environment and the integrations configured for the tenant.
Key FOCUS metrics
The FOCUS Metrics group contains core cost and quantity measures used for cloud consumption analysis.
Common measures include:
|
Field |
Use it to understand |
|---|---|
|
Total Billed Cost |
The billed cost for the selected consumption scope |
|
Total Effective Cost |
Cost after applicable discounts, adjustments, or pricing logic |
|
Total List Cost |
Cost before discounts or negotiated pricing |
|
Total Contracted Cost |
Cost based on contracted commercial terms |
|
Total Consumed Quantity |
Amount of service or resource consumed |
|
Total Pricing Quantity |
Quantity used for pricing calculations |
|
Total Commitment Discount Quantity |
Quantity associated with commitment discount usage |
|
Total List Unit Price |
List price per unit |
|
Total Contracted Unit Price |
Contracted price per unit |
Use these fields to compare cost types, review usage volume, and identify differences between list, contracted, effective, and billed cost.
FOCUS attributes
The FOCUS Attributes group provides detailed cloud billing and usage context.
These fields help explain where consumption occurred, how it was billed, and which pricing or commitment attributes apply.
Example attributes include:
-
Availability Zone
-
Billing Account ID
-
Billing Account Name
-
Billing Currency
-
Billing Period Start
-
Billing Period End
-
Charge Period Start
-
Charge Period End
-
Charge Category
-
Charge Description
-
Charge Frequency
-
Commitment Discount Name
-
Commitment Discount Type
-
Commitment Discount Category
-
Commitment Discount Status
-
Commitment Discount Unit
-
Capacity Reservation ID
-
Capacity Reservation Status
-
Pricing Category
-
Pricing Unit
-
Consumed Unit
-
SKU ID
-
SKU Price ID
-
SKU Price Details
-
SKU Meter
Use these attributes when you need detailed FinOps-style analysis of billing structure, pricing behavior, commitment usage, or resource-level consumption.
External metrics and attributes
External fields show source or original values from imported consumption data.
These fields are useful when validating data against external provider files, original billing exports, or upstream systems.
Examples include:
-
Total Billed Cost (Original)
-
Total Effective Cost (Original)
-
Total List Cost (Original)
-
Total Contracted Cost (Original)
-
Total Contracted Unit Price (Original)
-
Total List Unit Price (Original)
-
Billing Currency (Original)
-
Billing Exchange Rate
-
Cloud Asset Name
-
Cloud Team Name
-
Azure Resource Group
-
Product ID
-
Product Name
-
Application Tag
-
Product Tag
-
Service Tag
-
Google Project ID
-
Google Project Tag
-
Custom strings, numbers, and dates
Use these fields when reconciling Yarken reporting against provider data or investigating source-level differences.
Sustainability metrics and attributes
Consumption Data can include sustainability-related measures where the source data supports them.
Common sustainability metrics include:
-
Usage electricity consumption (kWh)
-
Usage emissions (tonnes CO2e)
-
Manufacturing emissions (tonnes CO2e)
-
Total combined emissions (tonnes CO2e)
-
Water consumption cooling (litres)
-
Water consumption electricity production (litres)
The Sustainability Attributes group can include fields such as Estimate Type.
Use these fields to analyze the environmental impact of cloud and technology consumption alongside financial cost.
Mobile spend fields
The Mobile Spend group supports analysis of mobile usage and mobile-related charges.
Common fields include:
-
Mobile Number
-
Charge Type
-
Employee Name
-
Employee Team
-
Service Provider
-
Charge Date
-
Charge Description
-
Total Charge
-
Custom fields
Use Mobile Spend fields to review mobile cost by employee, team, provider, charge type, and period.
Consumption mapping fields
The Consumptions group contains mapping and classification fields that help connect usage data to Yarken reporting structures.
Common fields include:
-
Rule Name
-
Tower
-
Sub Tower
-
Asset Type
-
Asset ID
-
Usage
-
Custom fields
Use these fields when you need to understand how consumption records map into assets, towers, sub towers, or custom reporting structures.
Provider, team, entity, timeline, and lookup fields
Consumption Data includes supporting dimensions for operational and financial reporting.
Common dimension groups include:
|
Dimension group |
Use it to analyze |
|---|---|
|
Teams |
Consumption by team or operational owner |
|
Providers |
Consumption by provider code or provider name |
|
Timeline |
Consumption by calendar date, month, quarter, or year |
|
Entities |
Consumption by entity code, name, region, country, or owner |
|
Lookup Types |
Configured lookup values and custom reference data |
These dimensions help connect consumption records to ownership, reporting periods, regions, and governance structures.
Recommended report structures
Start with a specific consumption question, then select the measures and dimensions that answer it.
|
Consumption question |
Suggested report structure |
|---|---|
|
Which providers are driving cloud cost? |
Provider Name, Service Tag, Total Billed Cost, Total Effective Cost, Month |
|
Which services have the highest usage volume? |
Product Name, Consumed Unit, Total Consumed Quantity, Total Billed Cost |
|
Where do contracted and billed costs differ? |
Total Contracted Cost, Total Billed Cost, Billing Account Name, Provider Name |
|
Which teams are driving mobile charges? |
Employee Team, Charge Type, Service Provider, Total Charge, Charge Date |
|
Which cloud resources need cost review? |
Cloud Asset Name, Azure Resource Group, Product ID, Total Effective Cost |
|
Which sustainability impacts are material? |
Provider Name, Product Name, Usage Emissions, Electricity Consumption, Estimate Type |
|
Which entities carry the most consumption cost? |
Entity Name, Entity Region, Provider Name, Total Billed Cost |
Save recurring views for FinOps reviews, consumption reporting, sustainability analysis, and provider cost reviews.
Relationship with Consumption in Designer
Consumption Data in Analytics depends on consumption records loaded into Yarken.
-
Use Designer → Consumption to manage and upload consumption data across services, platforms, mobile usage, cloud usage, and license-based consumption.
-
Use Consumption Data in Analytics to analyze the loaded data across cost, quantity, provider, team, entity, timeline, and custom reporting fields.
Relationship with FOCUS and FinOps
Consumption Data supports FOCUS-aligned cloud cost analysis where FOCUS data is available.
FOCUS fields help standardize cloud billing and usage reporting across providers by giving teams a consistent structure for cost, pricing, quantity, billing period, service, and commitment-related analysis.
This supports FinOps workflows such as:
-
Cost visibility
-
Provider cost review
-
Usage analysis
-
Commitment discount review
-
Unit cost analysis
-
Charge period and billing period review
-
Cloud spend reconciliation
Relationship with chargeback and TBM reporting
Consumption data can support downstream allocation, chargeback, and TBM reporting.
Usage records can help explain:
-
Which teams or consumers used a service
-
Which provider or product generated cost
-
Which entity or region owns the consumption
-
Which asset, tower, or sub tower the usage maps to
-
Which period the cost belongs to
This gives finance and technology teams the operational detail behind cost allocation and accountability workflows.
Recommended practices
Use these practices when working with Consumption Data:
-
Start with the consumption question before selecting fields
-
Use cost measures and quantity measures together where possible
-
Filter by month or billing period before reviewing large datasets
-
Use provider, service, product, and team fields to explain cost movement
-
Use original currency and exchange rate fields when reconciling source data
-
Use sustainability fields only when the underlying data has been loaded and validated
-
Save standard reports for recurring FinOps and consumption reviews
-
Check source upload status when expected data is missing
Clear consumption reporting improves cost ownership, allocation accuracy, and operational decision-making.
Common use cases
Consumption Data is commonly used for:
-
Cloud cost and usage analysis
-
FOCUS-based FinOps reporting
-
Provider and service cost review
-
Billing account analysis
-
Mobile spend reporting
-
Team-level usage review
-
Sustainability reporting
-
Consumption-to-asset mapping review
-
Chargeback support
-
Cloud spend reconciliation
Troubleshooting Consumption Data results
If Consumption Data does not show expected values, check:
-
The active Month, Year, Entity, Provider, or Service filters
-
Whether the relevant consumption file was loaded successfully
-
Whether the source data includes the selected fields
-
Whether original currency and exchange rate fields are configured correctly
-
Whether FOCUS-aligned fields exist in the uploaded data
-
Whether mobile, cloud, or sustainability data has been loaded for the selected period
-
Whether custom fields were mapped during ingestion
-
Whether the selected field belongs to the expected data group
If totals still do not match expectations, compare the Analytics view against the source consumption upload and provider billing file.
Next step
Related content