
Overview
The Consumer Spend cube provides a consumer-level view of IT costs, showing how Solution Offering spend is ultimately allocated to business units, departments, products, customers, or other consumers. It helps organizations understand who is consuming IT services, how much they are consuming, and the cost associated with that consumption.
Consumer Spend is typically the final stage of the Yarken cost model, where costs have already flowed through the following allocation hierarchy:
Expenses → Cost Pools → Towers → Assets → Solutions → Consumers
Use this cube to:
-
Review Consumer-level IT charges.
-
Analyze Solution-to-Consumer allocations.
-
Understand service consumption patterns.
-
Identify high-cost consumers.
-
Compare usage and spending across consumers.
Before you begin
Before data appears in the Consumer Spend cube:
-
Expenses must be allocated through Cost Pools, Towers, Assets, and Solutions.
-
Solution Offerings must be mapped to one or more Consumers.
-
Consumer allocation rules or mappings must be configured.
-
Usage values must be defined if usage-based allocation is used.
If Solution-to-Consumer allocation has not been configured, the Consumer Spend cube may return little or no data.
Accessing the Consumer Spend cube
-
Navigate to Analytics.
-
Open Consumer Spend.
-
Select the required reporting period, filters, and dimensions.
-
Drag fields from the Fields pane into the visualization area to build your report.
The Consumer Spend cube supports ad hoc reporting, allowing you to analyze spend and usage from different perspectives.
Understanding Consumer Spend metrics
The Consumer Spend cube contains both financial and usage-related measures.
Consumer Spend
Consumer Spend represents the total cost allocated to a Consumer from a Solution Offering. This is the amount ultimately charged or attributed to the Consumer after all upstream allocations have been completed.
Unit Spend
Unit Spend represents the cost per unit of usage for a Solution Offering. It is calculated by dividing the total Solution spend by the total usage defined for that Solution Offering.
Formula
Unit Spend = Total Solution Spend ÷ Total Usage
If multiple Consumers use the same Solution Offering, the Unit Spend remains the same for all Consumers.
Total Usage
Total Usage represents the total amount of usage defined for a Solution Offering across all Consumers. This value is established during Consumer allocation.
Usage
Usage represents the portion of Total Usage assigned to an individual Consumer during Solution-to-Consumer allocation.
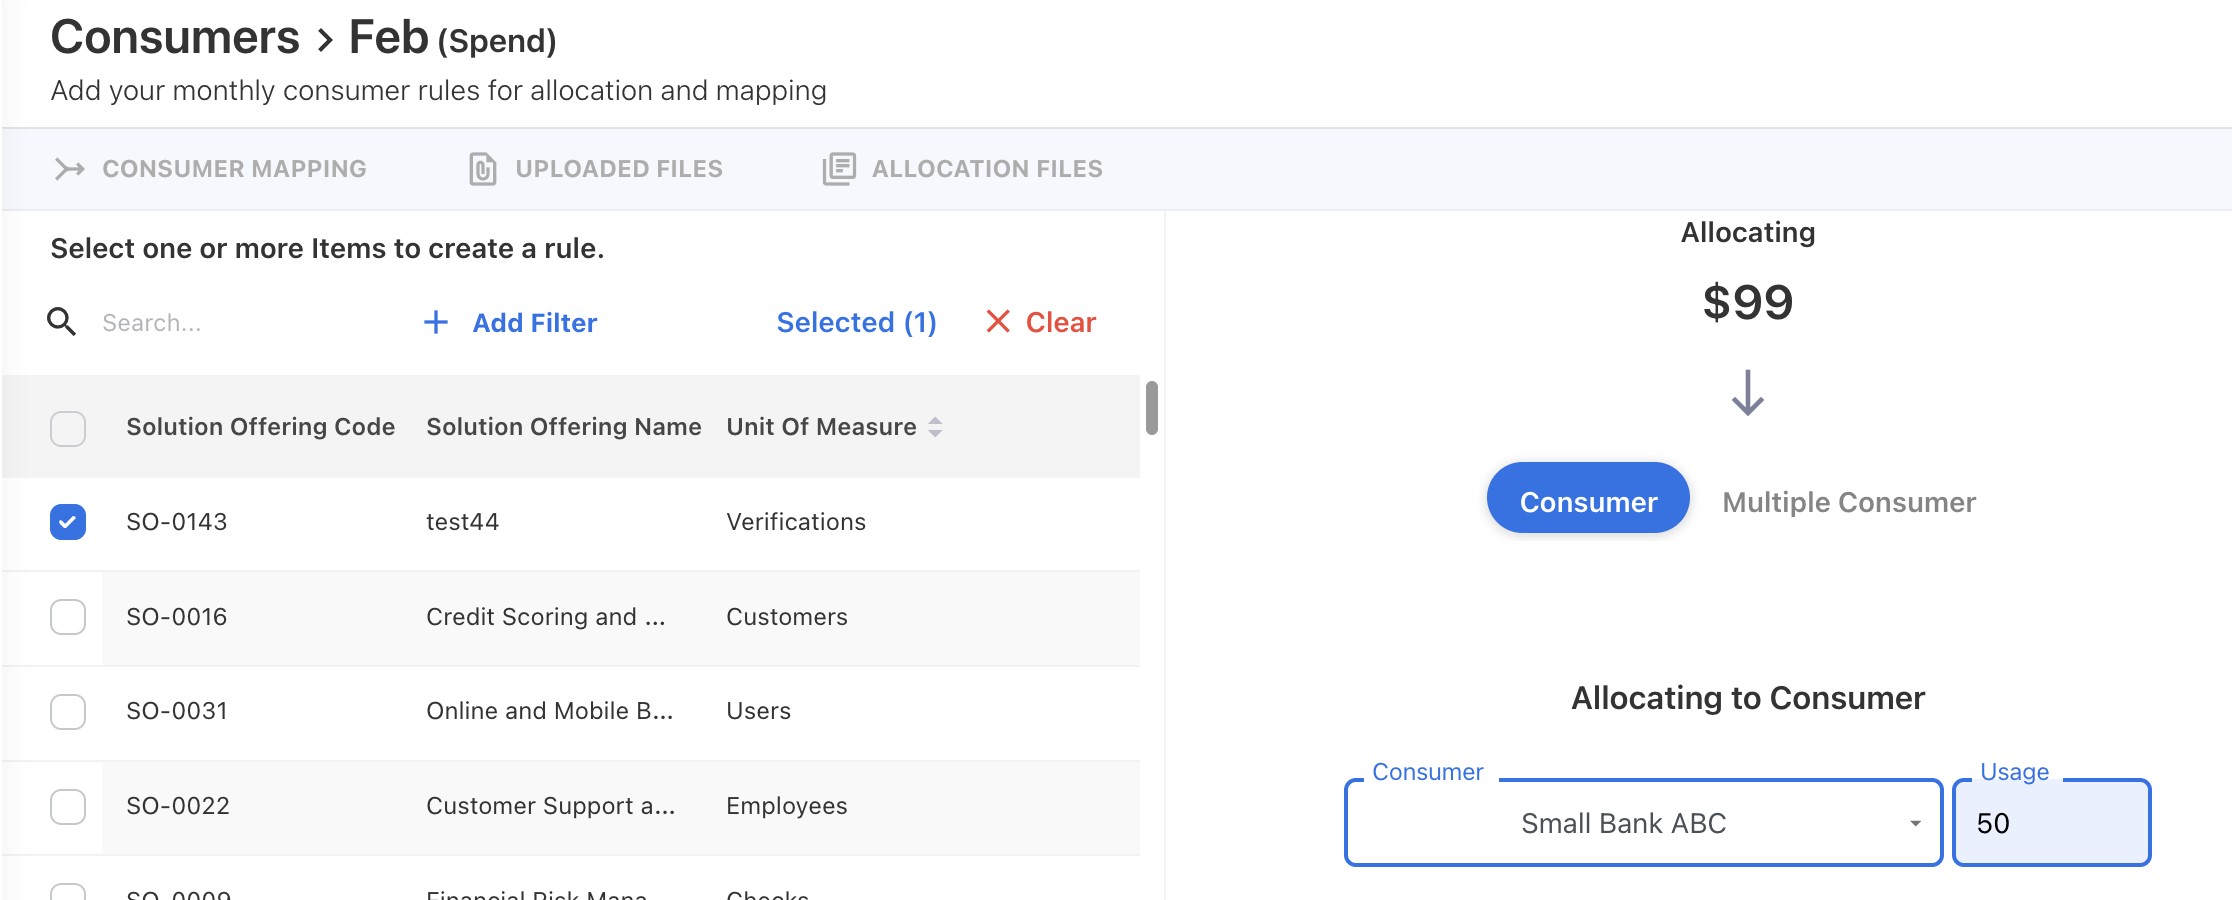
How Consumer allocation works
When a Solution Offering is mapped to multiple Consumers:
-
Each Consumer receives a Usage value.
-
The sum of all Consumer Usage values equals Total Usage.
-
Unit Spend is calculated once for the Solution Offering.
-
Consumer Spend is calculated based on the Consumer's allocated Usage.
Common reporting scenarios
Analyze spend by Consumer
Drag:
-
Consumer
-
Consumer Spend
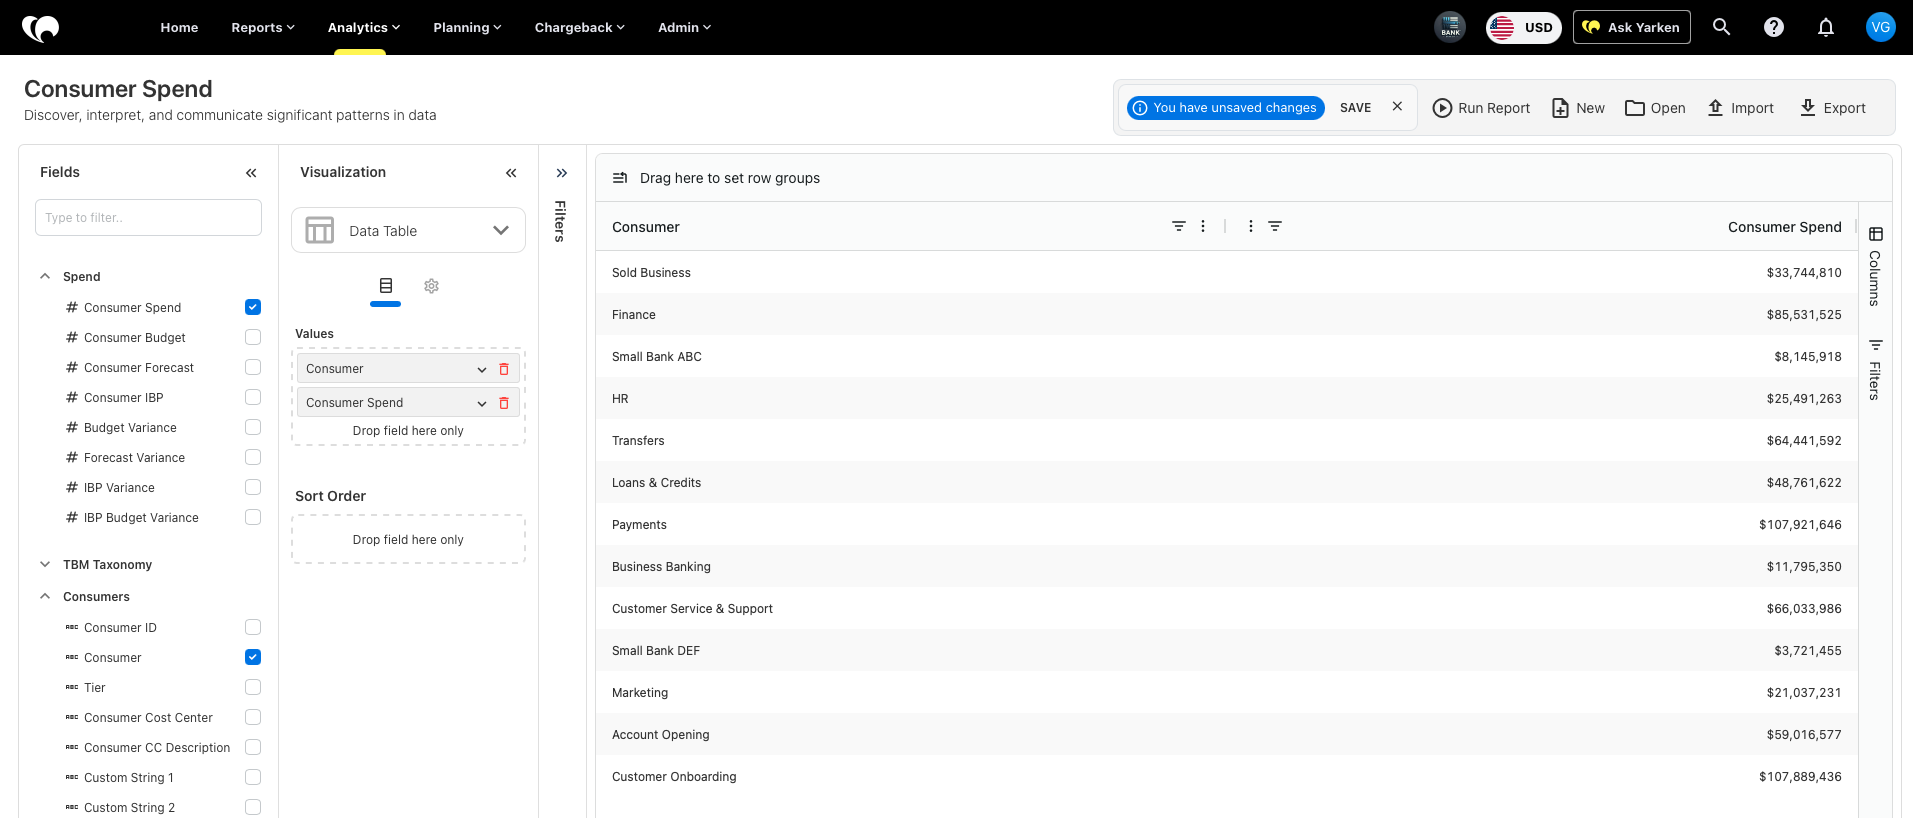
This helps identify the highest-cost consumers.
Analyze spend by Solution Offering
Drag:
-
Solution Offering
-
Consumer Spend
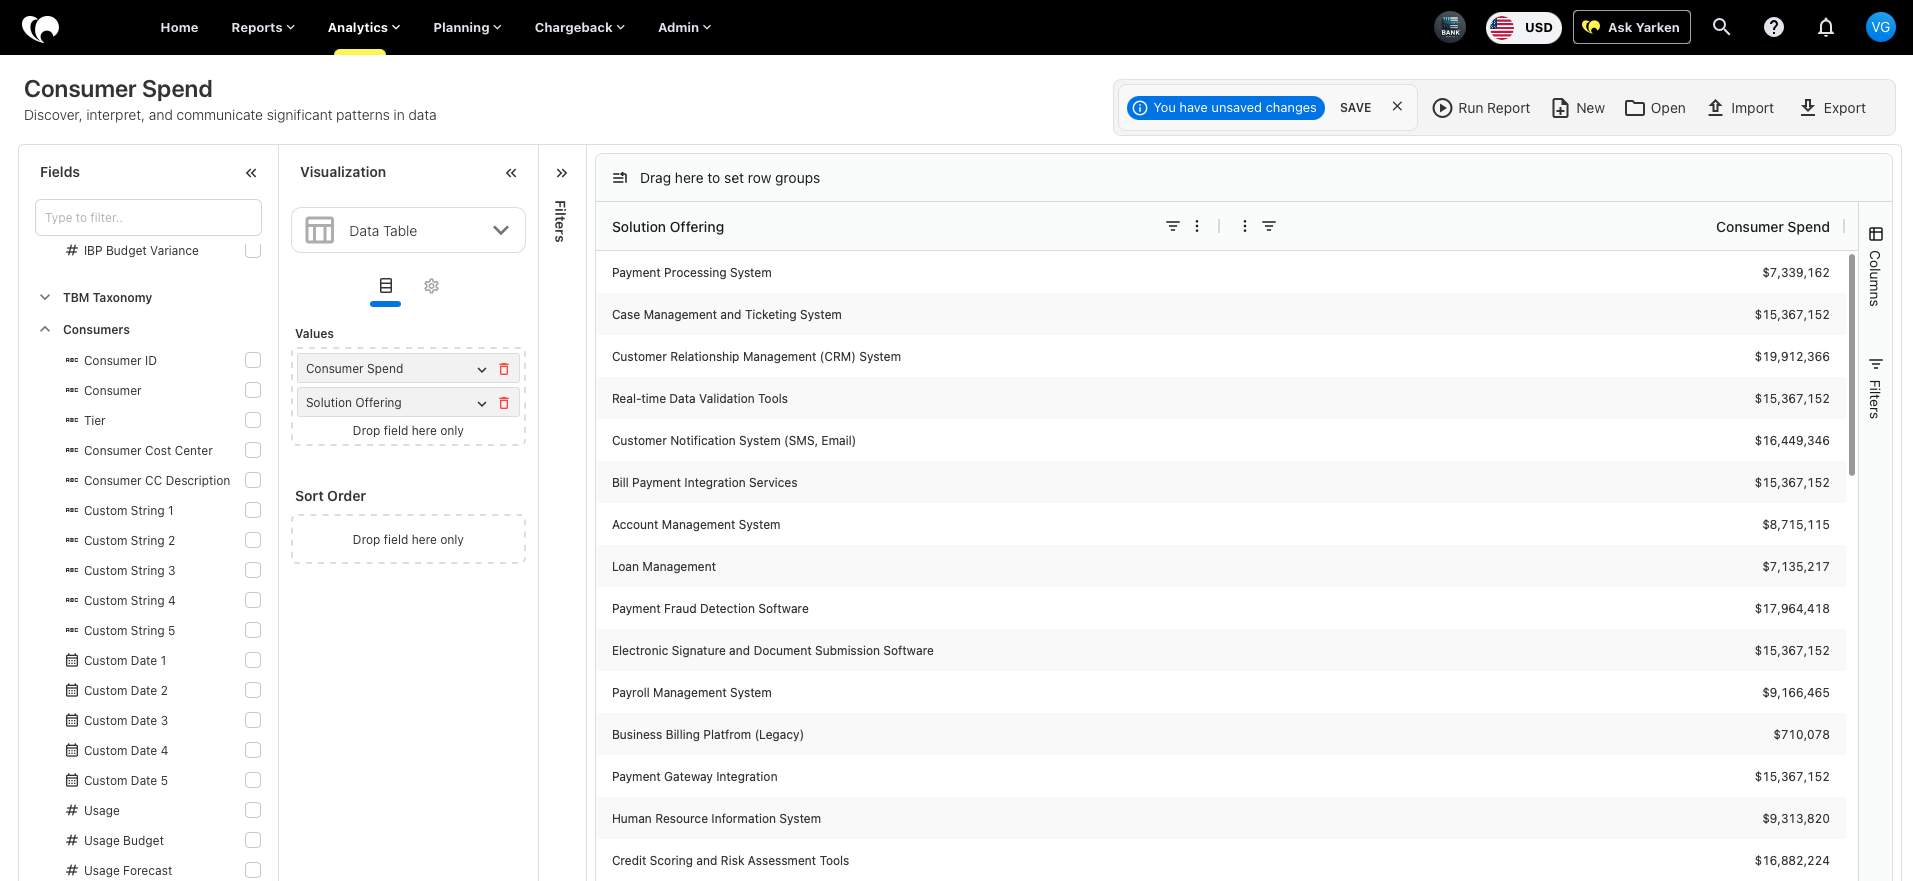
This shows which services generate the highest consumer costs.
Analyze usage-based allocations
Drag:
-
Consumer
-
Usage
-
Unit Spend
-
Consumer Spend
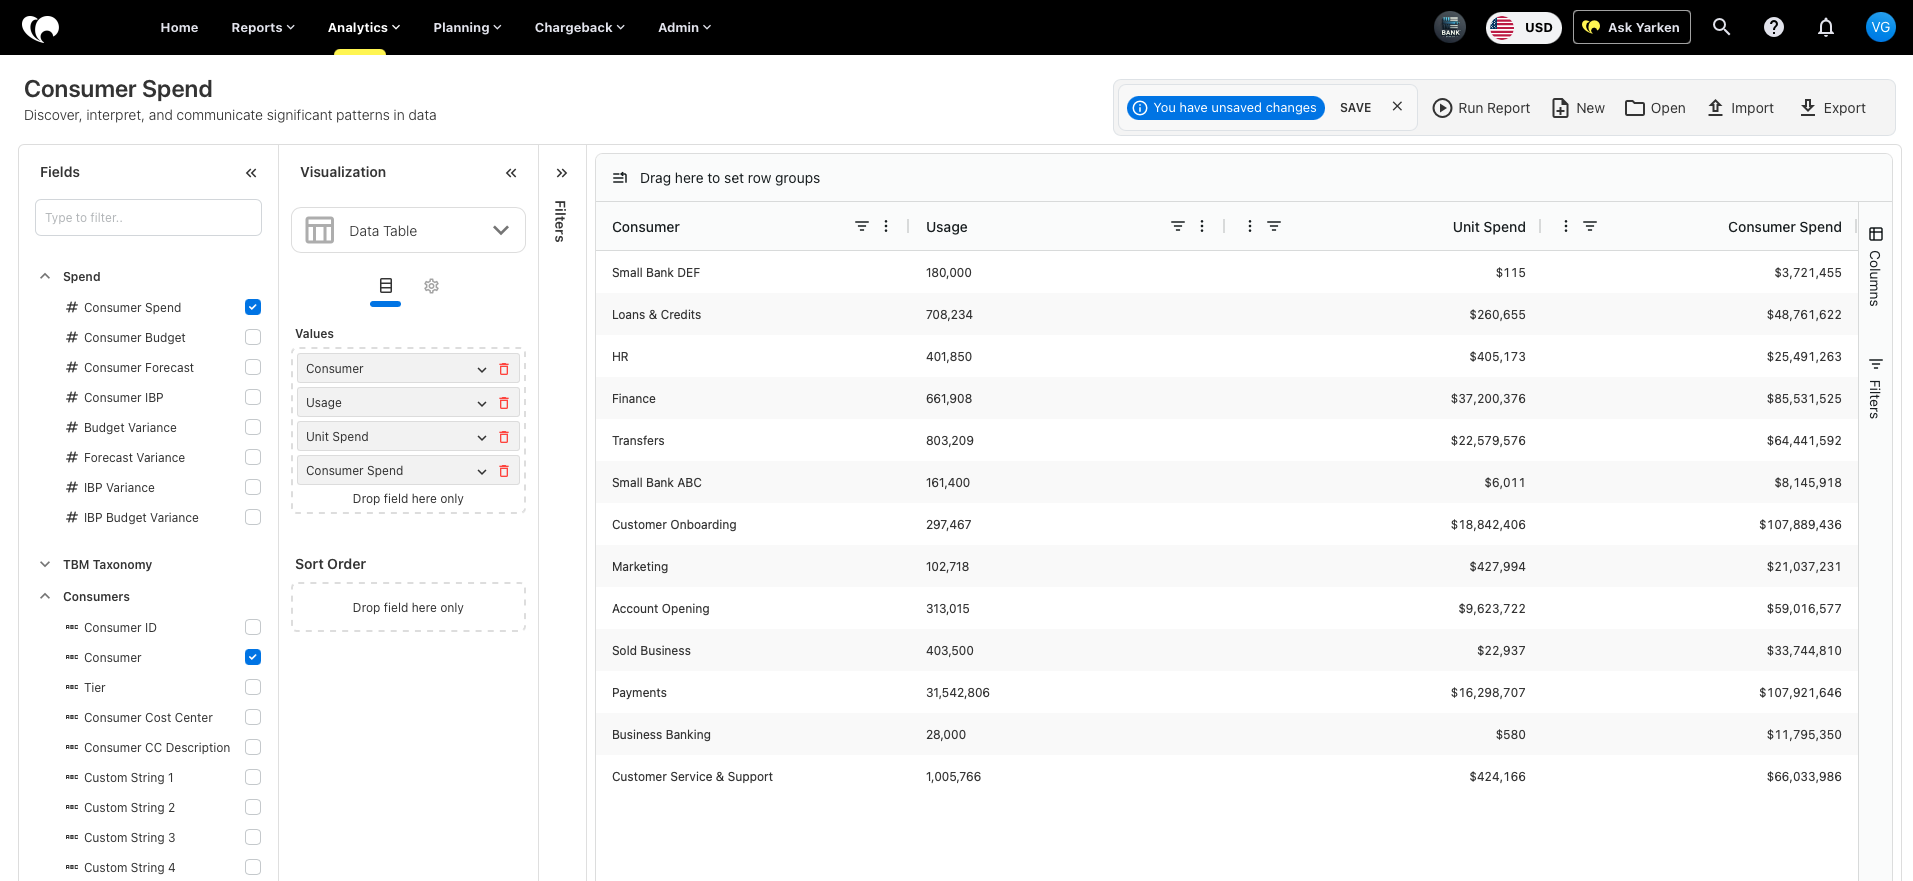
This helps validate usage-based allocation models.
Related content