
The Budget Details and Forecast Details pages include calculated columns that help you compare the latest planning values with baseline and previous planning values.
These columns are automatically populated by the application after budget or forecast data is added, imported, or loaded from Cost Transparency.
The calculated columns help you understand:
-
The latest total value for the budget or forecast item.
-
How the latest value compares with the baseline.
-
How the latest value compares with the previous forecast or previous planning value.
-
Whether the current value has increased or decreased.
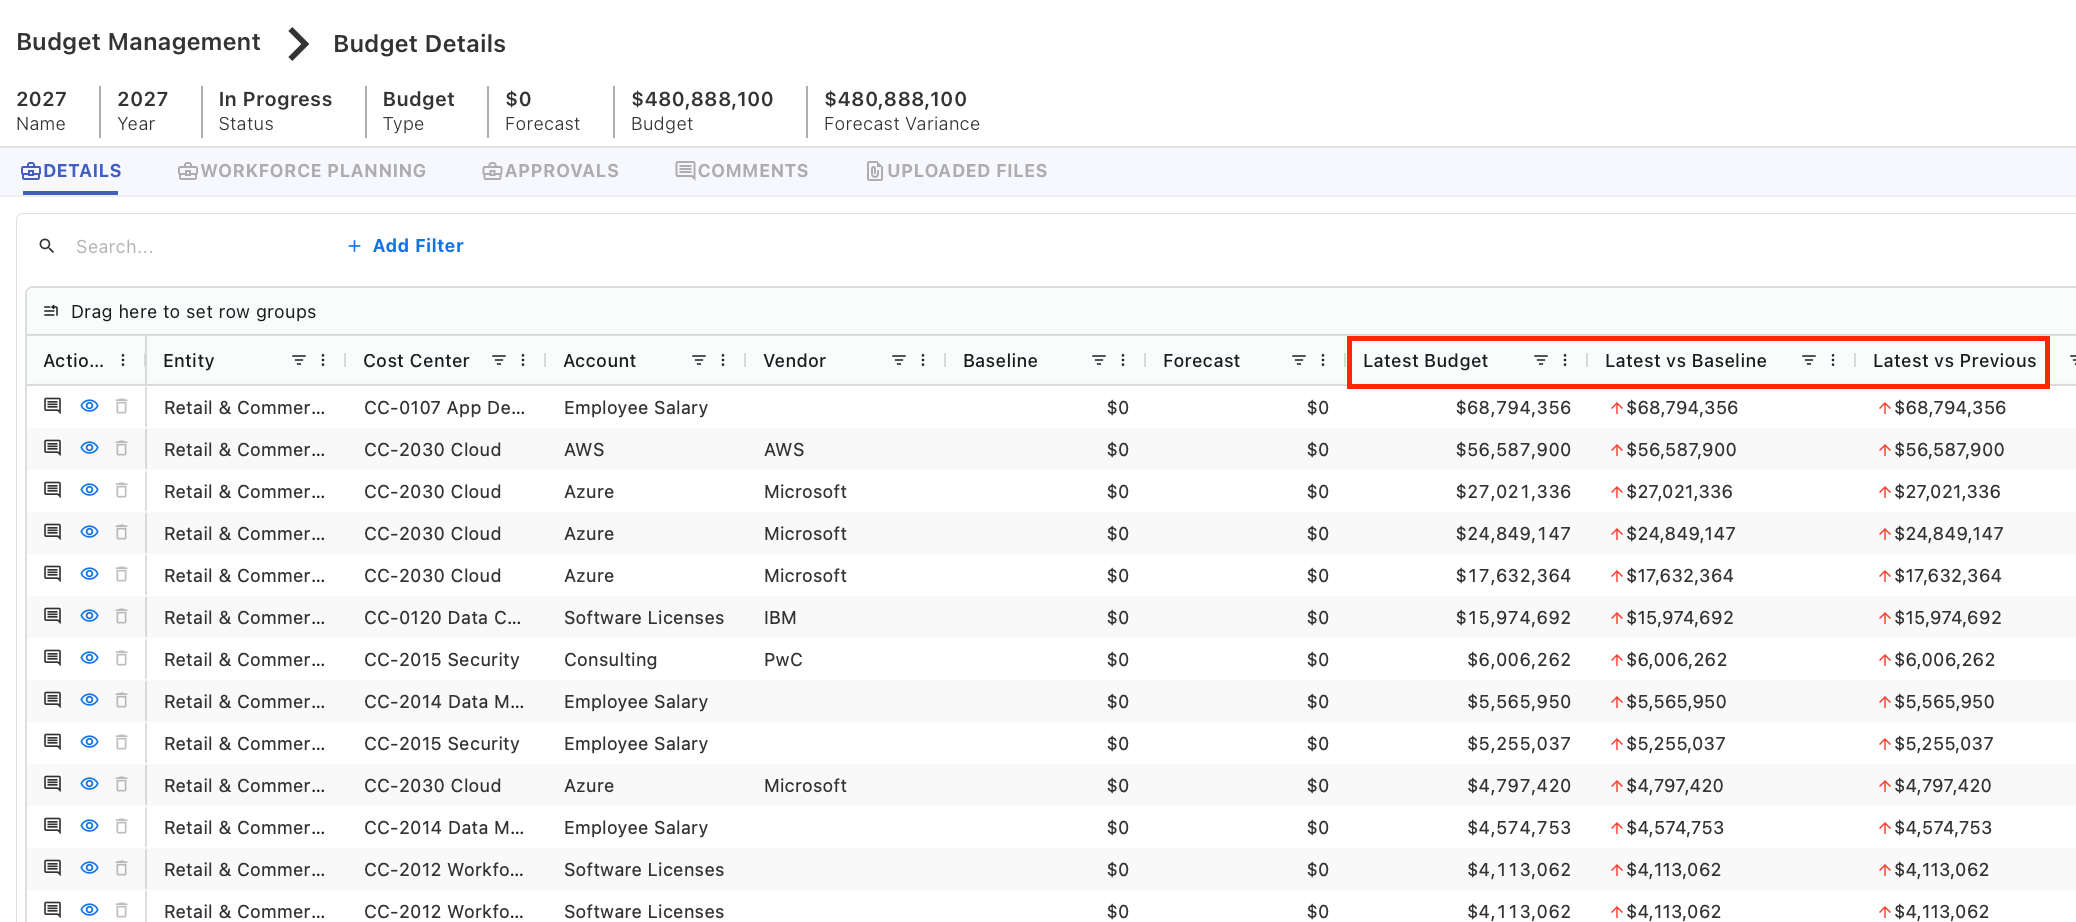
Where these columns appear
These columns appear in the grid on the Budget Details or Forecast Details page.
For example, on the Budget Details page, you may see columns such as:
-
Latest Budget
-
Latest vs Baseline
-
Latest vs Previous
The exact column names may vary depending on whether you are viewing a budget or forecast.
How the values are calculated
The application calculates these values from the monthly planning entries available for the selected budget or forecast item.
For example, if values are entered from January through December, the application sums the monthly values and displays the total in the latest budget or forecast column.
If baseline or previous planning values are available, the application compares the current latest value against those values.
Budget calculated columns
The following columns are commonly available on the Budget Details page.
|
Column name |
Description |
|---|---|
|
Group |
Shows how the budget table is organized. You can group budget or forecast data using different fields (for example, Cost Center, Account, or Vendor).
|
|
Account |
Displays the account name linked to each budget item. |
|
Vendor |
Shows the vendor name associated with the budget item. |
|
Assumption |
Used to capture any assumptions made while creating or adjusting the budget item (for example, expected usage changes or contract assumptions). |
|
Notes |
Used to add additional comments or explanations related to the budget item. |
|
Baseline |
Represents the previous year’s budget when data is loaded from Cost Transparency (CT), allowing you to compare current budget with last year’s budget.
|
|
Forecast |
Represents the previous year’s forecast when data is pulled from CT, allowing you to compare the current budget with the previous forecast.
|
|
Latest Budget |
The total budget amount for the current forecast, calculated by summing the values from January through December that you have entered or updated. |
|
Latest vs Baseline |
Shows how the current budget compares to the baseline.
Calculation: Latest Budget − Baseline |
|
Latest vs Previous |
Shows how the current budget compares to the previous forecast.
Calculation: Latest Budget − Forecast |
|
Expense Type |
Indicates whether the budget item is classified as: CapEx (Capital Expenditure), or OpEx (Operational Expenditure) |
Forecast calculated columns
The following columns are commonly available on the Forecast Details page.
|
Column name |
Description |
|---|---|
|
Group |
Shows how the forecast table is organized. You can group forecast data using different fields (for example, Cost Center, Account, or Vendor).
|
|
Account |
Displays the account name linked to each forecast item. |
|
Vendor |
Shows the vendor name associated with the forecast item. |
|
Assumption |
Used to capture any assumptions made while creating or adjusting the forecast item (for example, expected usage changes or contract assumptions). |
|
Notes |
Used to add additional comments or explanations related to the forecast item. |
|
Baseline |
|
|
Previous Forecast |
Displays the previous forecast amount used for comparison.
|
|
YTD Spend |
Shows the Year-to-Date spend, calculated as the sum of CT spend for locked months.
|
|
Remaining Forecast |
Represents the portion of the previous forecast that is remaining after accounting for YTD spend. Calculation: Previous Forecast − YTD Spend |
|
Latest Forecast |
The total forecast amount for the current cycle, calculated as the sum of the January through December values that you have updated. |
|
Latest vs Baseline |
Shows how the current forecast compares to the baseline.
Calculation: Latest Forecast − Baseline |
|
Latest vs Previous |
Shows how the latest forecast compares to the previous forecast.
Calculation: Latest Forecast − Previous Forecast |
Related content