
Use this article to understand how Workforce Planning works in practical employee and vendor planning scenarios.
Scenario overview
The examples below show how Yarken converts workforce planning inputs into financial outputs.
Each example follows the same logic:
-
Admin configures the role and rate.
-
Admin maps the role to financial accounts.
-
Budget Process Owner creates a workforce entry.
-
User enters monthly headcount.
-
Yarken calculates cost.
-
Yarken distributes cost to accounts.
-
Budget or forecast values are generated automatically.
Configuration setup for examples
The examples assume the required roles and account mappings already exist.
Vendor role setup
|
Field |
Example value |
|---|---|
|
Role |
Senior Software Developer |
|
Workforce type |
Vendor |
|
Annual base compensation |
1,100,000 |
|
Vendor |
IBM |
|
Cost Center |
Cloud Center of Excellence (CC-0106) |
|
Entity |
Default |
|
Expense Type |
CapEx |
Vendor account distribution
|
Account |
Distribution |
|---|---|
|
Software Licenses |
10% |
|
Hardware Depreciation |
10% |
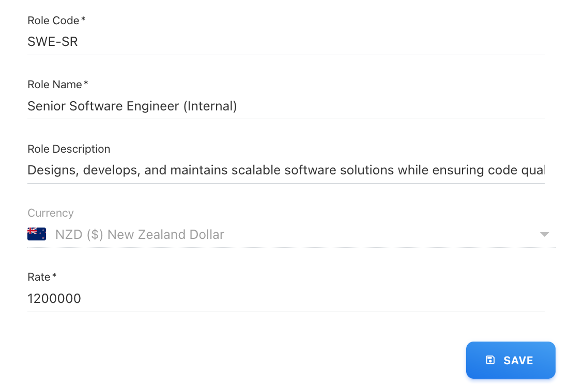
Employee role setup
|
Field |
Example value |
|---|---|
|
Role |
Senior Software Developer - India |
|
Workforce type |
Employee |
|
Annual base compensation |
1,200,000 |
|
Employee |
Aiden |
|
Cost Center |
Workforce Enablement (CC-2012) |
|
Entity |
Default |
|
Expense Type |
OpEx |
Employee account distribution
|
Account |
Distribution |
|---|---|
|
Software Licenses |
10% |
Vendor Workforce Planning example
This example shows how to plan vendor resources for a project.
Workforce entry
The Budget Process Owner creates a workforce entry with the following values:
|
Field |
Value |
|---|---|
|
Role |
Senior Software Developer |
|
Vendor |
IBM |
|
Cost Center |
Cloud Center of Excellence (CC-0106) |
|
Entity |
Default |
|
Expense Type |
CapEx |
|
Annual base compensation |
1,100,000 |
Monthly headcount
|
Month |
Headcount |
|---|---|
|
January |
2 |
|
February |
2 |
|
March |
4 |
Total headcount volume = 2 + 2 + 4 = 8
Cost calculation
Annual base compensation = 1,100,000
Monthly cost = 1,100,000 ÷ 12 = 91,666.67
Total expense = 91,666.67 × 8 = 733,333.36
Rounded total expense = 733,333
Budget distribution
|
Account |
Distribution |
Generated amount |
|---|---|---|
|
Software Licenses |
10% |
73,333 |
|
Hardware Depreciation |
10% |
73,333 |
These values are generated as budget or forecast entries based on the configured account mapping.
Monthly budget calculation
|
Month |
Headcount |
Monthly cost per headcount |
Monthly total |
|---|---|---|---|
|
January |
2 |
91,666.67 |
183,333.34 |
|
February |
2 |
91,666.67 |
183,333.34 |
|
March |
4 |
91,666.67 |
366,666.68 |
|
Total |
8 |
|
733,333.36 |
Employee Workforce Planning example
This example shows how to plan an internal employee.
Workforce entry
The Budget Process Owner creates a workforce entry with the following values:
|
Field |
Value |
|---|---|
|
Role |
Senior Software Developer - India |
|
Employee |
Aiden |
|
Cost Center |
Workforce Enablement (CC-2012) |
|
Entity |
Default |
|
Expense Type |
OpEx |
|
Annual base compensation |
1,200,000 |
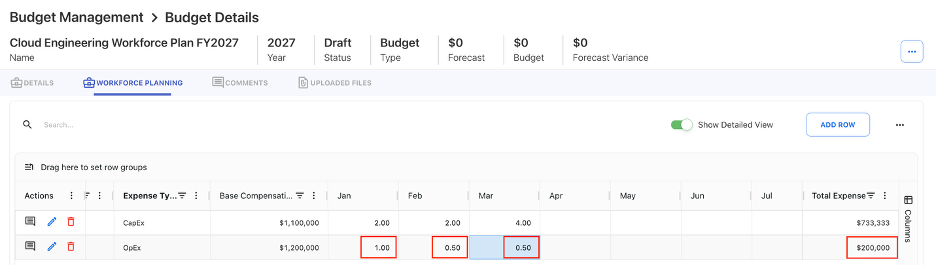
Monthly headcount
|
Month |
Headcount |
|---|---|
|
January |
1 |
|
February |
0.5 |
|
March |
0.5 |
Total headcount volume = 1 + 0.5 + 0.5 = 2
Cost calculation
Annual base compensation = 1,200,000
Monthly cost = 1,200,000 ÷ 12 = 100,000
Total expense = 100,000 × 2 = 200,000
Budget distribution
|
Account |
Distribution |
Generated amount |
|---|---|---|
|
Software Licenses |
10% |
20,000 |
Monthly budget calculation
|
Month |
Headcount |
Monthly cost per headcount |
Monthly total |
|---|---|---|---|
|
January |
1 |
100,000 |
100,000 |
|
February |
0.5 |
50,000 |
50,000 |
|
March |
0.5 |
50,000 |
50,000 |
|
Total |
2 |
|
200,000 |
Key difference between vendor and employee planning
|
Area |
Employee planning |
Vendor planning |
|---|---|---|
|
Resource type |
Internal employee |
External resource or vendor team |
|
Monthly headcount limit |
Maximum 1 per employee per month |
Multiple resources can be planned |
|
Common use case |
Named employee allocation |
Contractor or project team ramp-up |
|
Example |
0.5, 1 |
2, 4, 6 |
Next step
Workforce Planning concepts and terminology
Related articles
Create and manage Workforce Plans
Workforce Planning cost calculations