
Overview
Joins define how data from multiple queries is related within a Multi Cube report. After creating two or more queries, you must configure joins to determine how records from each query are combined into a single dataset.
A join uses one or more common fields, known as join keys, to identify matching records between queries. The resulting dataset is then used to build reports and visualizations.
Without joins, each query remains independent and cannot be analyzed together.
Example used in this guide
This page continues the example introduced in Create a Multi Cube report.
The report combines the following Analytics cubes:
|
Query |
Analytics cube |
|---|---|
|
Q1 |
Expenses |
|
Q2 |
Consumer Expenses |
The objective is to associate expense data with consumer expense information for the same reporting period.
Understand join requirements
Before configuring a join, identify the fields that exist in both queries.
For this scenario:
|
Expenses (Q1) |
Consumer Expenses (Q2) |
|---|---|
|
Year |
Year |
|
Month |
Month |
|
Spend |
Spend |
|
— |
Consumer |
|
— |
Consumer ID |
Notice that Year and Month exist in both queries and can therefore be used as join keys.
Why Year and Month are used in example
Although the Consumer Expenses cube contains Consumer ID, the Expenses cube does not.
Therefore, the two datasets cannot be joined using Consumer ID.
Instead, the common reporting dimensions are used:
-
Year
-
Month
This ensures that records are matched for the same reporting period.
Understand join types
Choose the join type that best matches your reporting requirements.
|
Join type |
Description |
Typical use case |
|---|---|---|
|
Inner |
Returns only records that exist in both queries. |
Compare data that is available in both datasets. |
|
Left |
Returns all records from the From Query and matching records from the To Query. |
Keep all records from the primary dataset. |
|
Right |
Returns all records from the To Query and matching records from the From Query. |
Keep all records from the secondary dataset. |
|
Outer |
Returns all records from both queries, including unmatched records. |
Create a complete view across both datasets. |
Which join type should I use?
For the Expenses and Consumer Expenses example:
-
Use Left when you want to display every expense record, even if no matching consumer expense exists.
-
Use Inner when you want to display only reporting periods that exist in both cubes.
-
Use Right when consumer expense records are the primary dataset.
-
Use Outer when you need to identify records that exist in only one cube.
Create the join
-
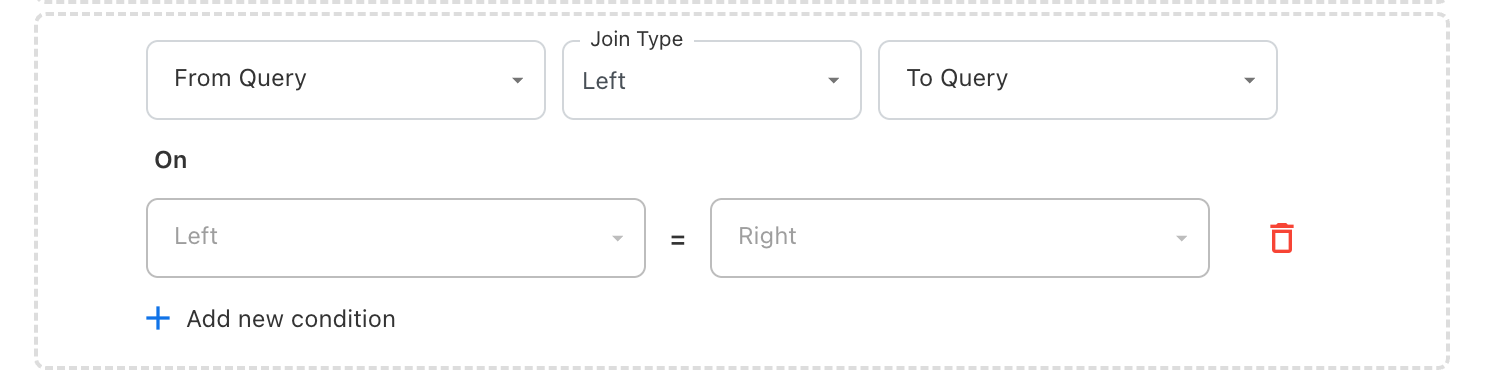
Under Joins, click Add new join.
-
Set From Query to Q1.
-
Set To Query to Q2.
-
Select the required Join Type.
Note:
A Left join is typically the most appropriate choice for this scenario because the Expenses cube represents the primary dataset.
-
For the first condition, select:
-
Left:
(Q1) Year -
Right:
(Q2) Year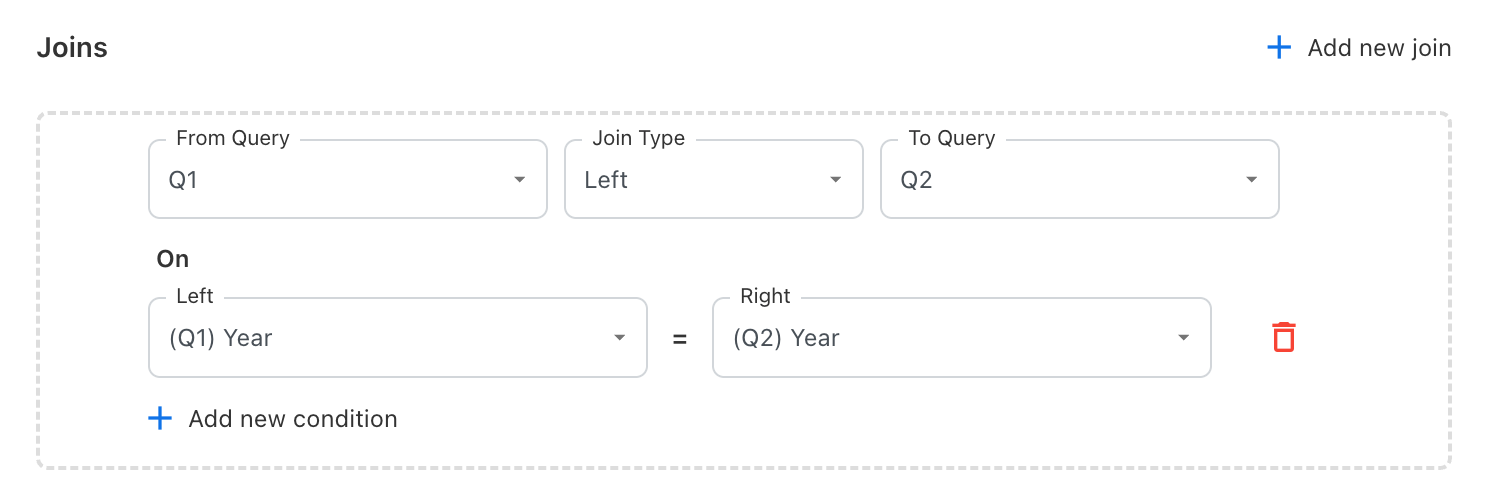
-
-
Click Add new condition.
-
For the second condition, select:
-
Left:
(Q1) Month -
Right:
(Q2) Month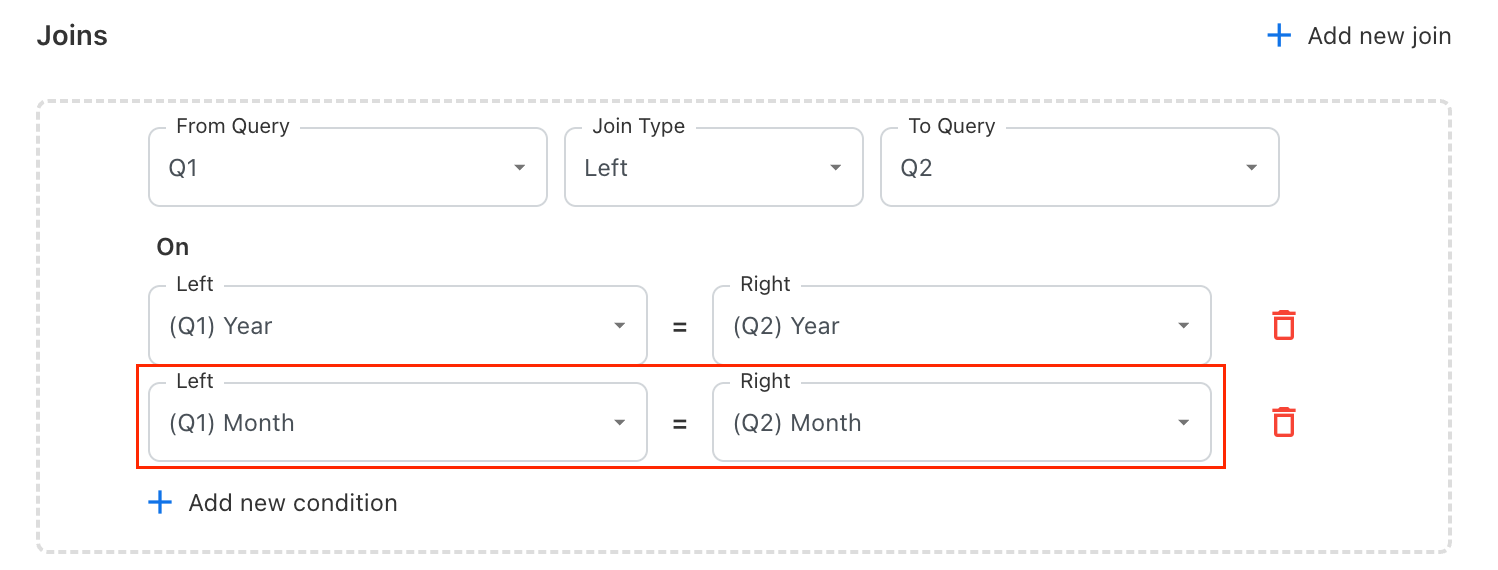
-
The completed join should be:
(Q1) Year = (Q2) Year
AND
(Q1) Month = (Q2) Month
Verify the join
After configuring the join:
-
Confirm that all join conditions are correct.
-
Verify that matching fields use the same data format.
-
Ensure the selected join type matches your reporting requirement.
-
Save the join.
If the report returns unexpected results, review the join conditions before continuing.
Select the output columns
Under Columns, add the fields required in the final report and click SAVE.

For this scenario, select:
-
(Q2) Consumer ID -
(Q2) Consumer -
(Q1) Year -
(Q1) Month -
(Q1) Spend -
(Q2) Spend
You may also include (Q2) Year and (Q2) Month temporarily while validating the join. After confirming that the periods match correctly, remove duplicate period fields if they are not required in the visualization.
Next steps
After creating and validating the joins, you can create Calculated Columns to derive additional business metrics from the combined dataset.
Continue to Create calculated columns.
Related content