
Overview
A Multi Cube report begins by creating one or more queries. Each query retrieves data from an Analytics cube and defines the information that will be available for reporting.
After creating the queries, you select the required columns and configure filters before combining the datasets through joins.
Before you create Multi Cube Analytics
Before creating a Multi Cube report, ensure that the following prerequisites are met:
-
You have identified the dimensions or fields that can be used to relate data between the selected cubes (for example, Year, Month, Cost Centre, or Consumer ID).
-
You know which fields you want to include in the final report and whether any calculated values will be required.
Understand the Multi Cube Analytics workspace
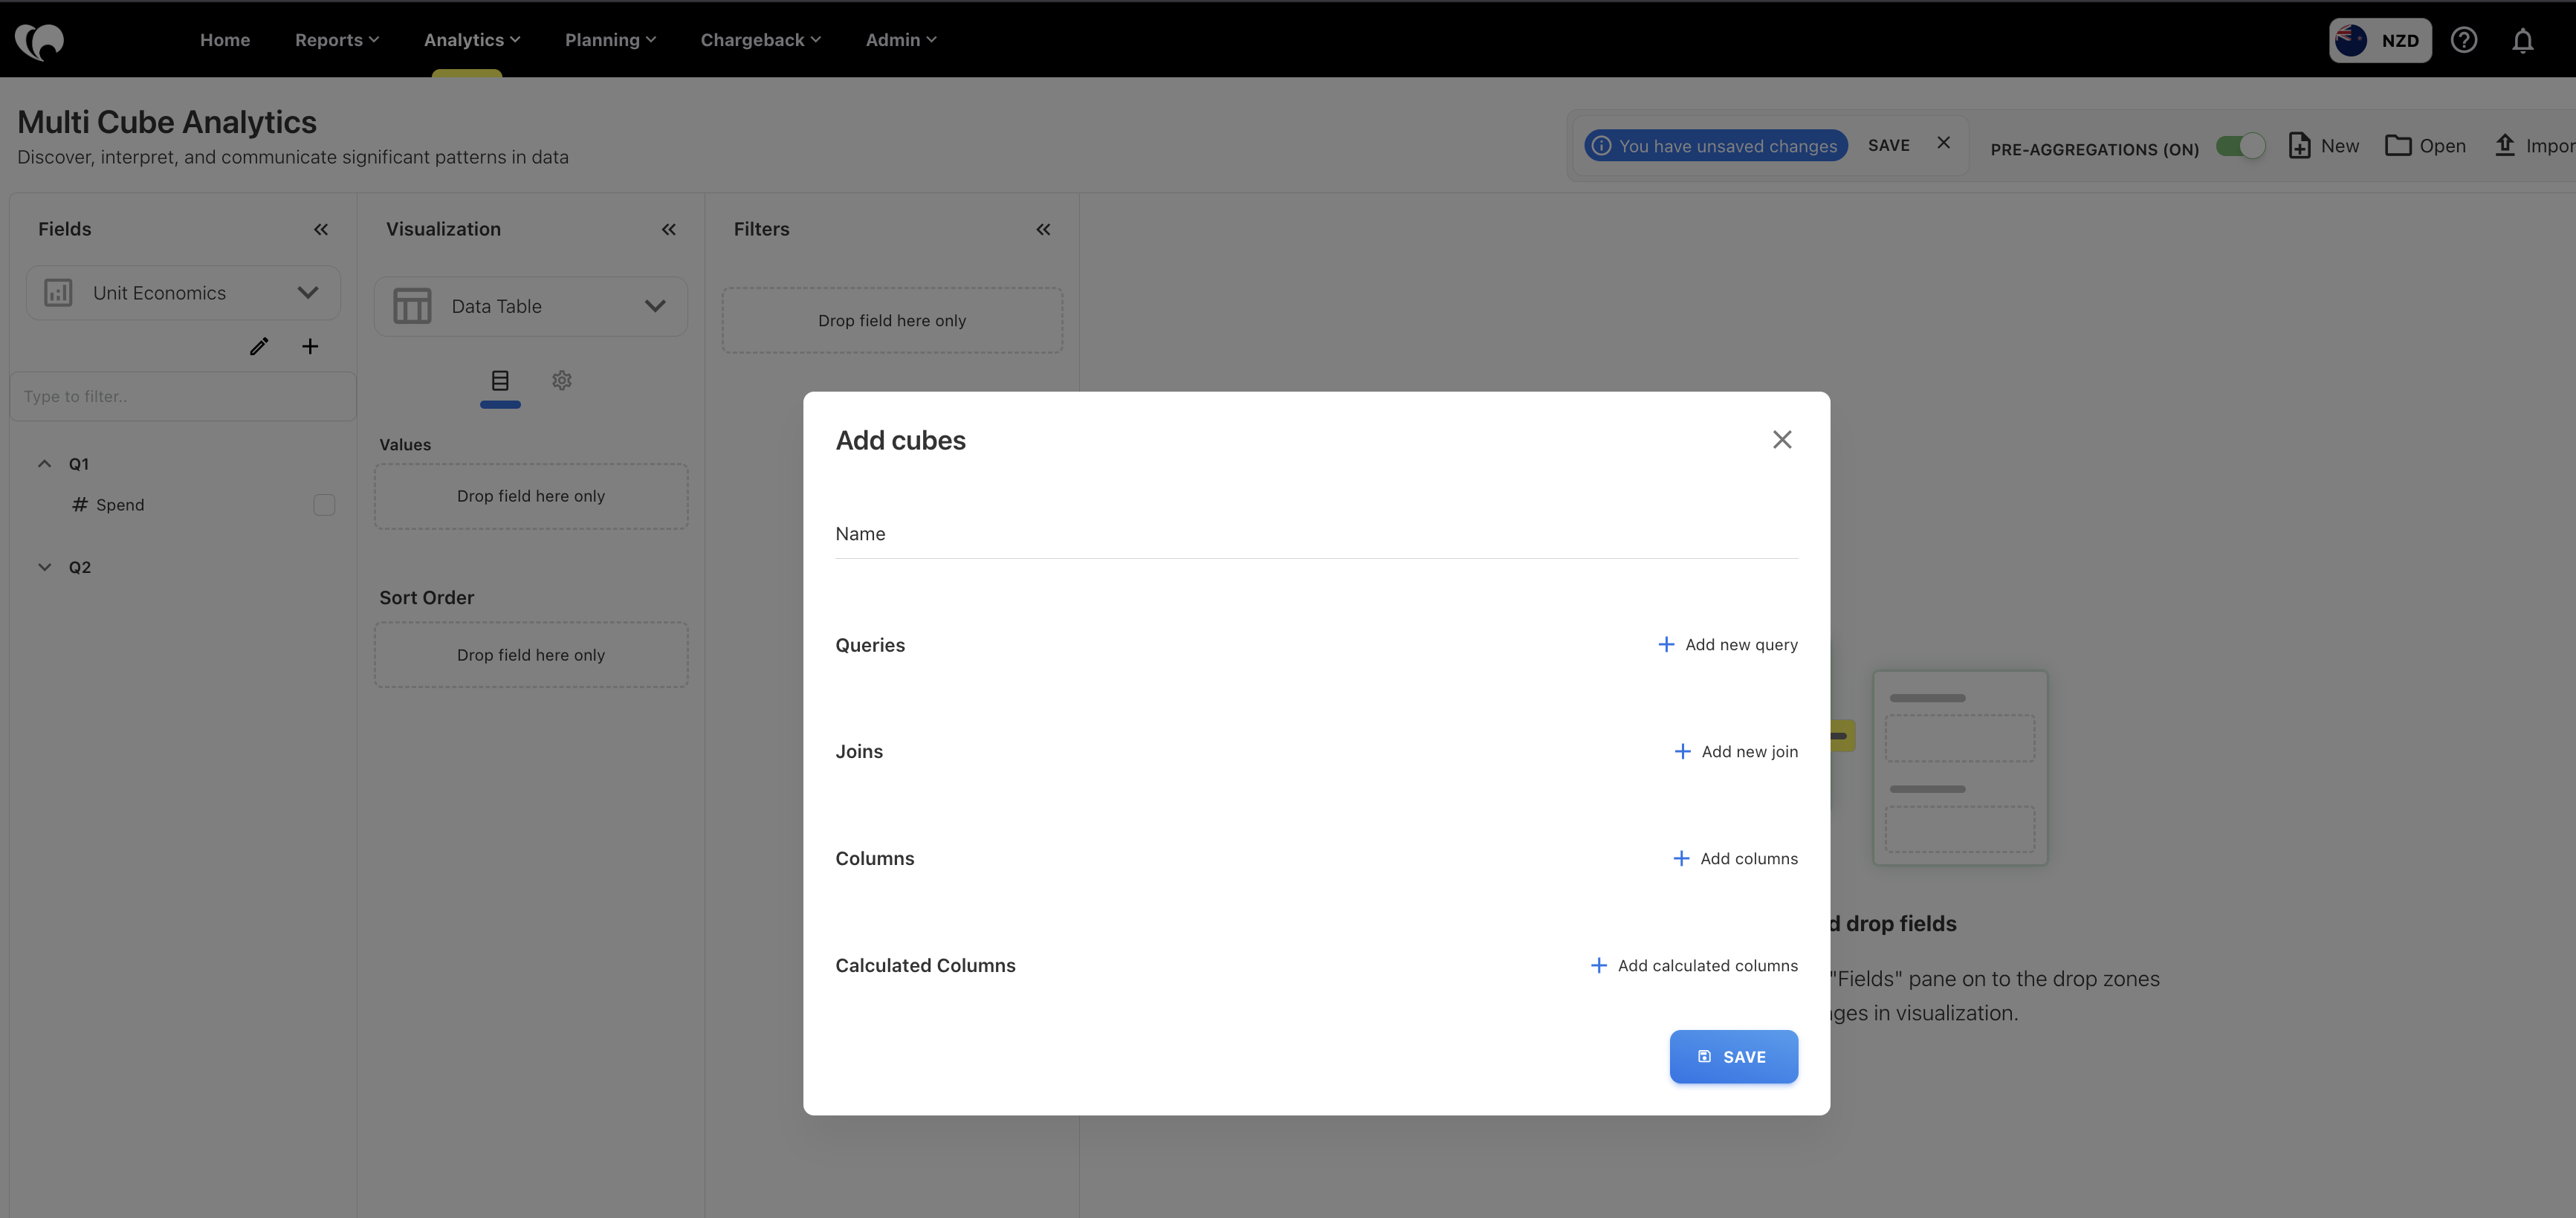
The workspace consists of two main areas.
Report builder
The report builder is where you create the combined dataset. It contains the following sections:
Queries
Queries define which Analytics cubes participate in the report.
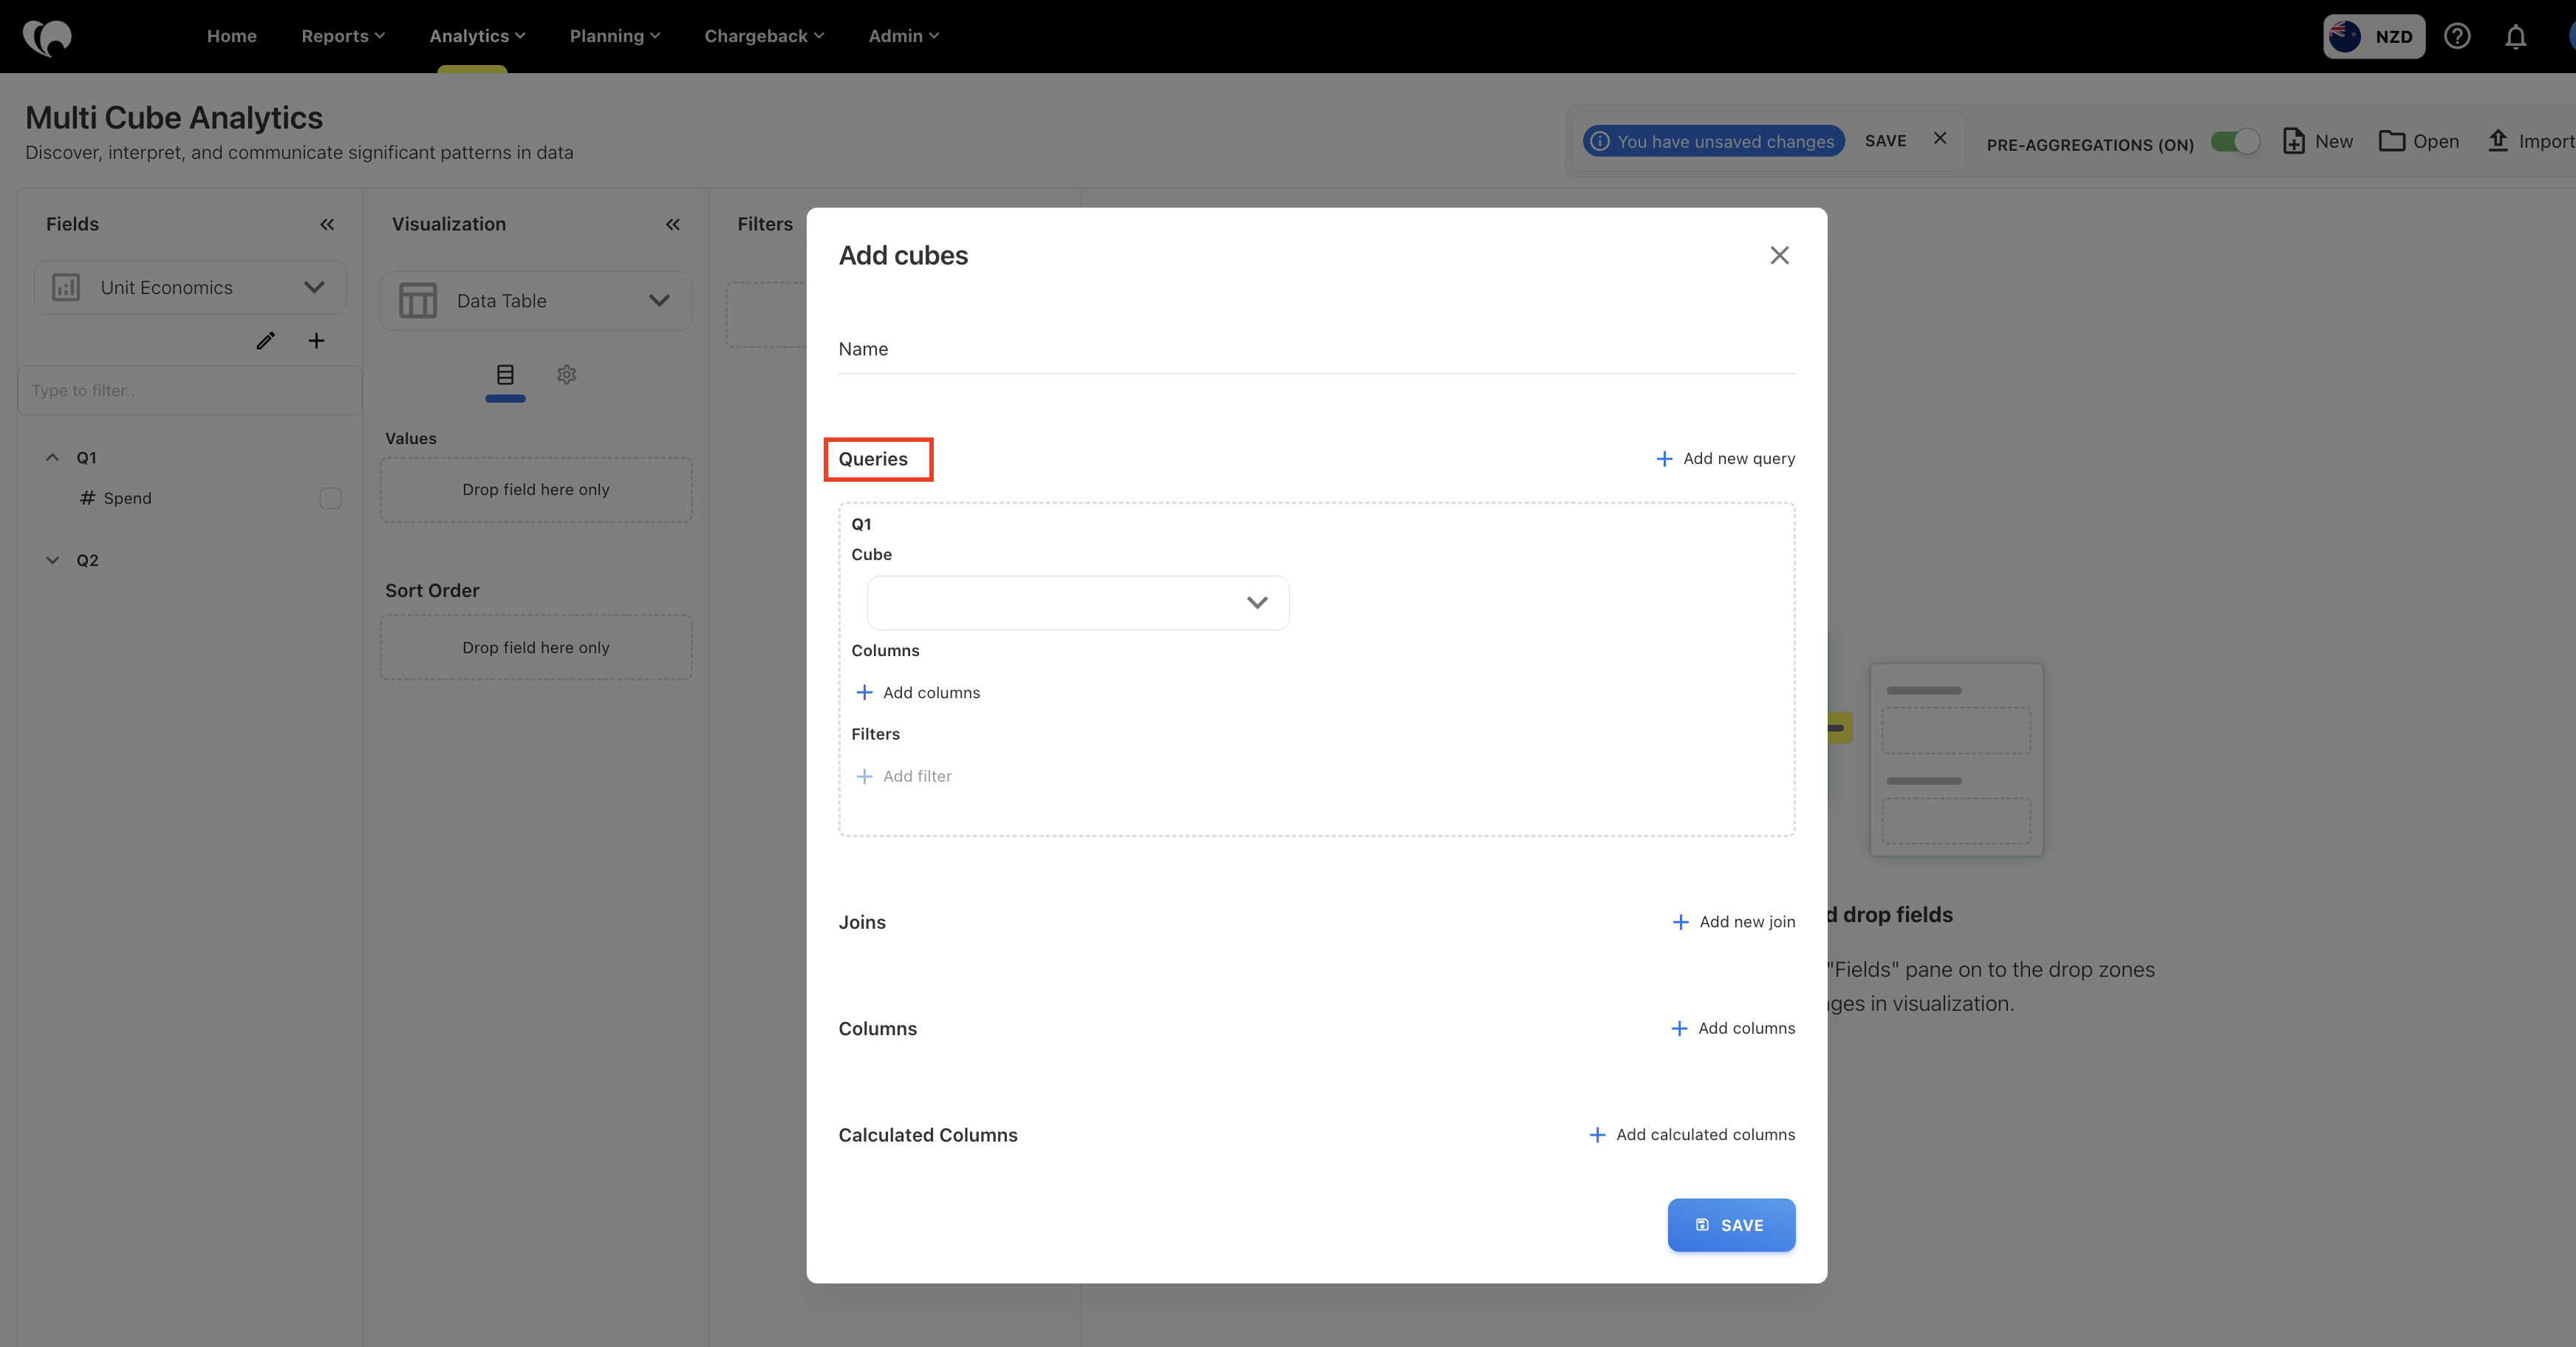
Each query contains:
-
Analytics cube
-
Selected columns
-
Filters
You can add multiple queries to combine data from different cubes.
Joins
Joins define how records from different queries are related.
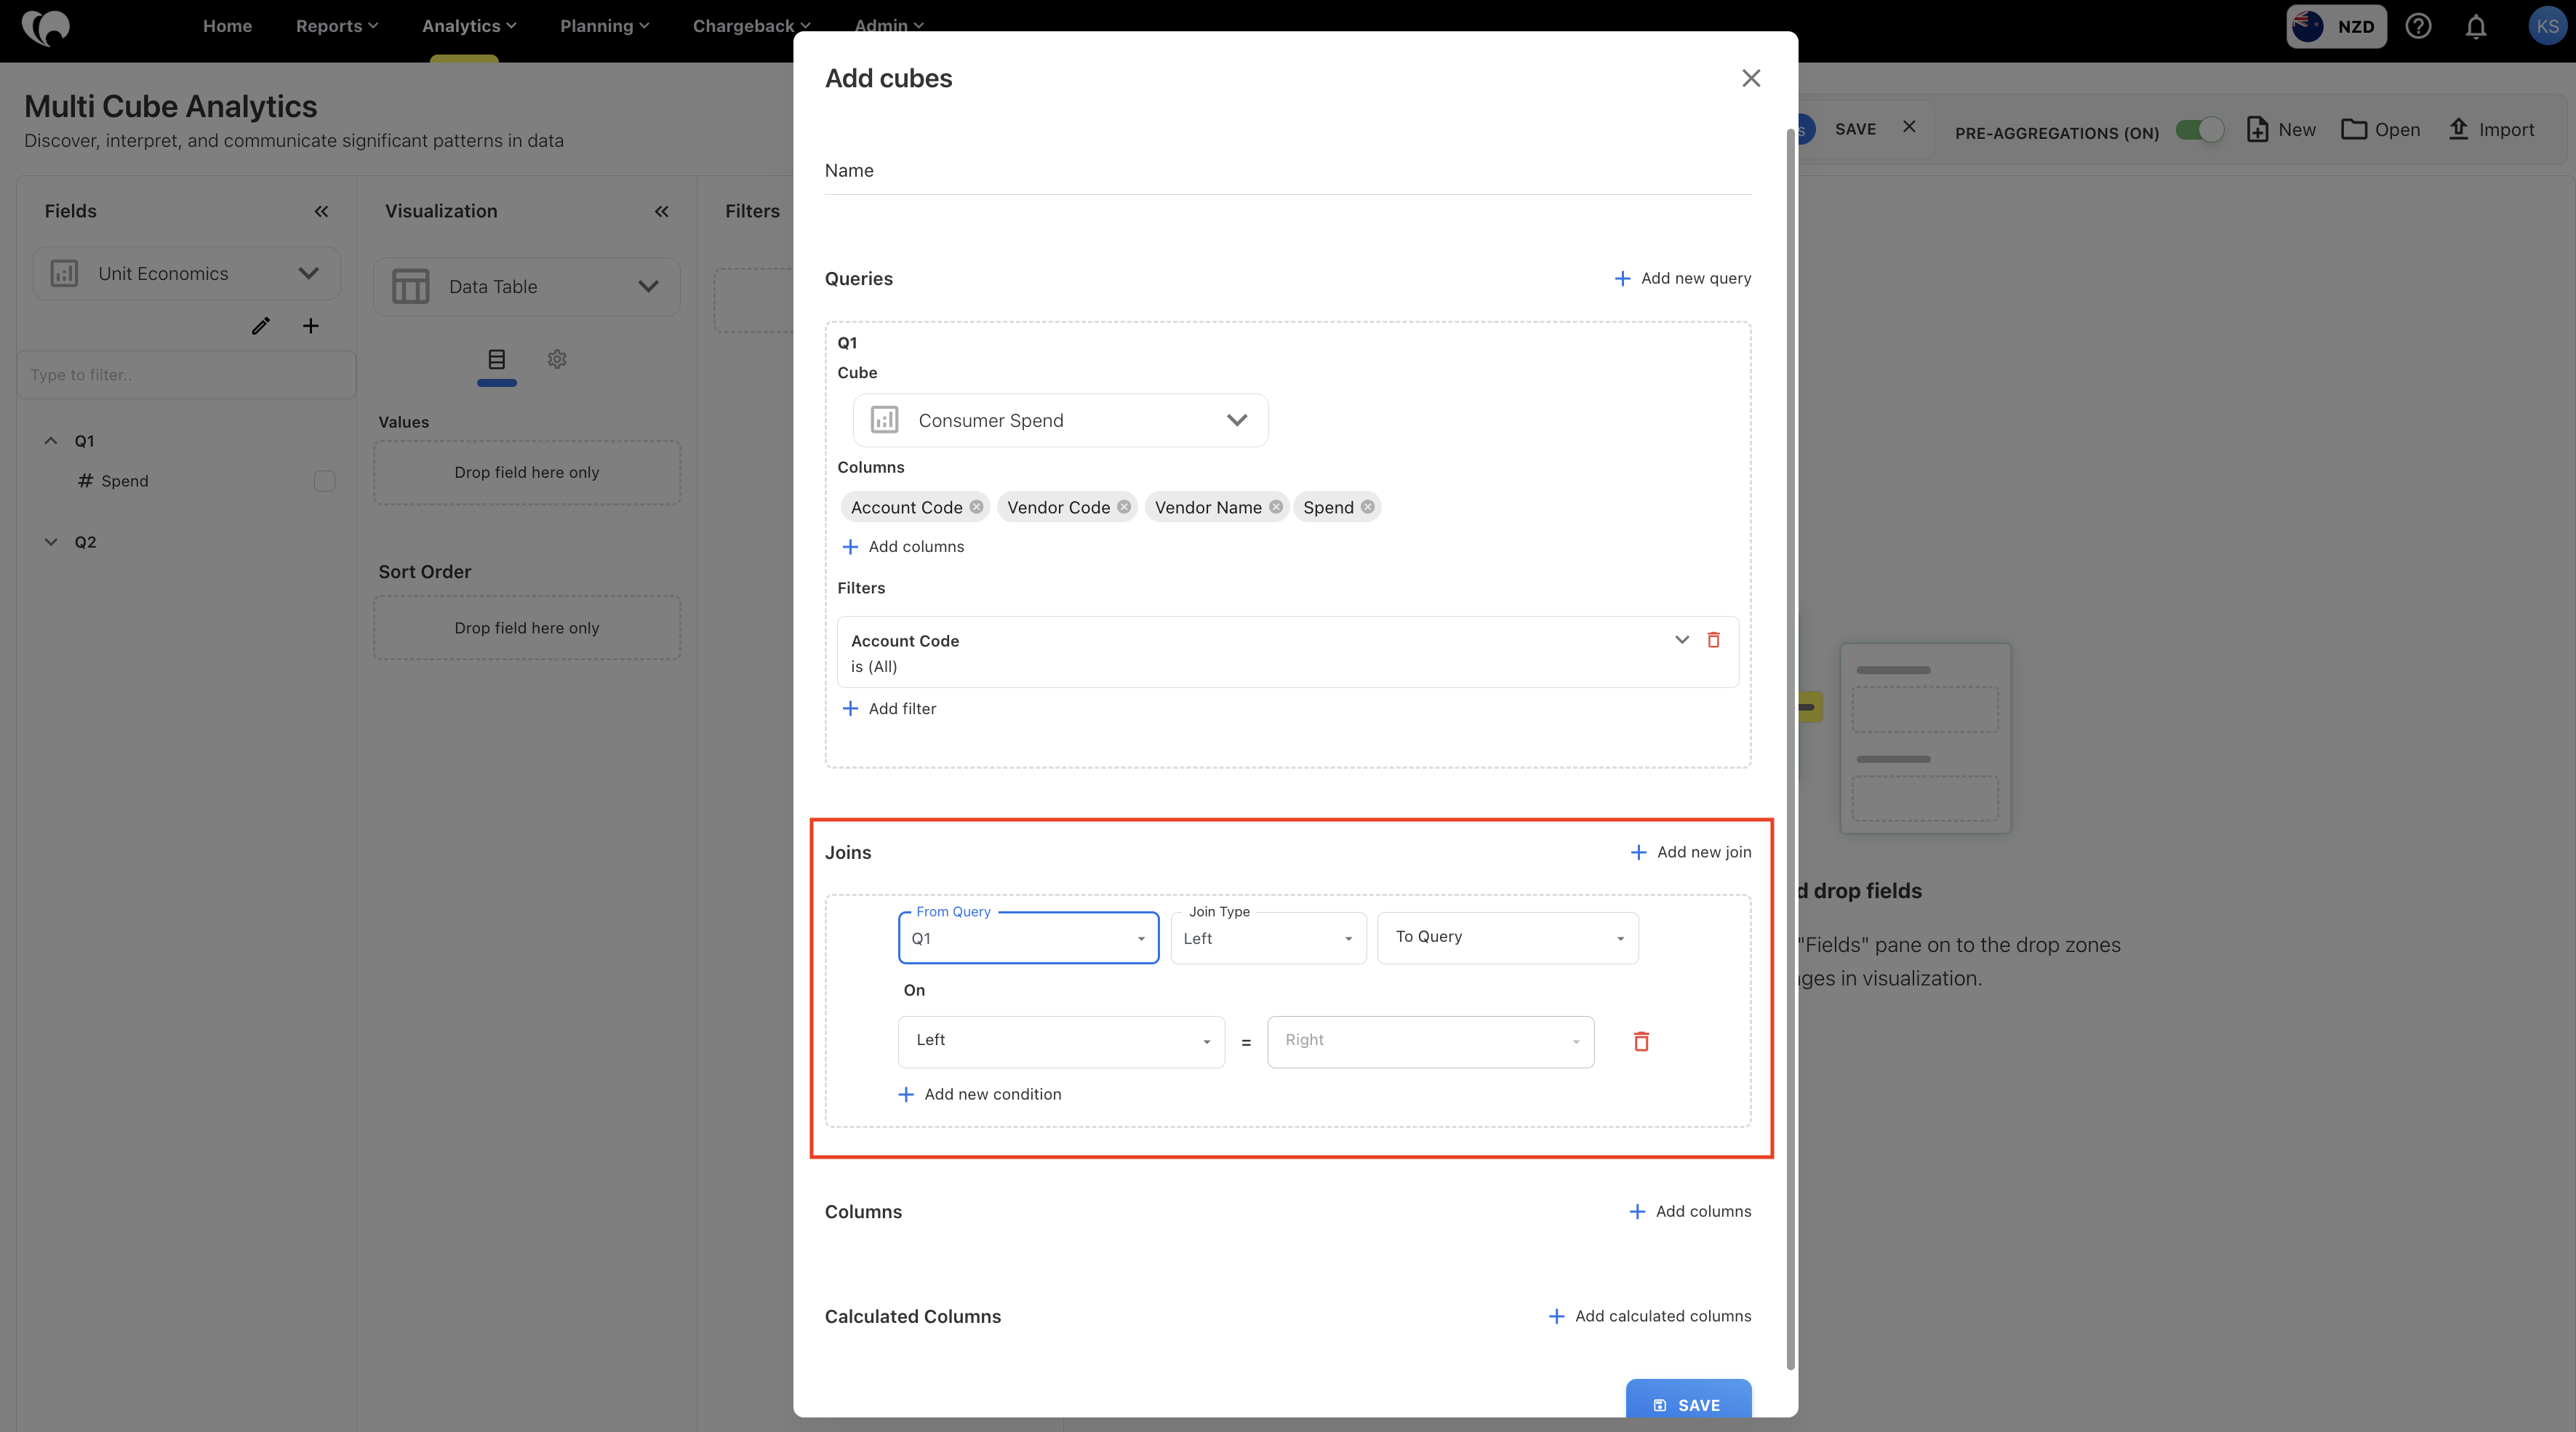
You can configure:
-
From Query
-
Join Type
-
To Query
-
Matching fields
-
Matching columns
The selected join determines how records are combined before the visualization is generated.
Columns
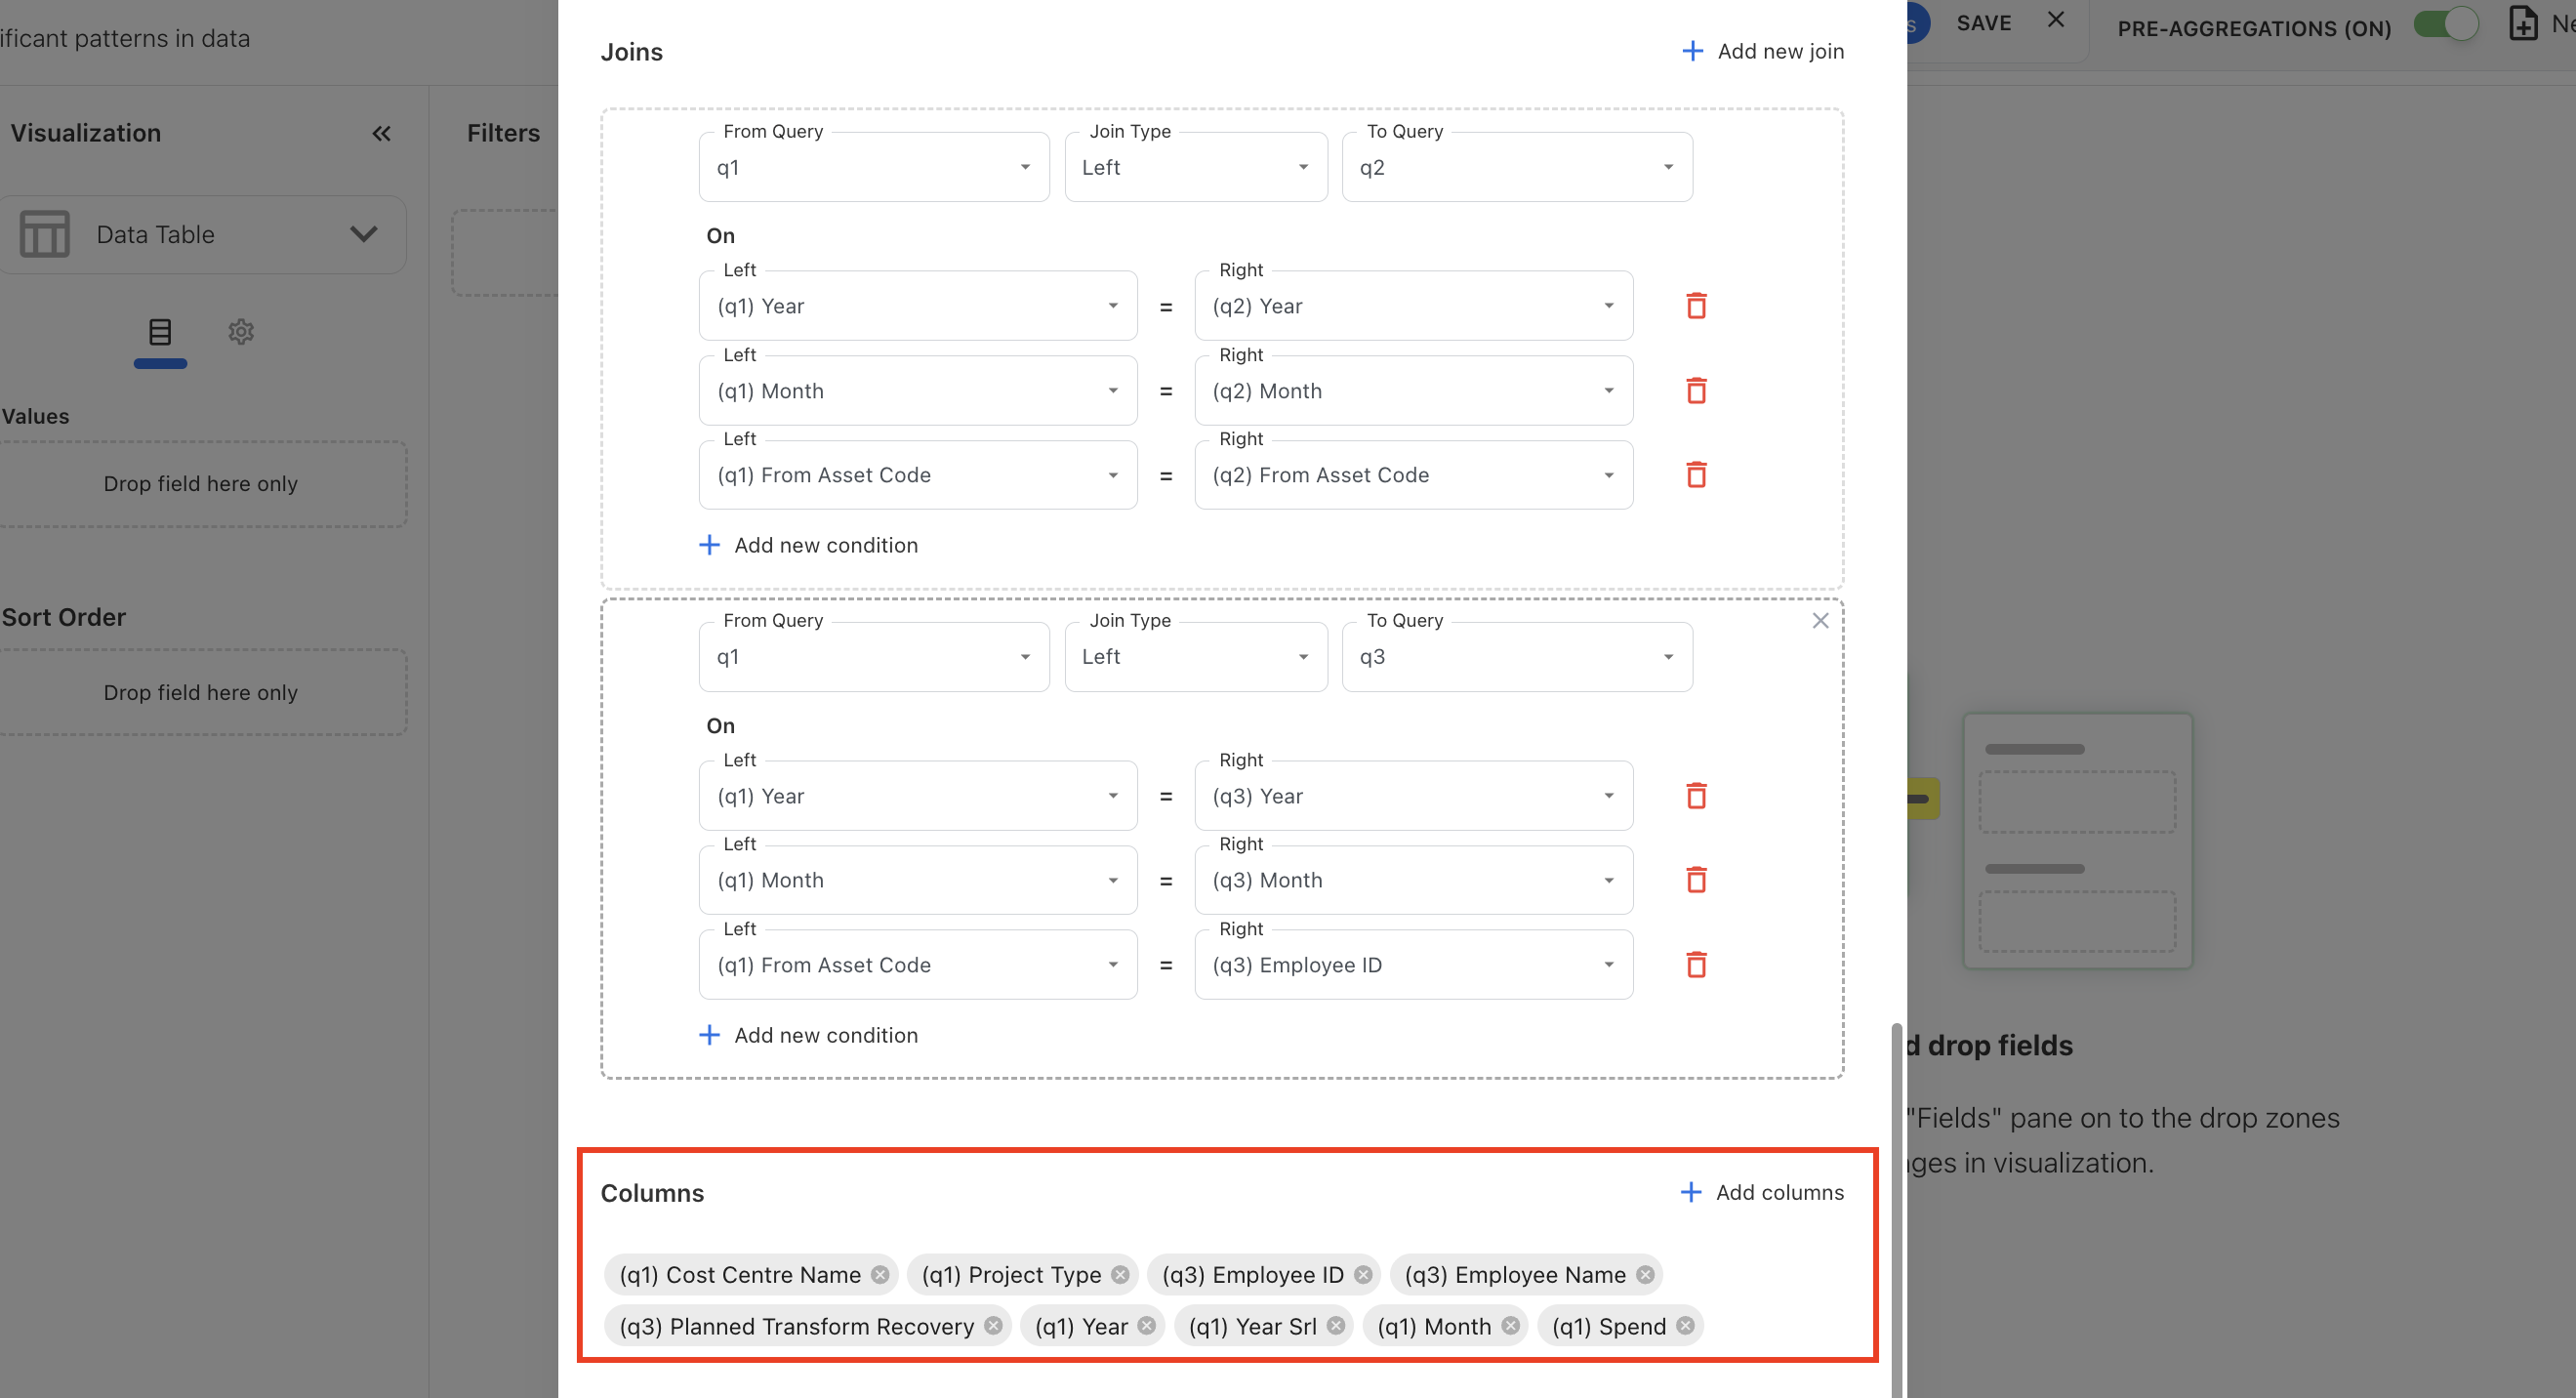
Columns determine which fields become available to the visualization.
Only fields added to the Columns section can be used in reports and charts.
Calculated Columns
Calculated columns allow you to derive new business metrics using formulas.
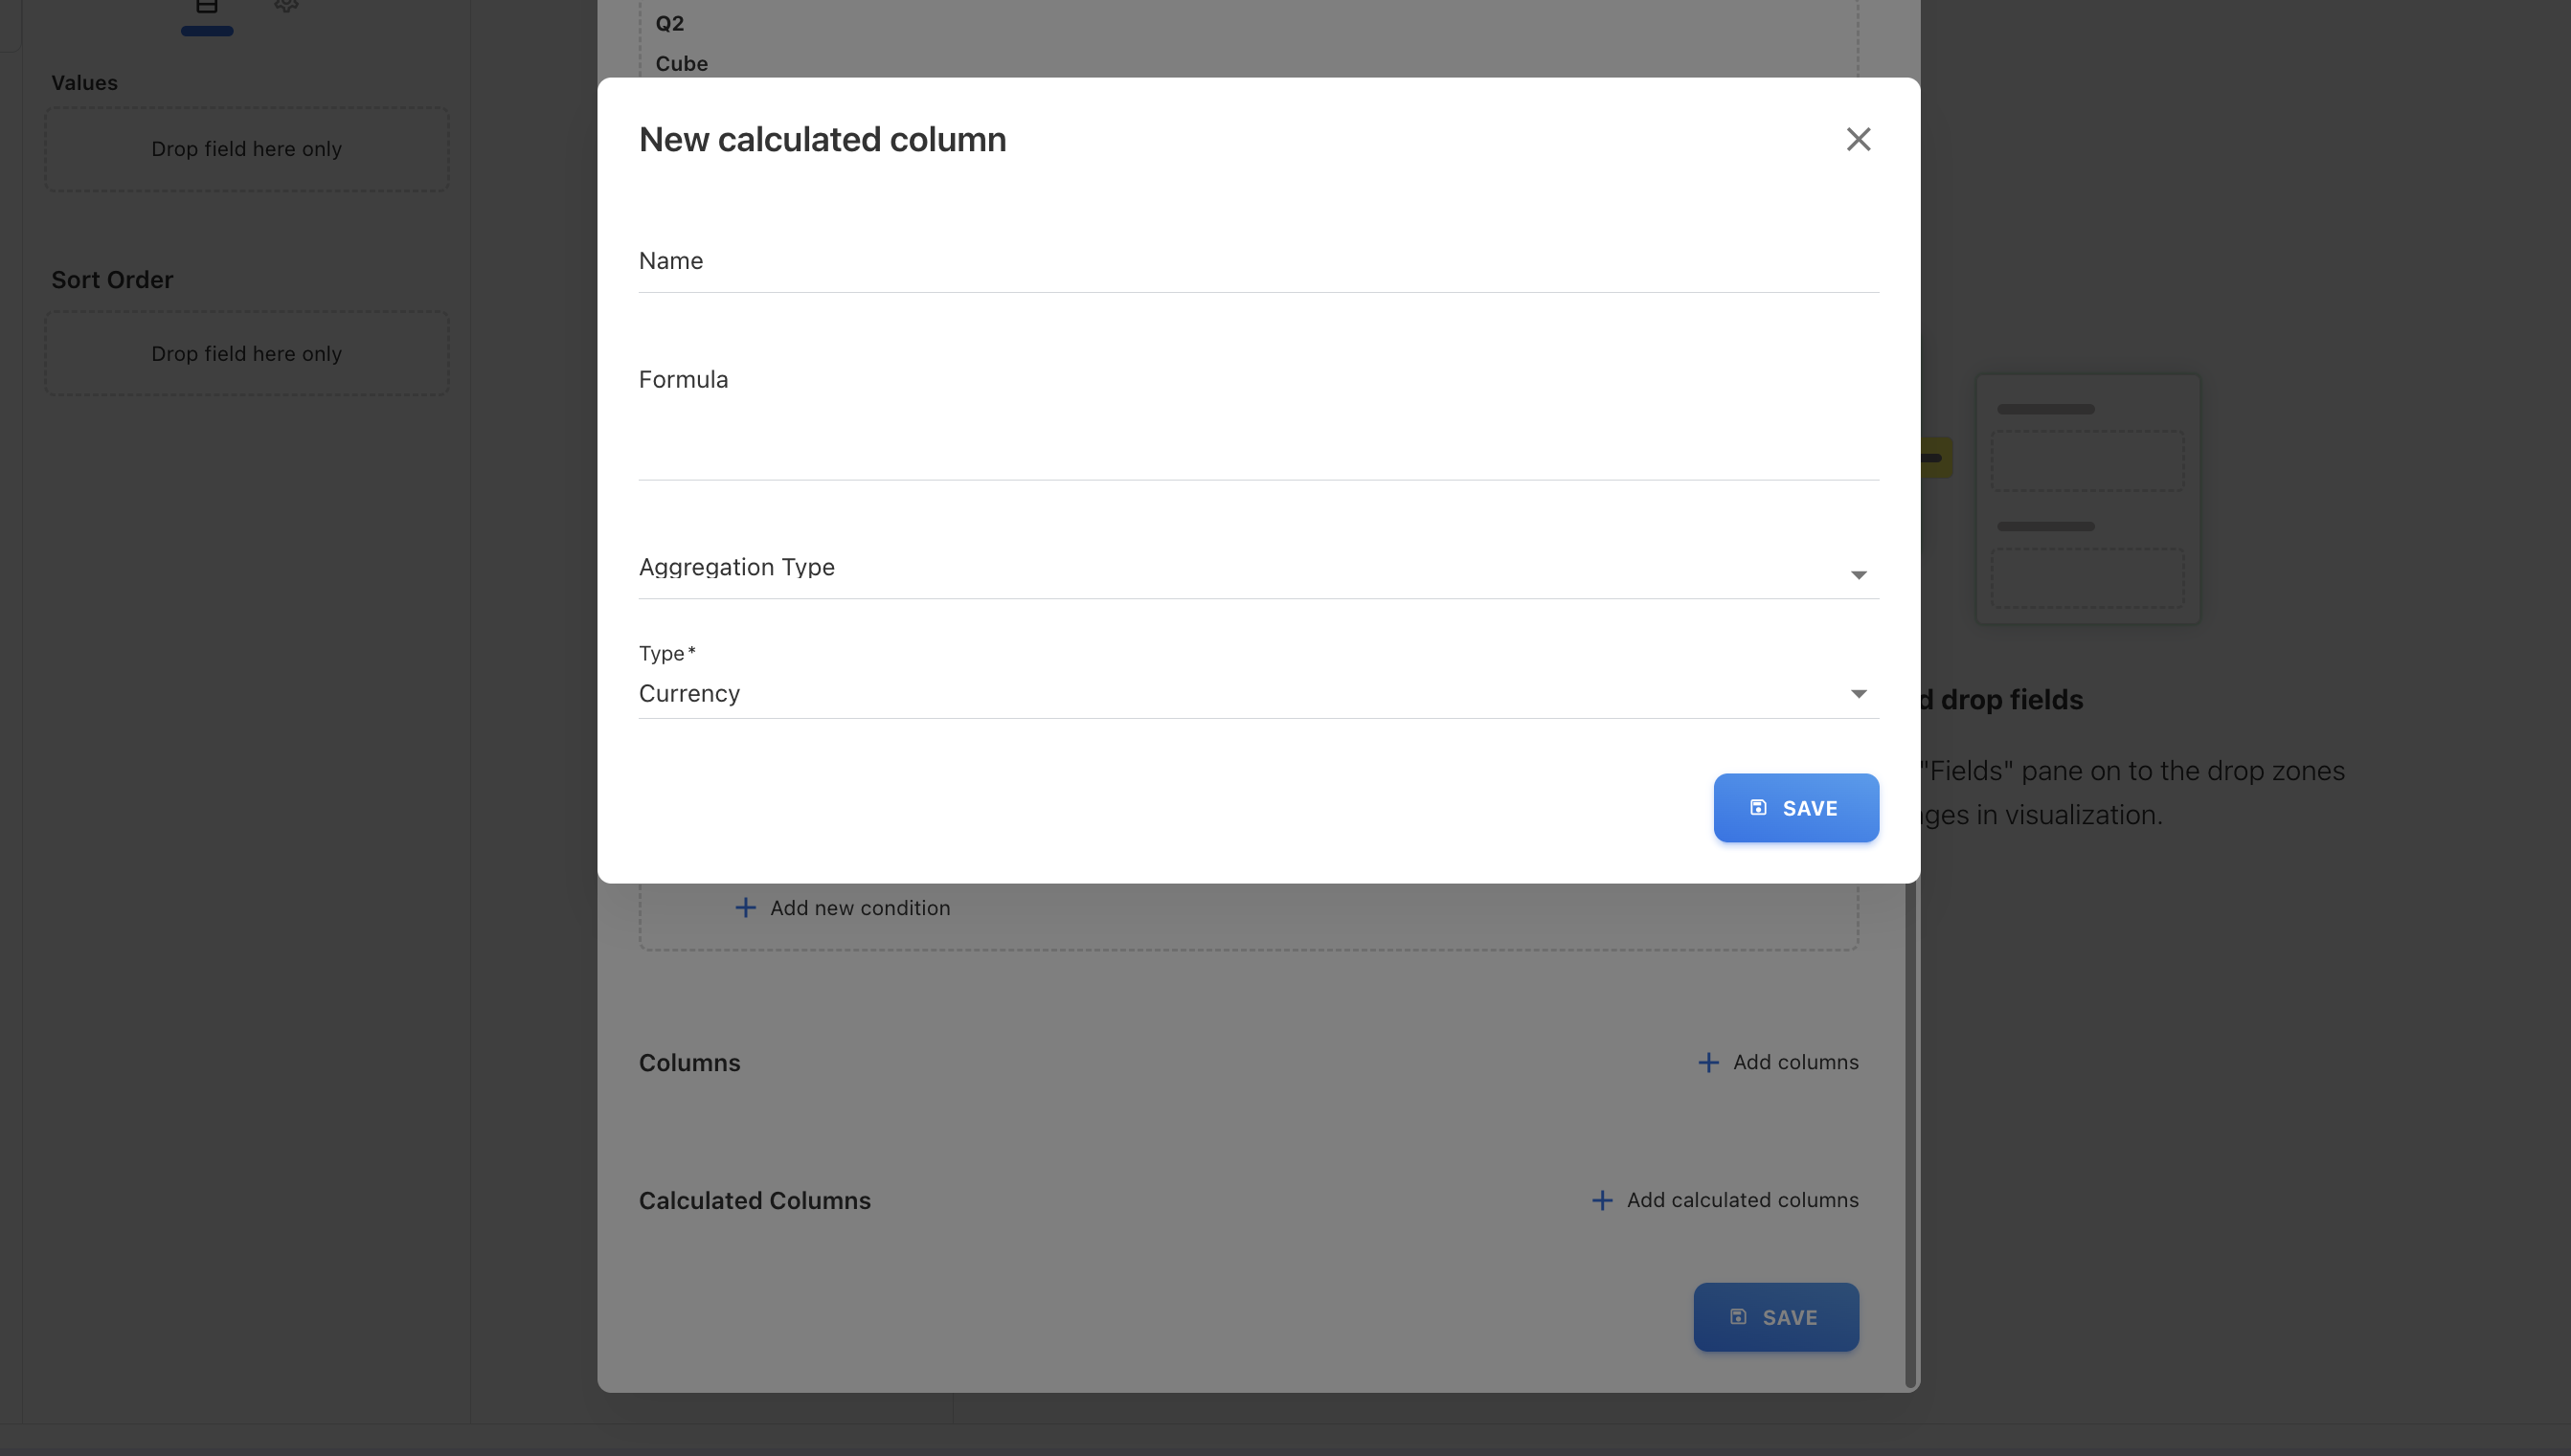
Each calculated column includes:
-
Name
-
Formula
-
Aggregation type
-
Data type
Calculated columns are available only within the current Multi Cube report.
Example used for Multi Cube
This guide uses the following example throughout the remaining pages.
The objective is to combine data from the Expenses and Consumer Expenses Analytics cubes to analyze overall expenses alongside consumer-level expense information.
|
Query |
Analytics cube |
|---|---|
|
Q1 |
Expenses |
|
Q2 |
Consumer Expenses |
The completed report displays:
-
Consumer ID
-
Consumer
-
Year
-
Month
-
Overall Expenses
-
Consumer Expenses
-
Remaining Expenses
The same workflow can be applied to any supported Analytics cubes.
Create a Multi Cube report
Step 1 - Add your first query
-
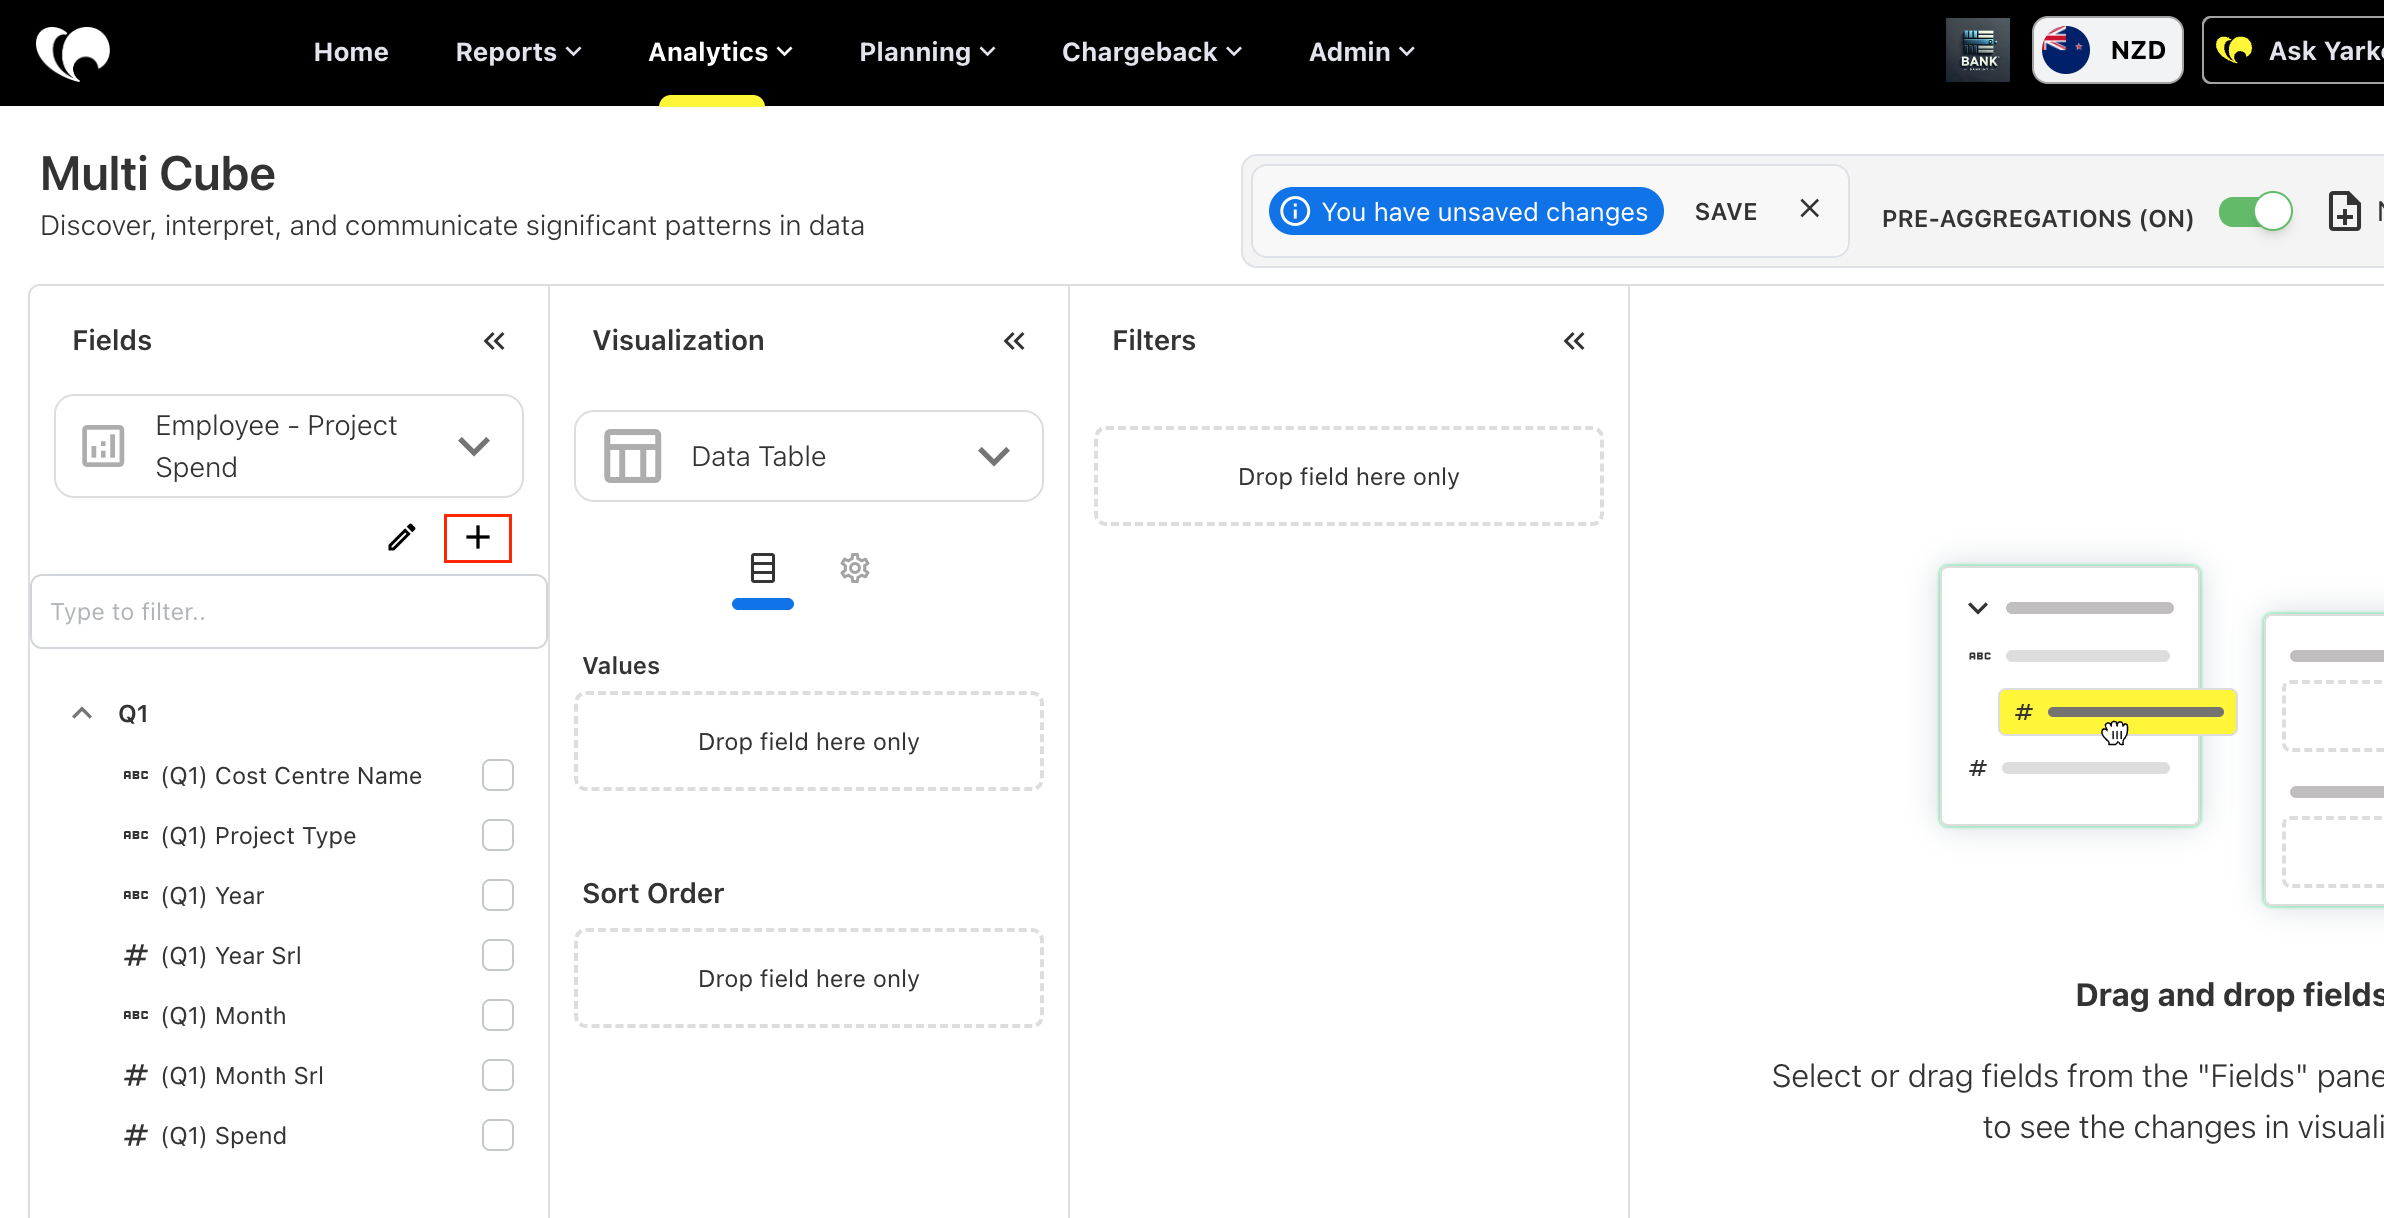
Navigate to Analytics > Multi Cube.
-
In Fields pane, click +.
-
Enter a query name.
-
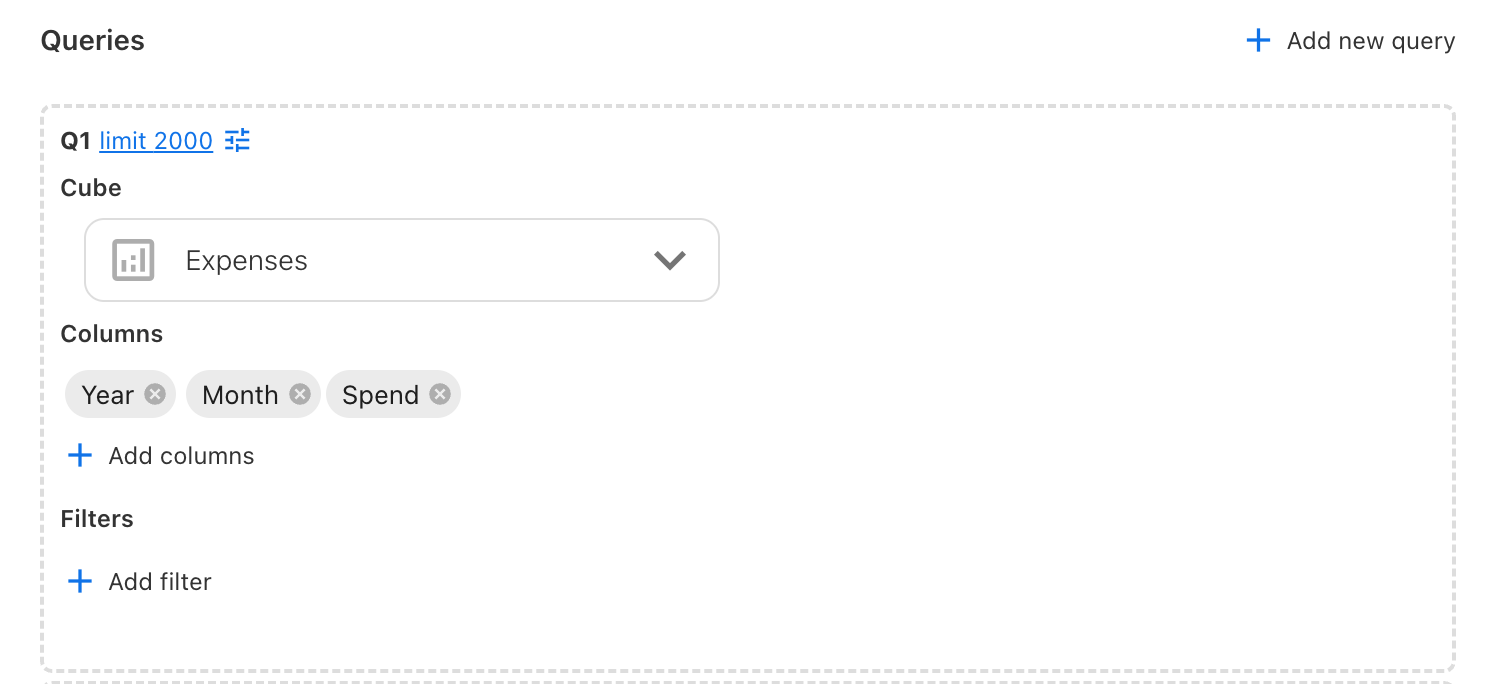
Select Add New Query (Q1).
-
Select the Expenses Analytics cube.
-
Select the required columns. For example scenario, add
-
Year
-
Month
-
Spend
-
-
Add filters if required and click SAVE.
Step 2 - Add additional queries
Repeat the same process for each Analytics cube required by the report. Each query retrieves data independently.
For this example:
-
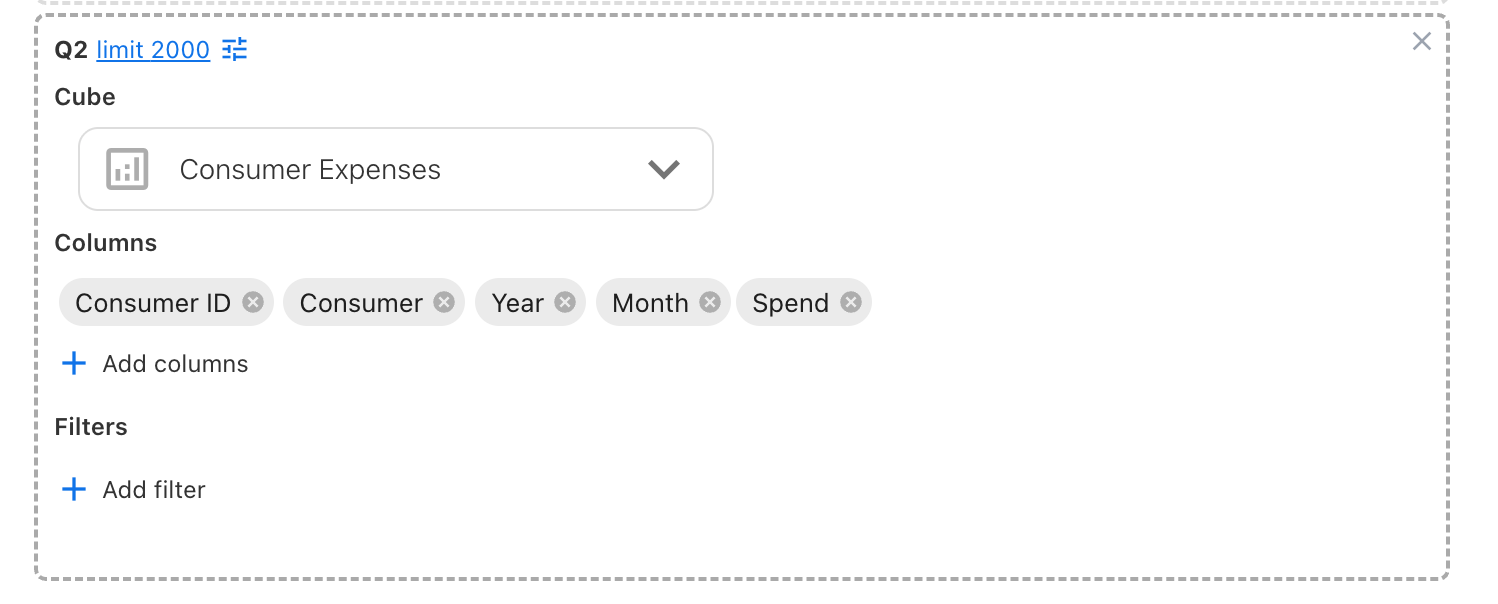
Select Add New Query (Q2).
-
Select the Consumer Expenses Analytics cube.
-
Select the required columns. For example scenario, add
-
Consumer ID
-
Consumer
-
Year
-
Month
-
Spend
-
-
Add filters if required and click SAVE.
Next steps
Once the queries have been created and verified, configure the relationships between them.
Continue to Build joins between queries
Related content