
Overview
Calculated columns allow you to create new fields by applying formulas to data returned from one or more queries. Unlike source columns, calculated columns are created within the Multi Cube report and are available only in that report.
You can use calculated columns to derive business metrics, perform mathematical calculations, compare values across queries, and create additional measures for reporting and visualization.
When to use calculated columns
Use calculated columns when you need to:
-
Compare values from different Analytics cubes.
-
Calculate variances or differences between measures.
-
Derive ratios or percentages.
-
Create custom metrics that do not exist in the source cubes.
-
Prepare calculated values for charts and dashboards.
Example
In the scenario used throughout this guide, a calculated column is created to determine the Remaining Expenses by subtracting the consumer expenses from the overall expenses.
Fields used in calculated columns
Formula
Determines the calculation using the technical column names.
-
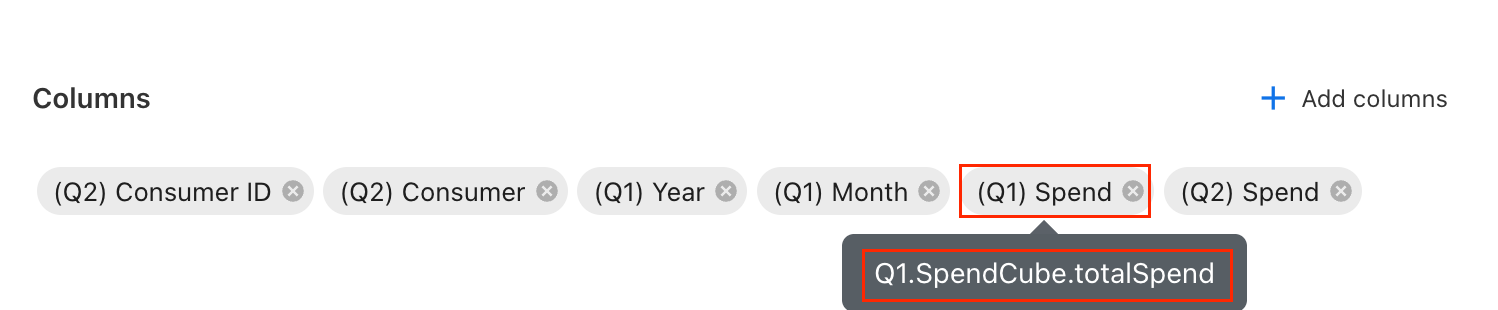
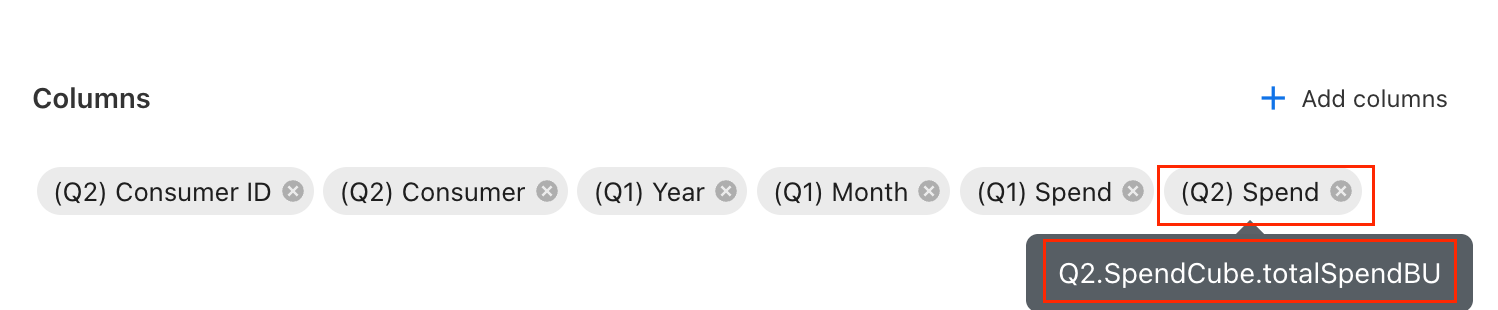
Enter each column name in the formula exactly as it appears in Multi Cube Analytics. Column references are case-sensitive and must include the query, cube, and column identifiers.
Example:
Define the formula for the Remaining Expenses calculation.
This formula calculates the difference between the overall expenses and consumer expenses.
Q1.SpendCube.totalSpend - Q2.SpendCube.totalSpendBU
The above formula includes query, cube, and column identifier.
Aggregation types
Aggregation determines how the calculated values are summarized within the report.
|
Aggregation |
Description |
Typical use |
|---|---|---|
|
Sum |
Adds all calculated values. |
Total expenses, costs, revenue |
|
Average |
Returns the average value. |
Average spend, average utilization |
|
Count |
Counts matching records. |
Number of consumers, assets, employees |
|
Min |
Returns the smallest value. |
Lowest cost |
|
Max |
Returns the highest value. |
Highest cost |
Data types
Select the data type that best represents the calculated value.
|
Type |
Use |
|---|---|
|
Currency |
Financial values |
|
Number |
Numeric values |
|
String |
Text values |
|
Boolean |
True or False values |
|
Percentage |
Ratios or percentages |
|
Date |
Date values |
Before you create a calculated column
Before creating a calculated column:
-
Create all required queries.
-
Configure the joins between the queries.
-
Verify that the required fields are available in the Columns section.
-
Determine the calculation you want to perform.
Create a calculated column
To create a calculated column:
-
Select Calculated Columns.
-
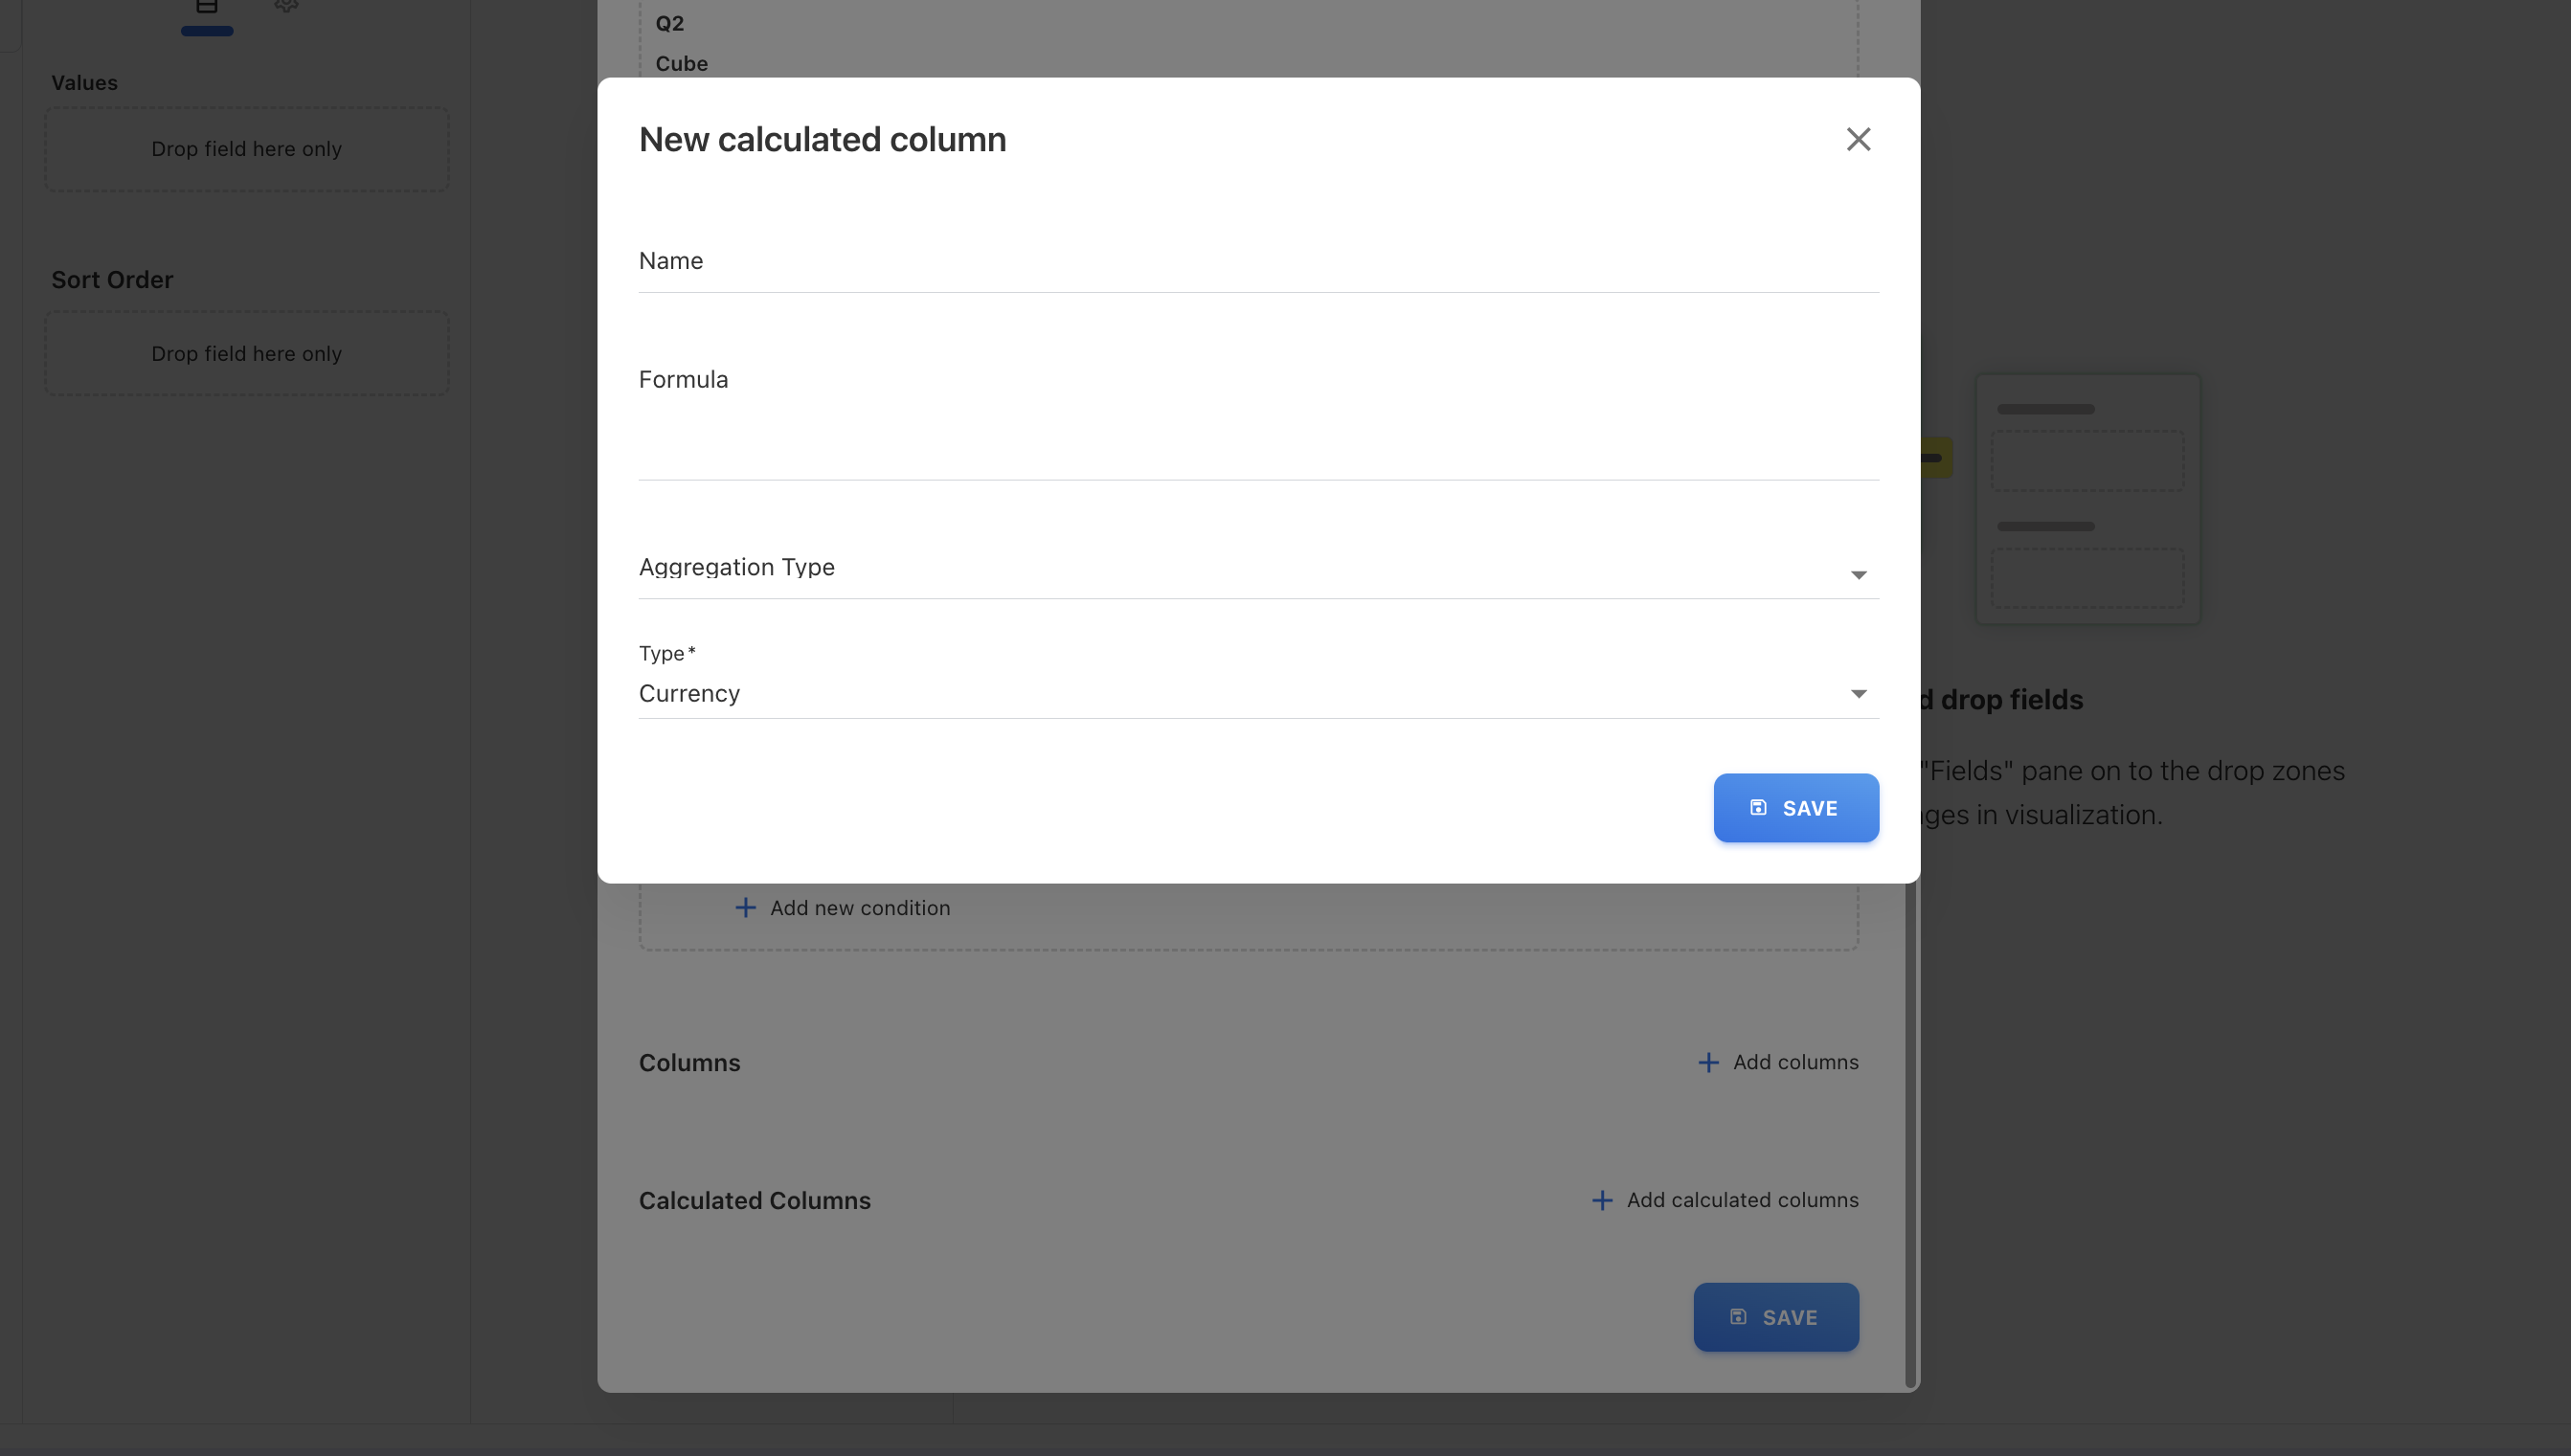
Click + Add Calculated Column.
-
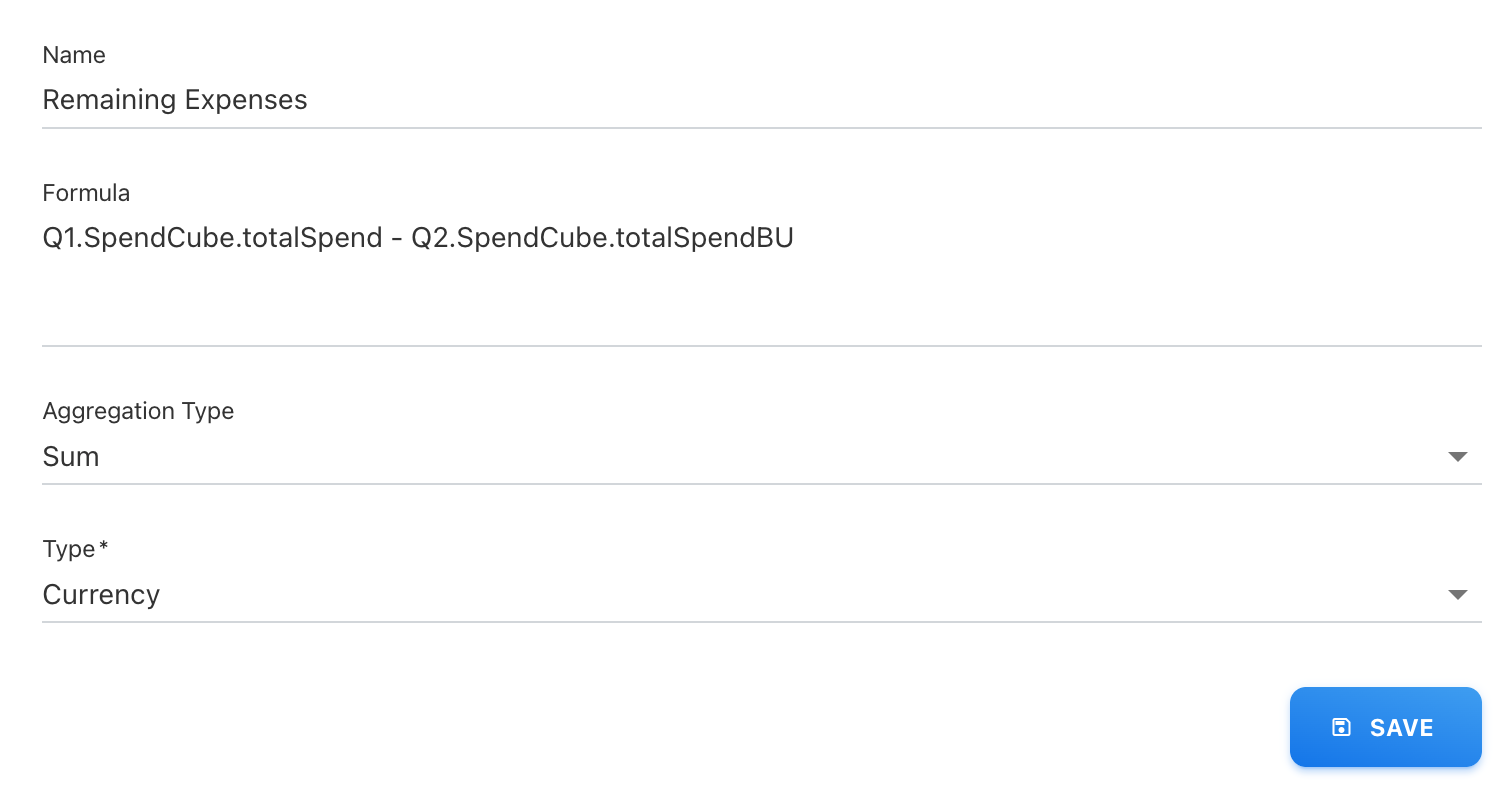
Enter a name, for example, Remaining Expenses.
-
Enter the formula, for example, Q1.SpendCube.totalSpend - Q2.SpendCube.totalSpendBU.
-
Select the aggregation type.
-
Select the data type.
-
Save the calculated column.
The calculated column becomes available alongside the other report fields.
Next steps
After creating the calculated columns, you're ready to build the report visualization.
Continue to Build report visualizations.
Related content