
Use dashboard widgets to build the reporting view you need. Widget options vary by content type and visualization.
At a glance: Add widgets in Edit mode, configure their settings and filters, then arrange the dashboard so related information is easy to review.
Add a widget
-
Open the required Custom Dashboard.
-
Select Edit.
-
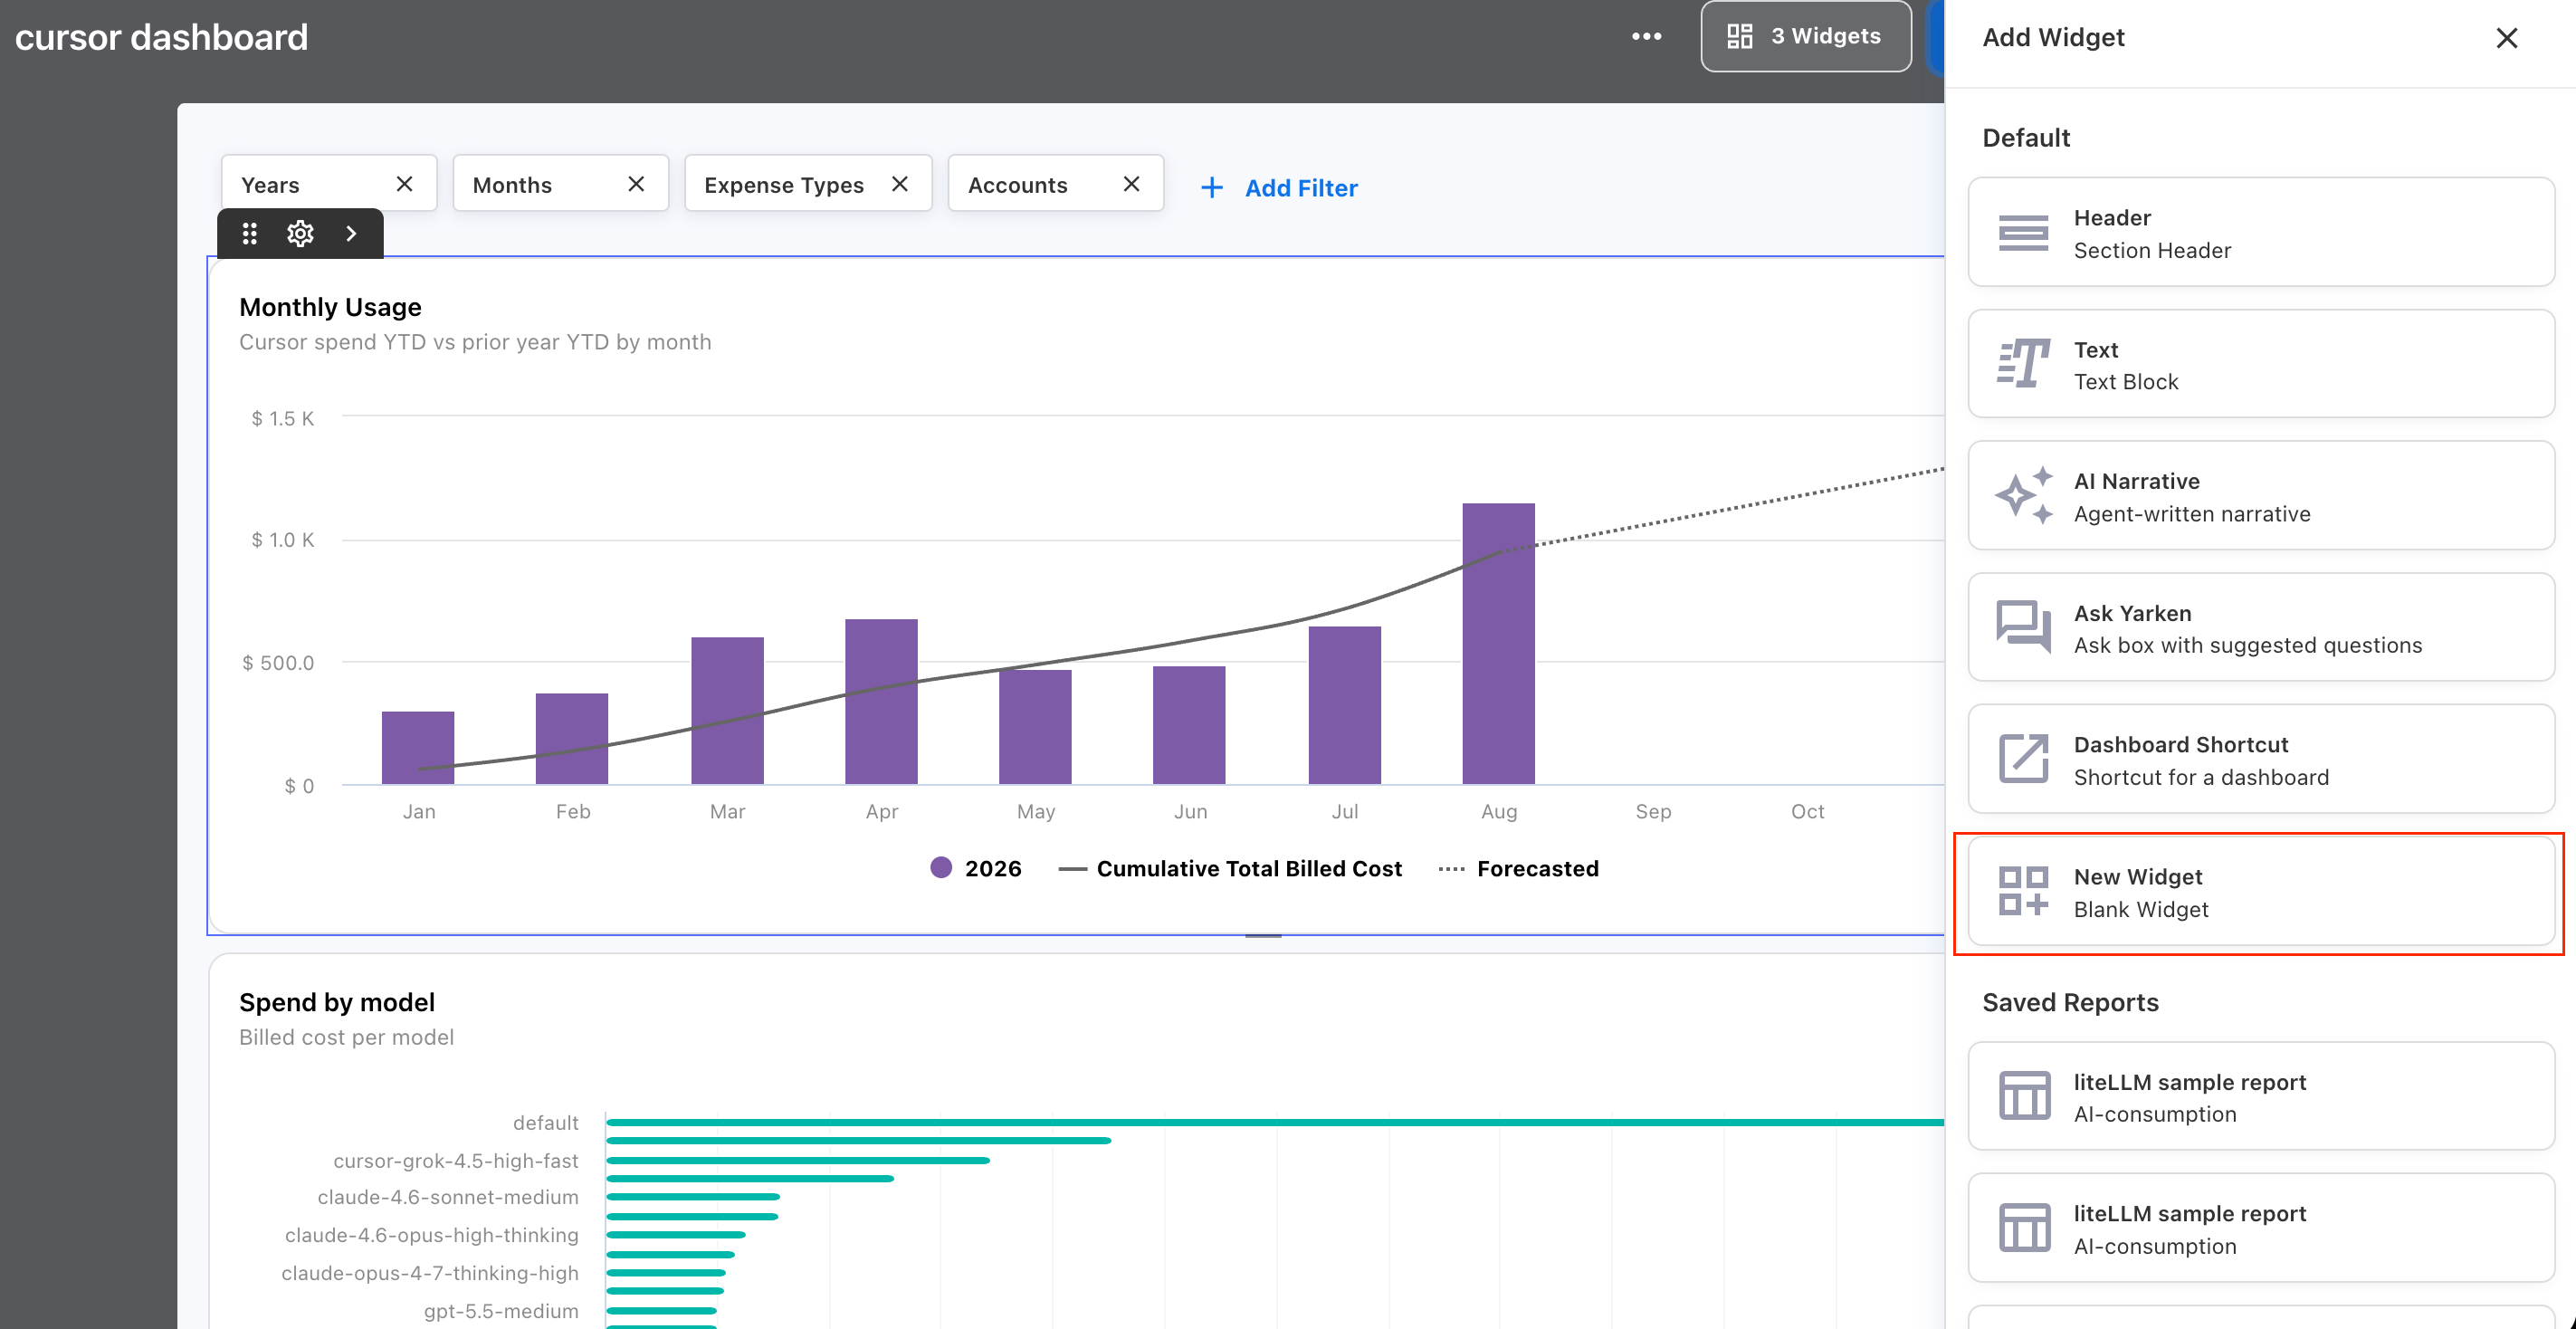
Select New Widget.
-
Choose the widget type you want to add.
-
Configure the widget.
-
Move or resize the widget as required.
-
Select Done when you finish editing the dashboard.
Widget types
Custom Dashboards can include different widget types, including:
-
Analytics charts and tables
-
KPI widgets
-
Text and header widgets
-
Dashboard Shortcuts
-
Insight widgets
-
AI Narrative widgets
-
Ask Yarken widgets
Choose the widget type based on the information you want to present and how users should interact with it.
The Ask Yarken widget adds an embedded Ask Yarken input to the dashboard. You can customize its appearance and optionally provide suggested questions to help dashboard viewers start their analysis.
Manage widgets
In Edit mode, you can manage widgets on the dashboard canvas.
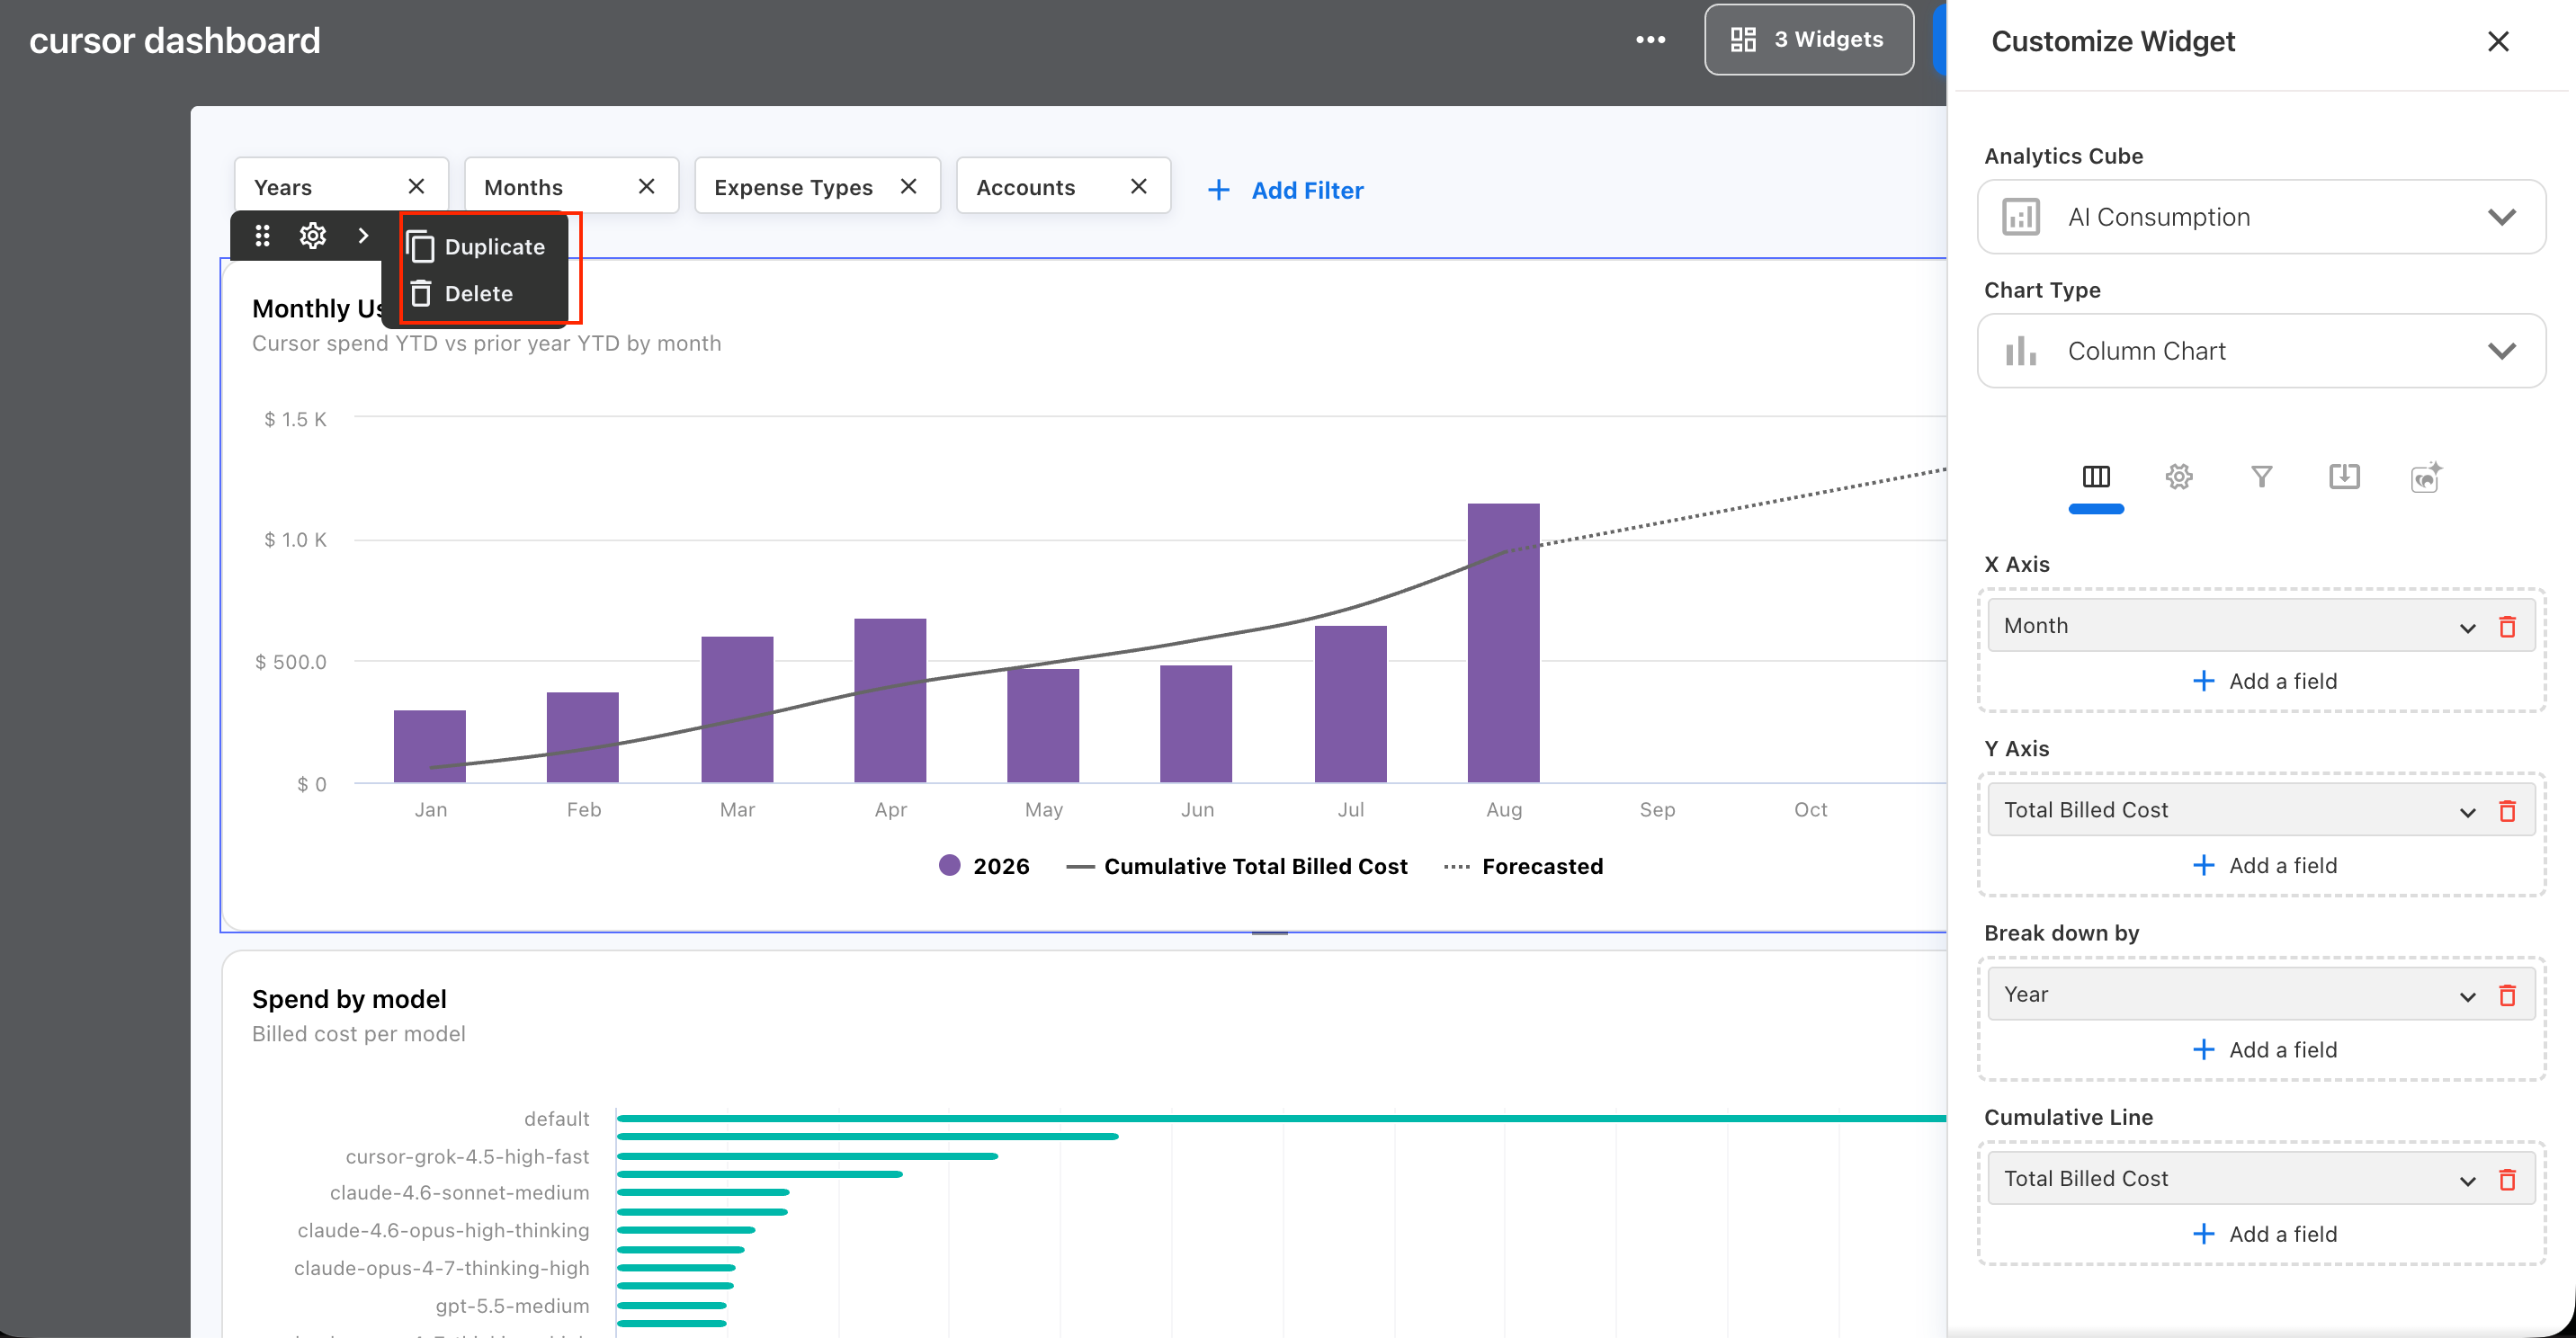
Depending on the widget, you can:
-
Move the widget.
-
Resize the widget.
-
Duplicate the widget.
-
Remove the widget.
-
Open widget settings.
-
Configure colors, labels, legends, and other display options.
-
Apply widget-level filters.
Available settings depend on the widget and visualization type.
Tip: Available settings vary by widget type. Configure only the options that support the dashboard’s reporting purpose.
Watch the widget count: Large dashboards can affect reviewability and query load. Remove low-value widgets or split content across purpose-specific dashboards when needed.
Monitor the number of widgets
When a dashboard contains a large number of widgets, Yarken displays a widget-count indicator or warning.
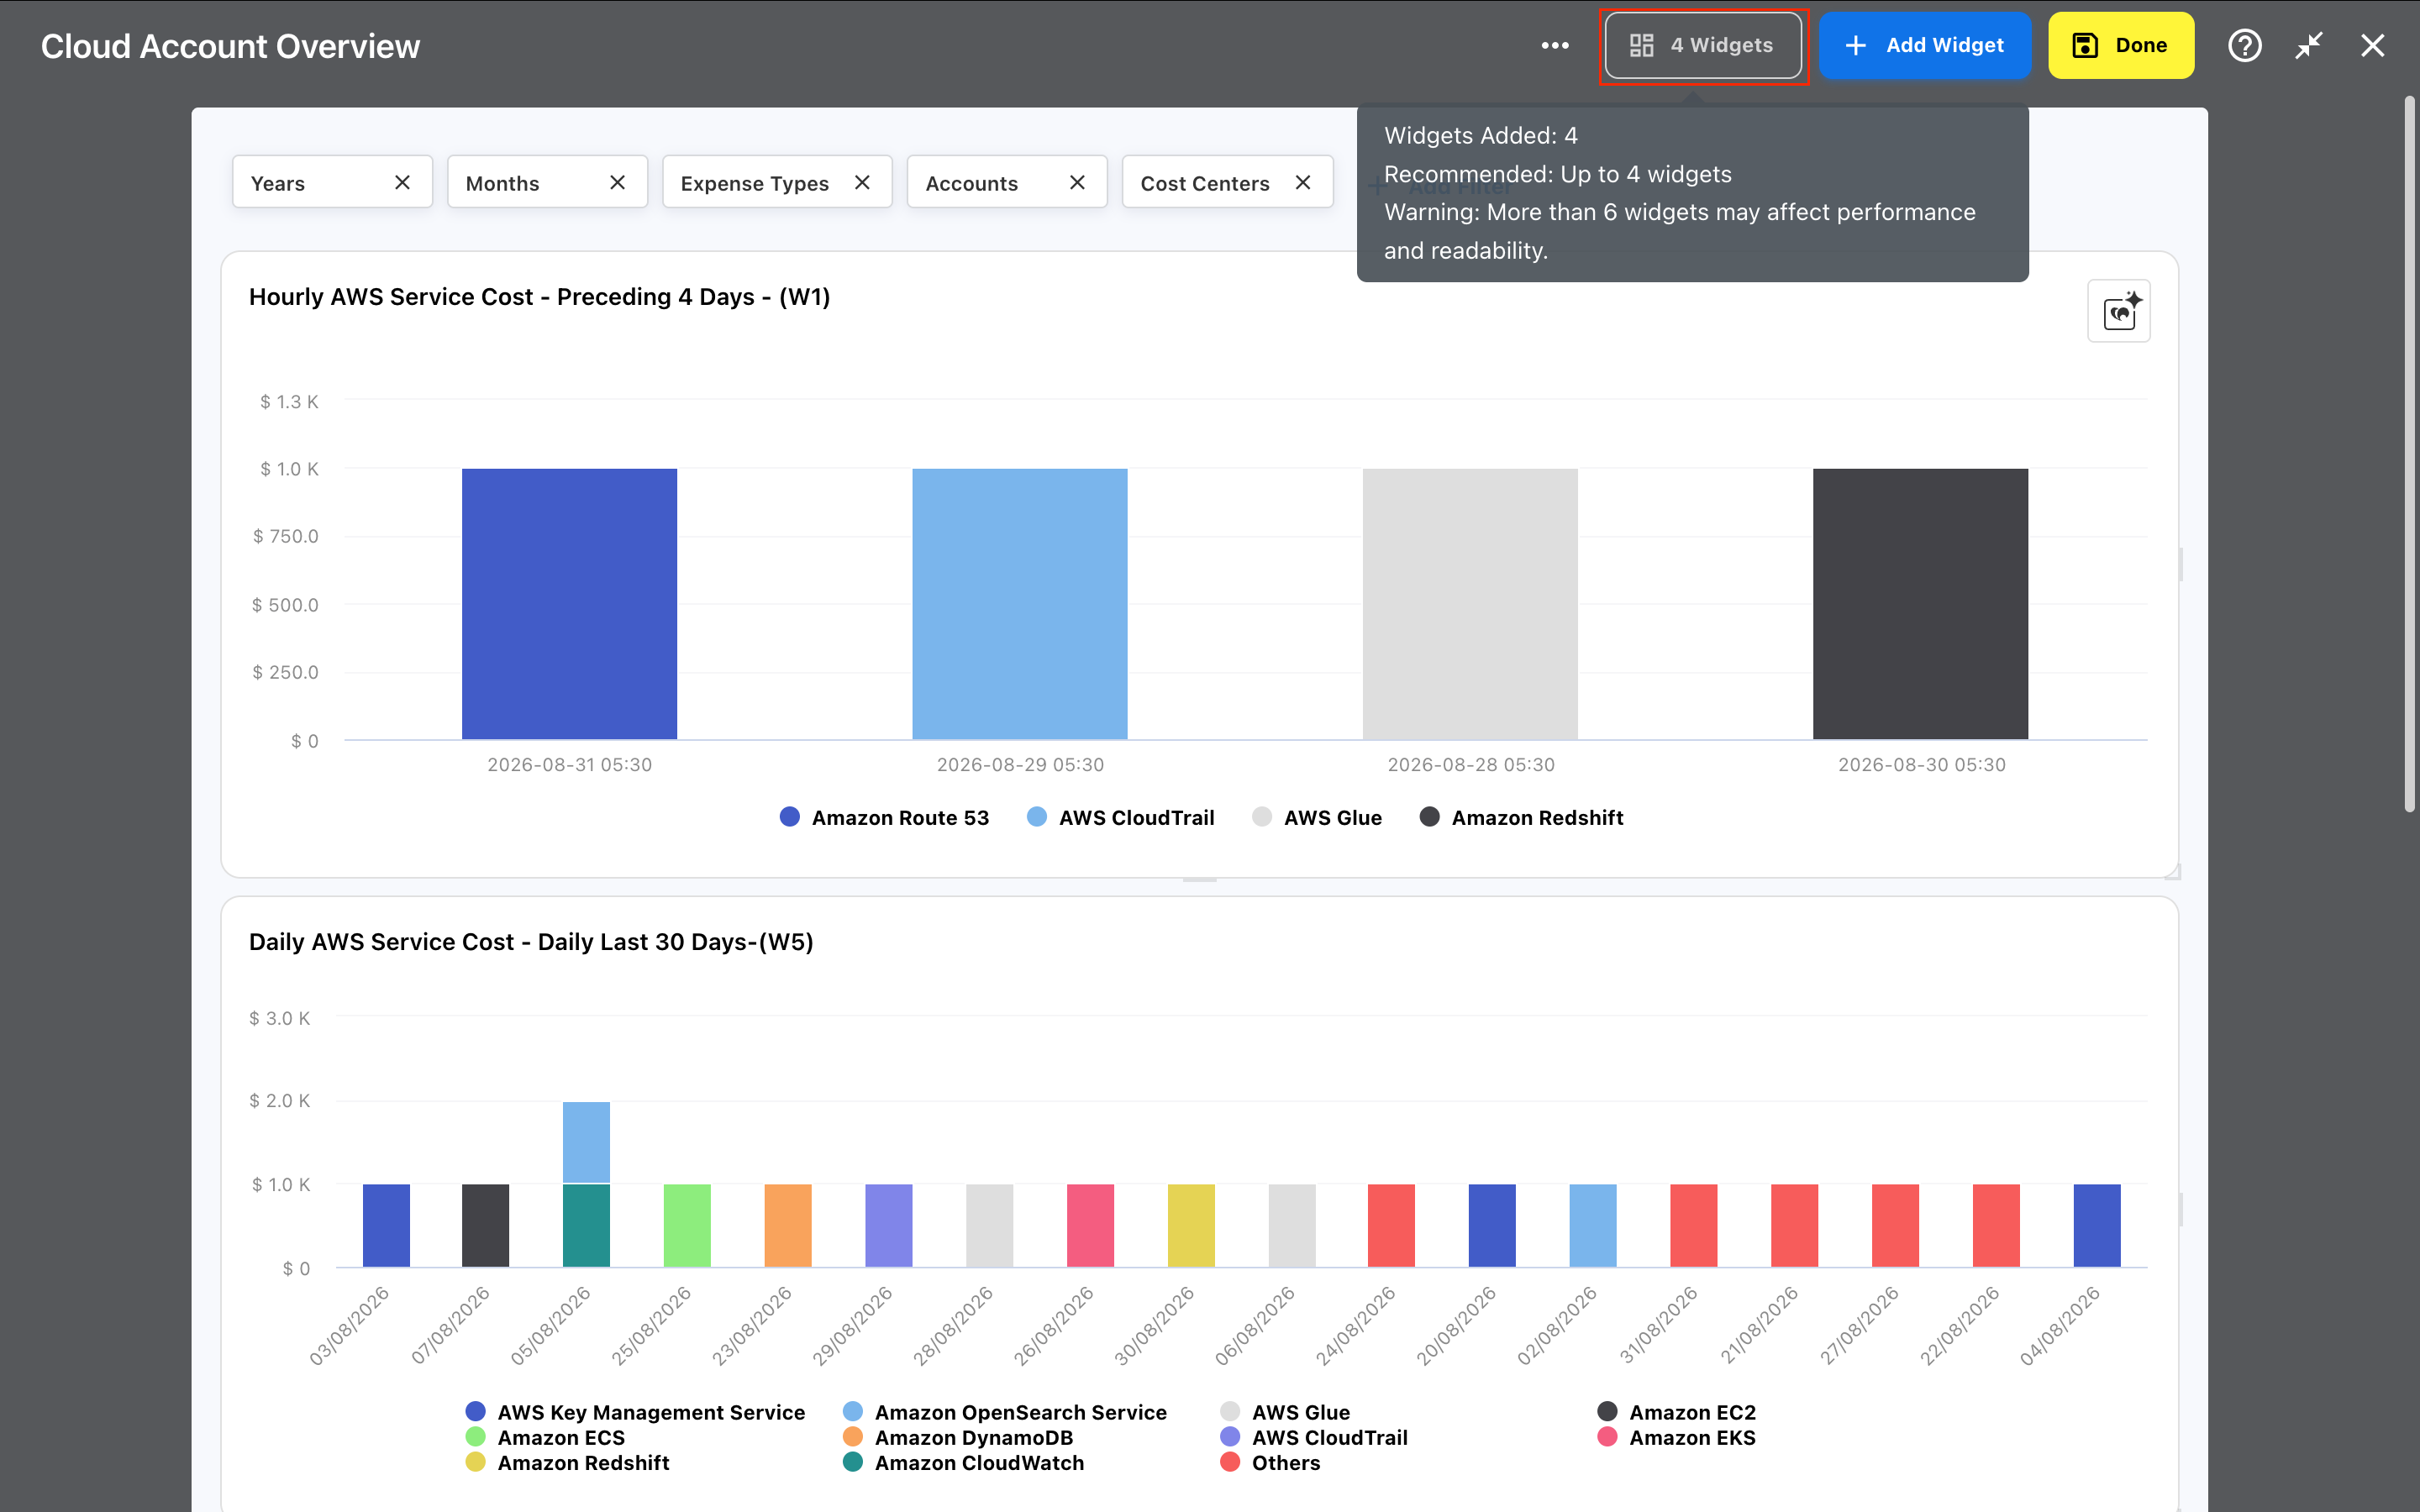
Use the indicator as a guide when deciding whether to add more widgets. KPI widgets are not included in the widget count because they have less impact on data and query load.
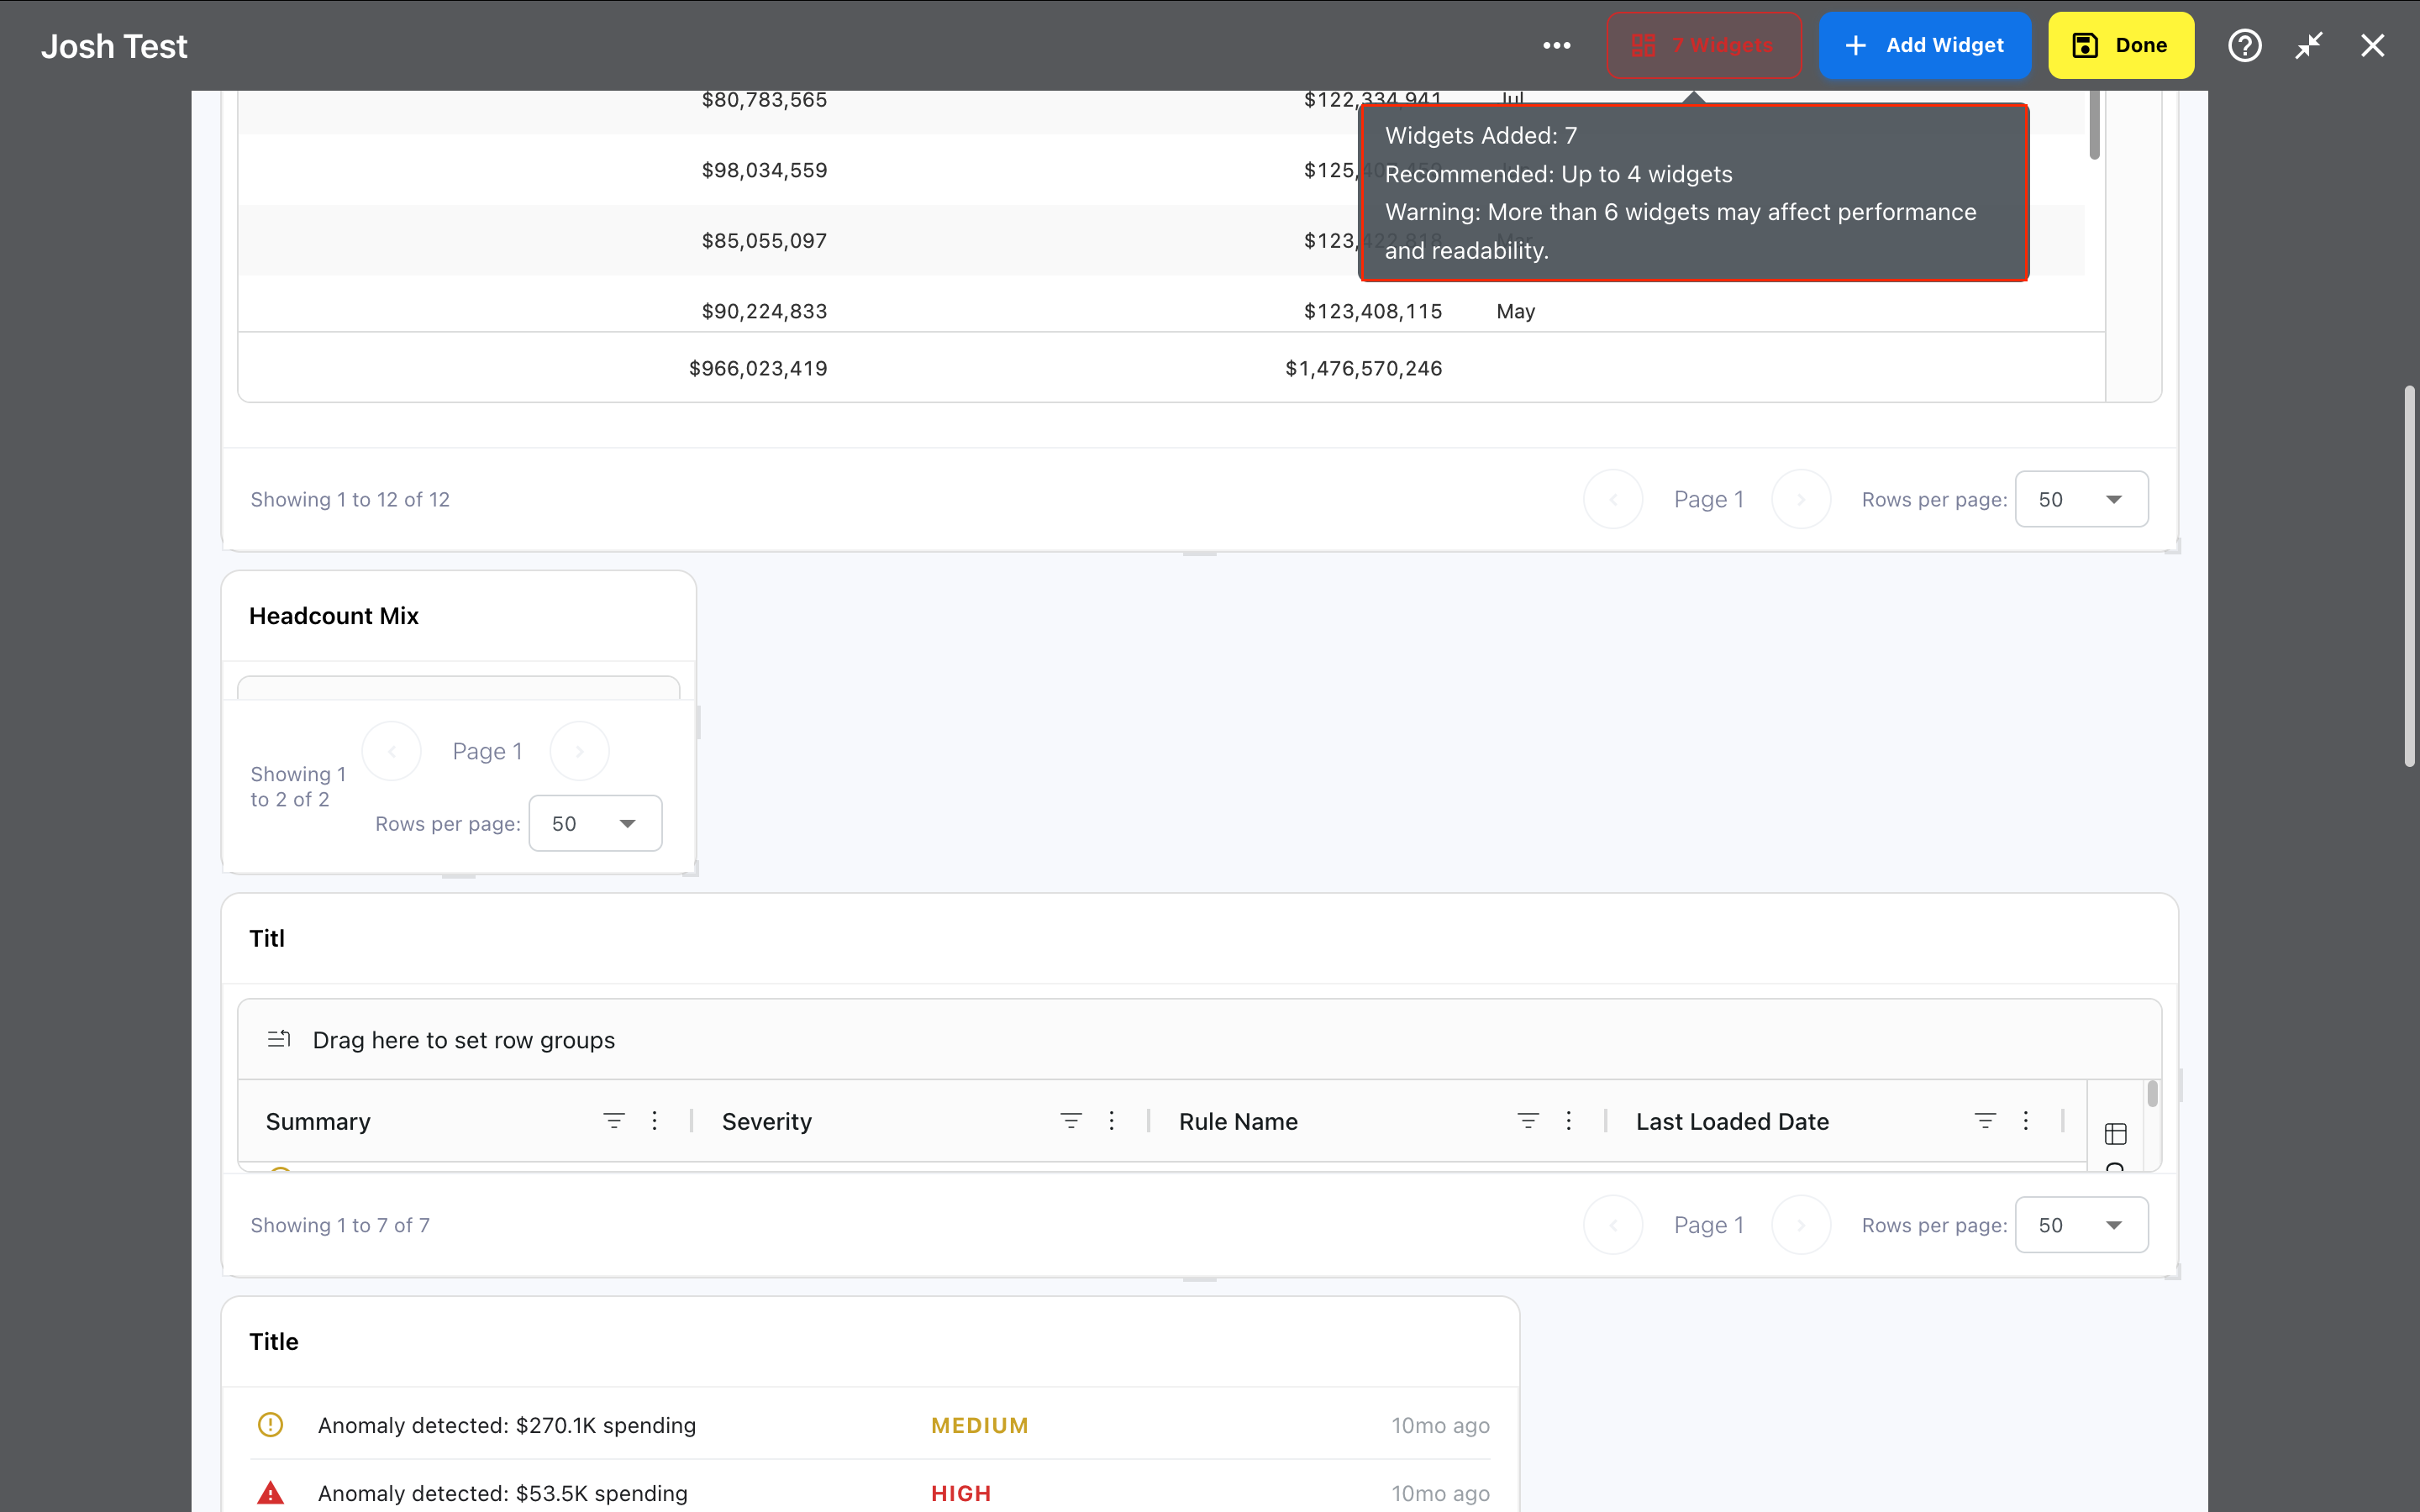
If a dashboard becomes difficult to review, consider removing less important widgets or splitting the content across purpose-specific dashboards.
Configure specialized widgets
Use the dedicated guides for more detailed configuration:
-
Configure chart and table widgets — Configure visualizations, trend lines, and forecasting.
-
Configure KPI widgets — Configure KPI display, icons, and forecasting options.
-
Configure Dashboard Shortcuts — Create and style shortcuts to related dashboards.
-
Add Insights to Custom Dashboards — Add detected Insights to a dashboard.
-
Add and configure a Dashboard AI Narrative widget — Configure, generate, and schedule AI narratives.
-
Add and configure an Ask Yarken widget — Add an embedded Ask Yarken input, customize its appearance, and configure suggested questions.
Recommended outcome: Keep dashboards focused, consistent, and easy to scan by grouping related widgets and using appropriate filters.
Recommended practices
-
Add widgets that support the dashboard's reporting purpose.
-
Keep related information together on the dashboard canvas.
-
Use consistent titles, icons, and display settings for related widgets.
-
Use widget-level filters only when a widget needs a different scope from the overall dashboard.
-
Review the widget-count indicator before adding more content to a large dashboard.
Tip: When a widget does not show the expected data, check its fields, measures, filters, and source report before changing the dashboard layout.
Troubleshooting
If a widget does not show the expected data:
-
Check its fields and measures.
-
Review widget-level and dashboard-level filters.
-
Confirm that the underlying data is available for the selected period.
-
Open the source report in Analytics where applicable and validate its results.
Related content