
Add detected Insights to a Custom Dashboard when you want to review important anomalies alongside other dashboard metrics.
Insight widgets use Insight and Insight Rule data generated by Yarken. You can select the fields that provide the context required for your dashboard.
Before you begin
Make sure Insights are available for the data you want to review. The fields available to the widget come from the Insights Analytics data cube.
Create an Insight widget
-
Open the required Custom Dashboard.
-
Select Edit.
-
Add a new widget.
-
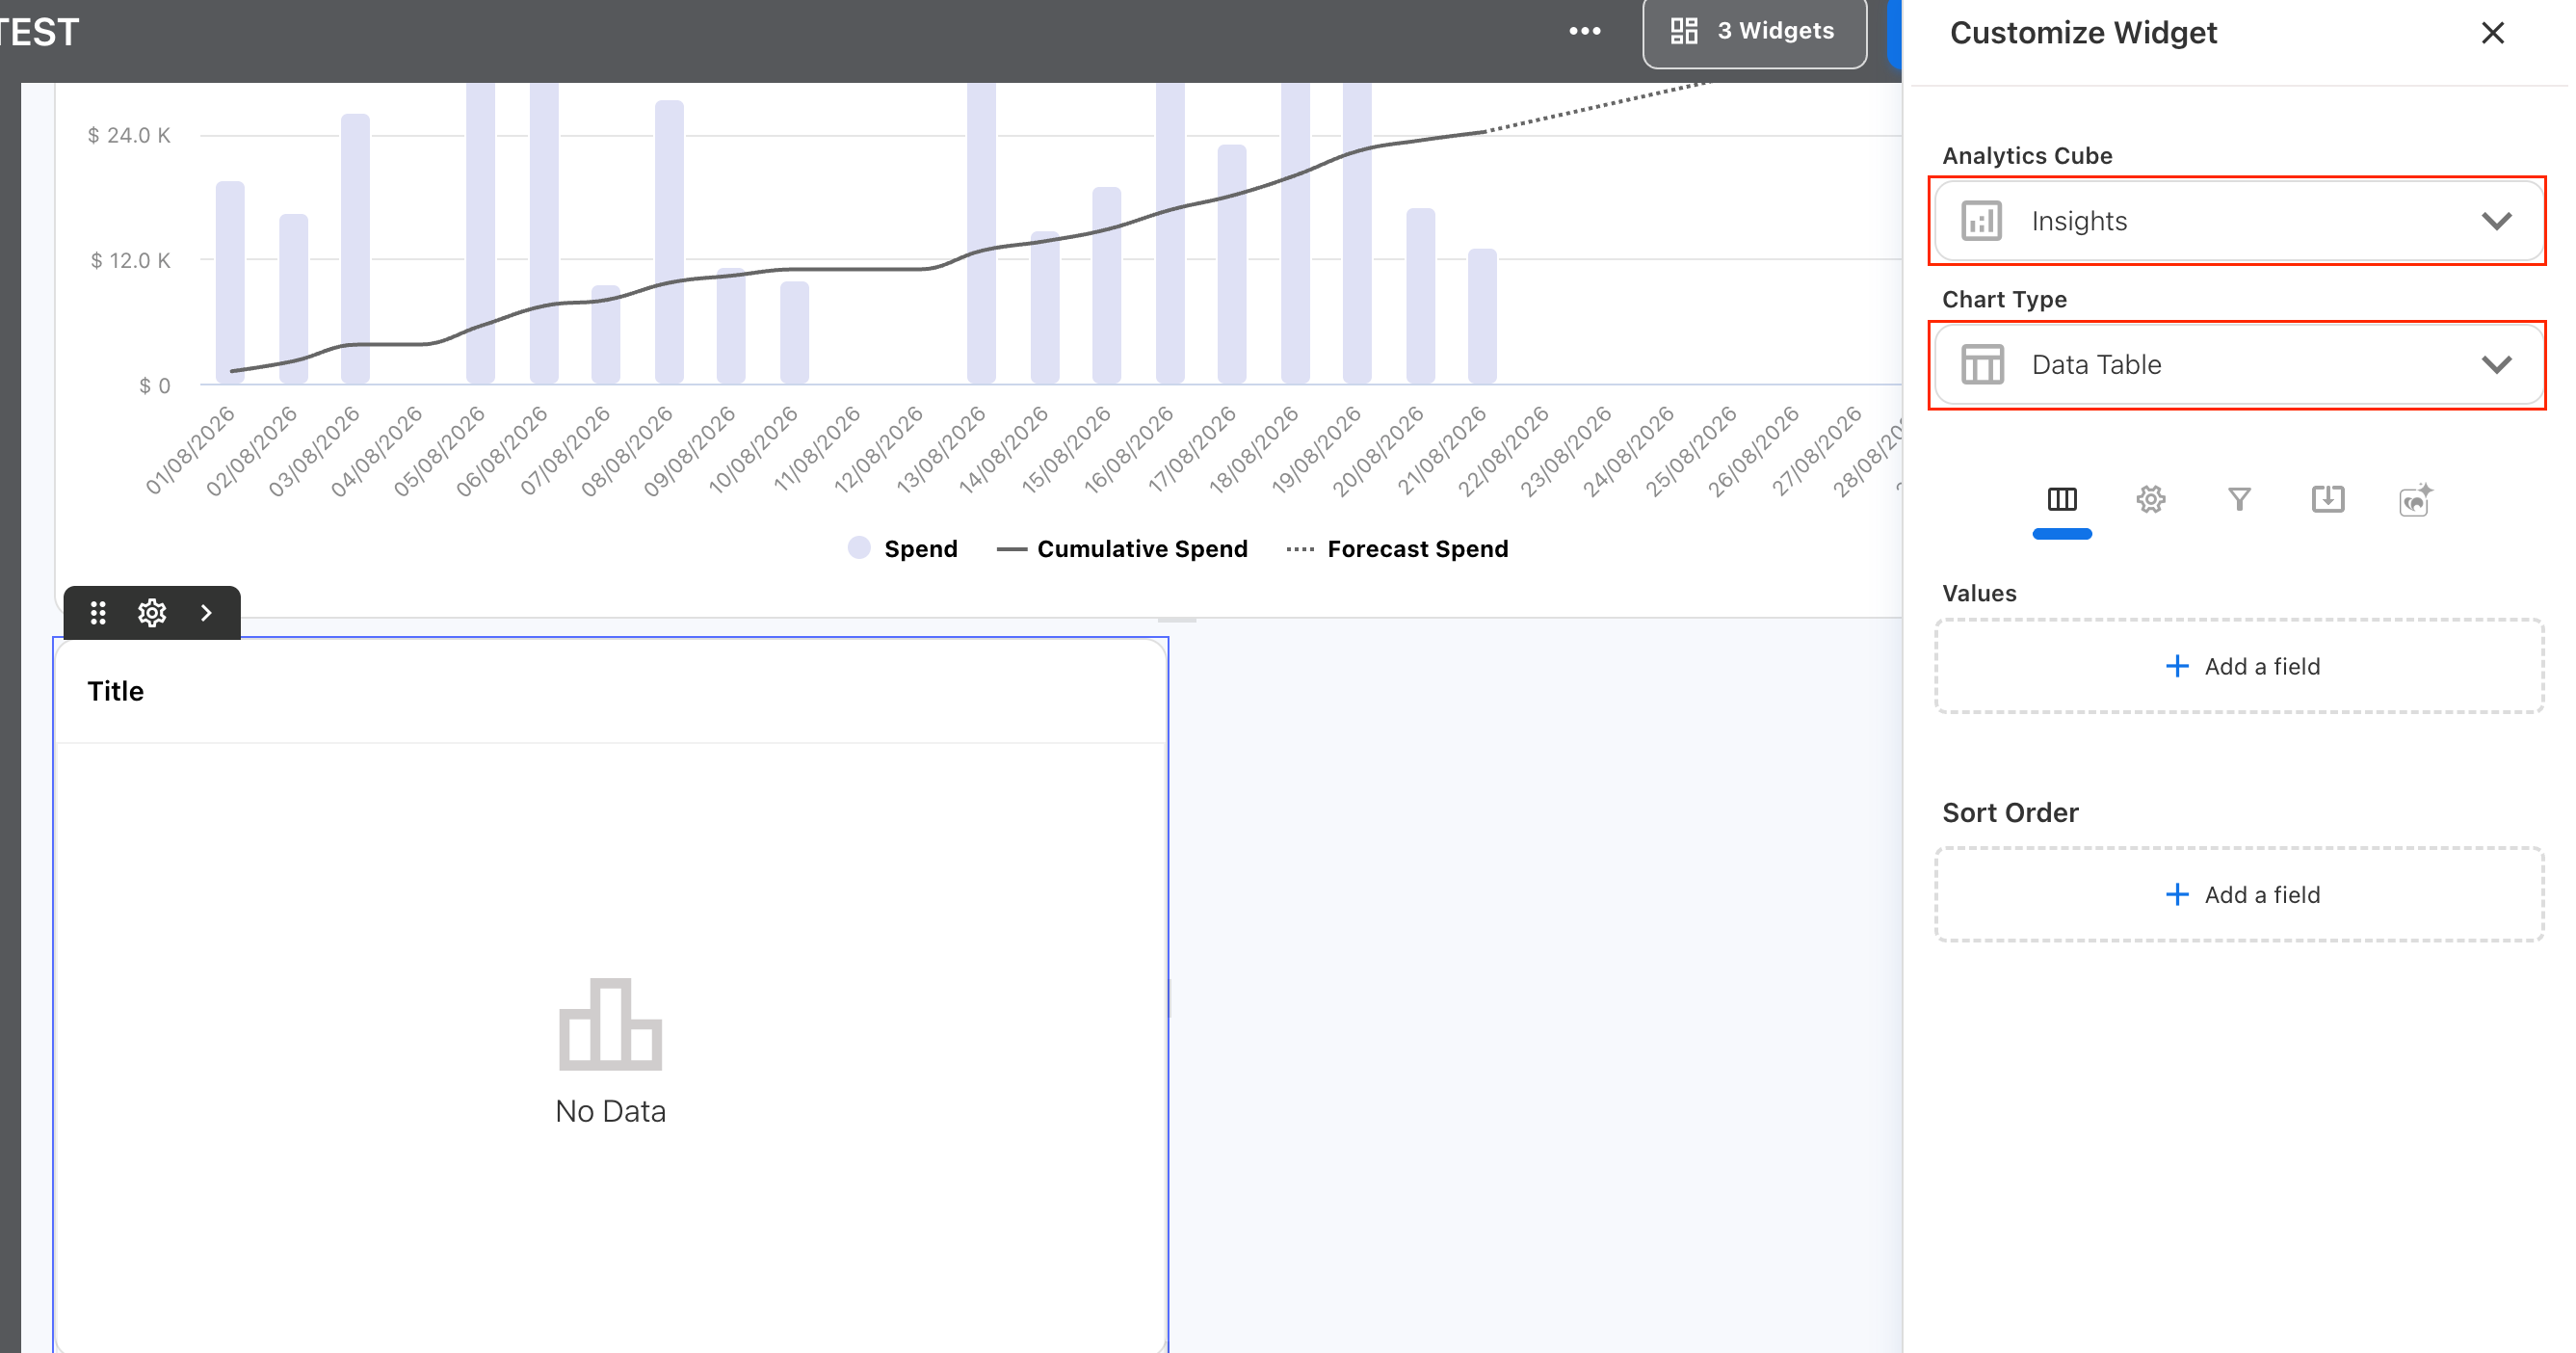
Select the Data Table chart type.
-
Select the Insights Analytics data cube.
-
In Values, select the fields you want to display.
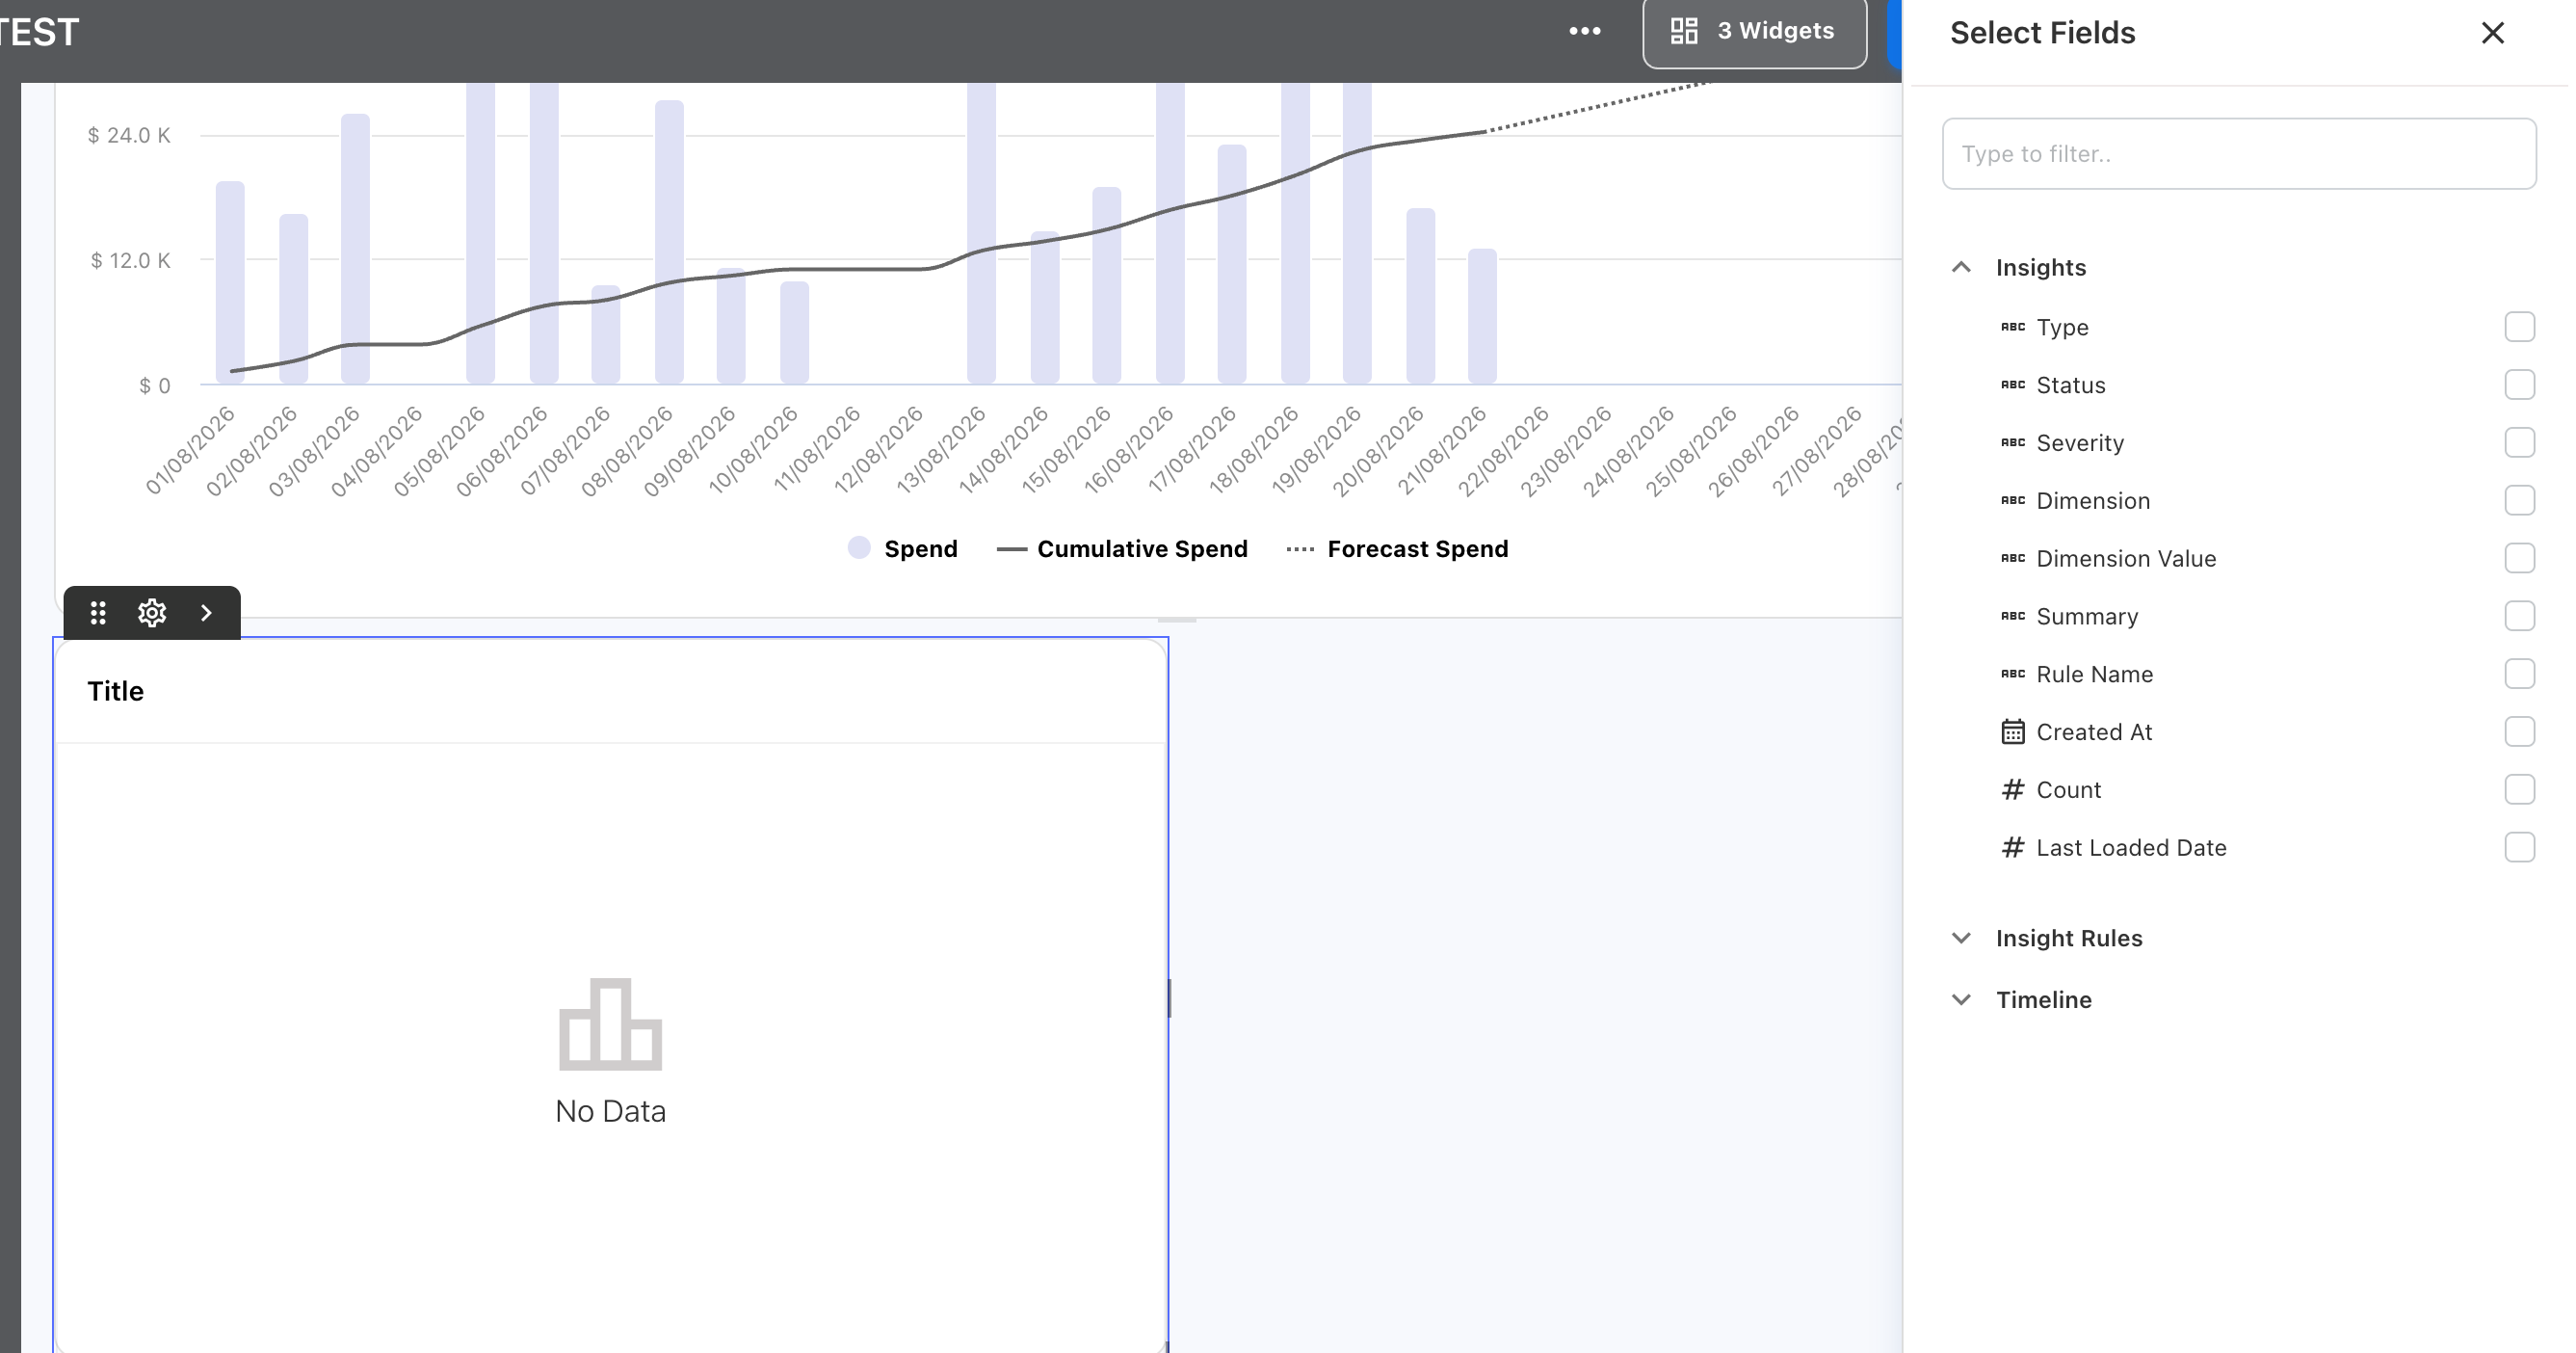
Add atleast one # measure field to light up your visualization.
-
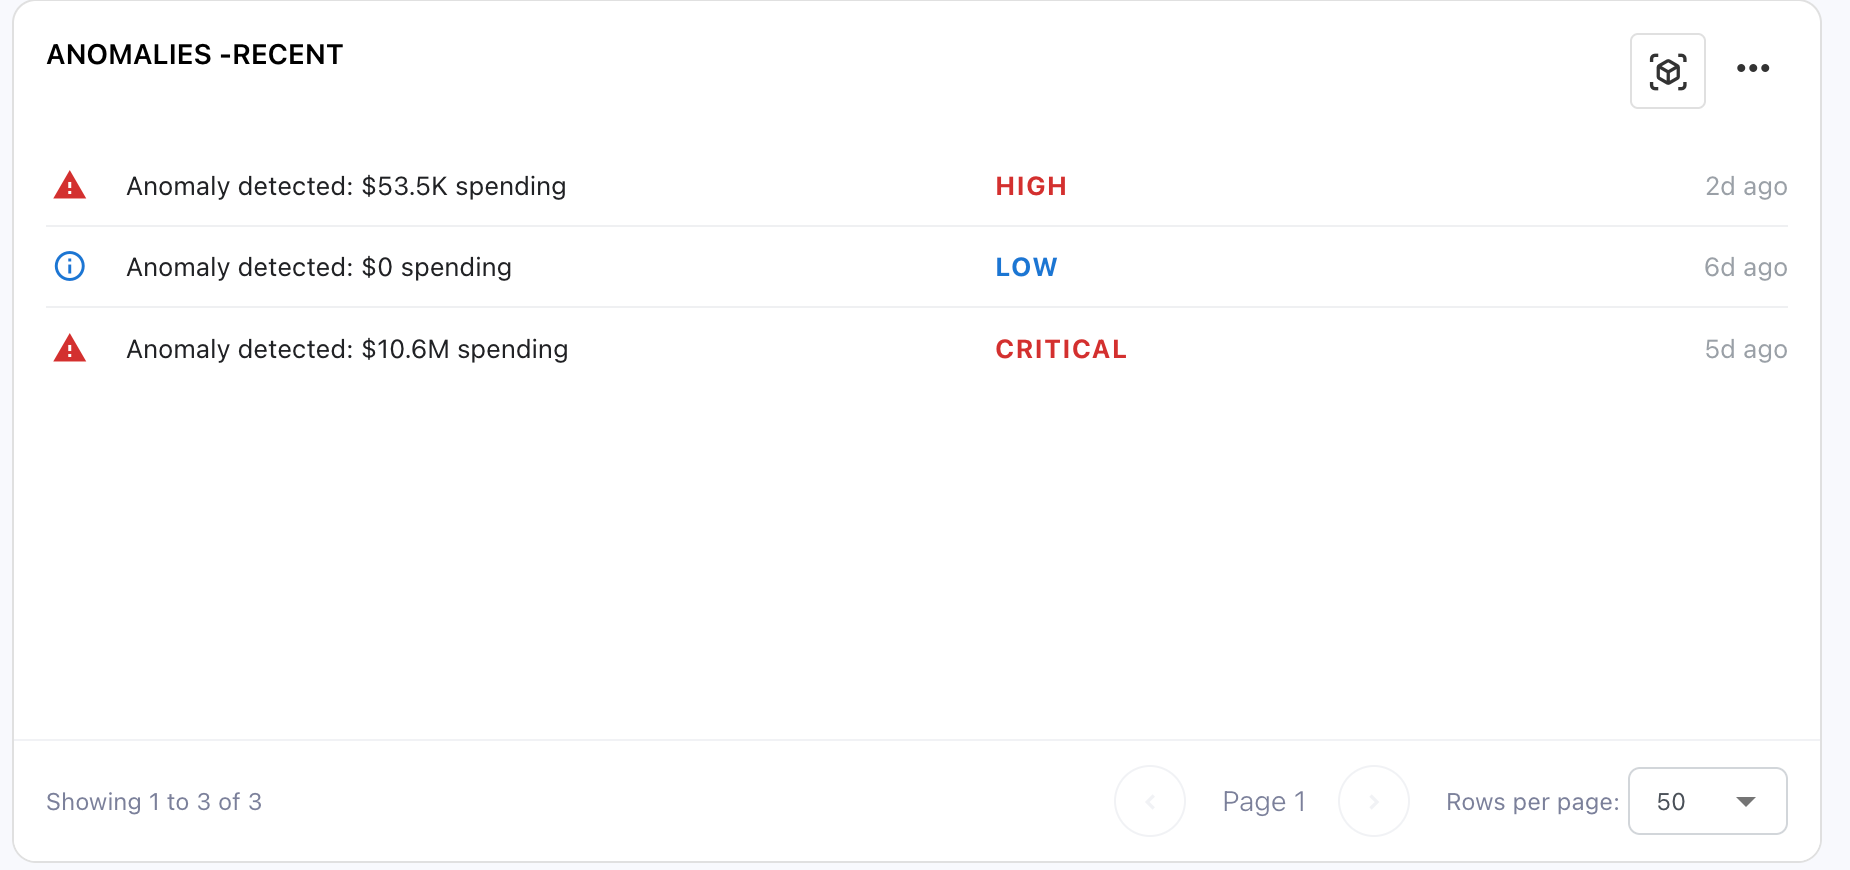
Configure additional fields, filters, or sorting as required.
-
Configure the table display options.
-
Review the widget.
-
Save or finish editing the dashboard.
Choose useful Insight fields
Select fields that help dashboard viewers understand the detected Insight without adding unnecessary detail.
For example, you can combine fields such as:
-
Severity
-
Summary
-
Dimension Value
-
Created At
The fields you choose should match the purpose and audience of the dashboard.
Recommended practices
-
Include only fields that provide useful context for the dashboard.
-
Use filters when the dashboard should focus on specific Insight types, periods, or severity levels.
-
Keep the table focused so important Insights remain easy to identify.
-
Review Insight data alongside the related dashboard metrics before drawing conclusions.
Troubleshooting
The Insight widget does not show any rows
Check the widget filters and confirm that Insights exist for the selected reporting context.
Expected Insight fields are missing
Confirm that the widget uses the Insights Analytics data cube and review the available fields under Values.
The widget shows too much information
Remove fields that do not help explain the Insight. Apply filters or sorting to focus the table on the most relevant findings.
Related content