
KPI widgets help you highlight important measures in a Custom Dashboard. Use them when you want a value to stand out from the surrounding charts and tables.
You can configure the KPI appearance, add an icon, compare the KPI with the prior year, and use forecasting where supported.
At a glance: Configure KPI appearance, add icons, compare values with the prior year, and enable forecasting where supported.
Configure a KPI widget
-
Open the required Custom Dashboard.
-
Select Edit.
-
Add or select the KPI widget you want to configure.
-
Open the widget settings.
-
Configure the available KPI settings.
-
Review the widget.
-
Save or finish editing the dashboard.
Available settings depend on the KPI configuration.
Tip: Available settings depend on the KPI configuration, so some options may not appear for every widget.
Customize a KPI widget icon
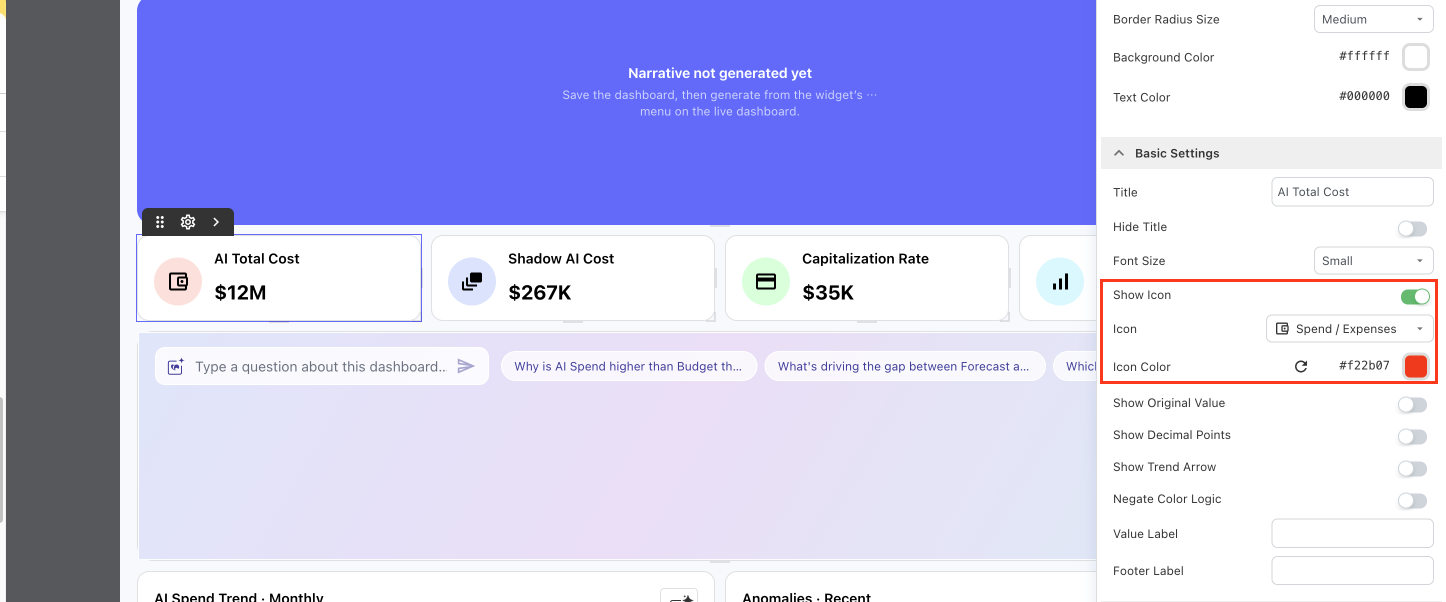
You can add an icon to a KPI widget to make important metrics easier to identify and distinguish on a dashboard.
To customize the icon:
-
Open the required Custom Dashboard.
-
Select Edit.
-
Select the KPI widget you want to update.
-
Open the widget settings.
-
Under Basic Settings, configure the following options:
|
Setting |
Description |
|---|---|
|
Show Icon |
Turn on to display an icon on the KPI widget. Turn off to hide the icon. |
|
Icon |
Select an icon from the available Yarken-styled icon library. |
|
Icon Color |
Select the color used for the icon. Use color to align the icon with the dashboard design or distinguish the KPI. |
-
Review the KPI widget.
-
Save or finish editing the dashboard.
The selected icon appears with the KPI value, helping you identify the purpose of the metric at a glance.
Tip: Use icons consistently across related KPI widgets. For example, use consistent icon styles for spend, budget, forecast, or resource-related metrics.
Compare a KPI with the prior year
Metric KPI widgets can compare the current value with the same metric for the prior year. Use this option to show how a key measure has changed over time without adding separate delta columns.
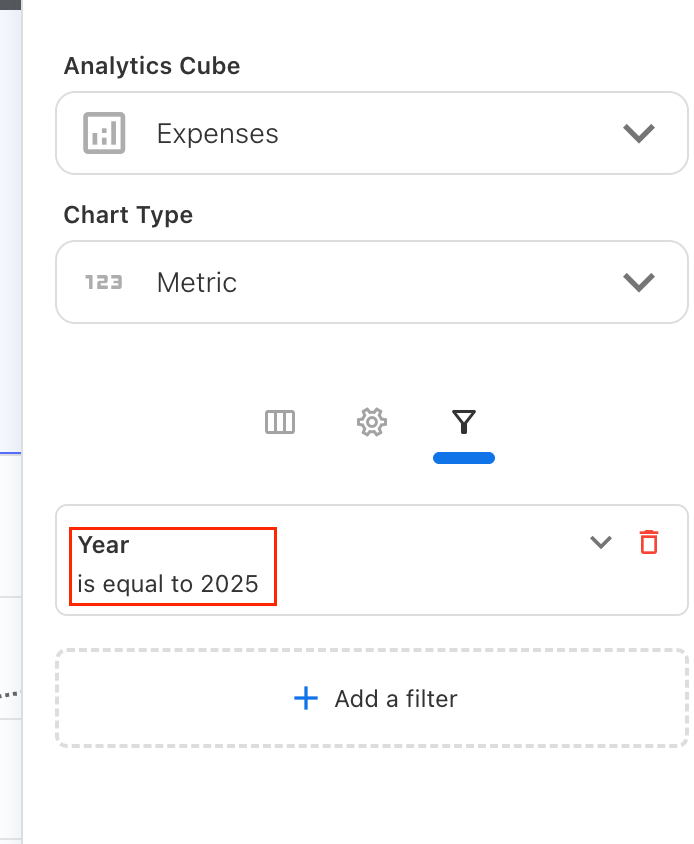
Note: Prior-year comparison is available only for the Metric chart type. Select a specific year in the Year filter before configuring the comparison.
To configure a prior-year comparison:
-
Open the required Custom Dashboard.
-
Select Edit.
-
Select the Metric KPI widget you want to configure.
-
Confirm that a specific year is selected in the Year filter.
-
Open the widget settings.
-
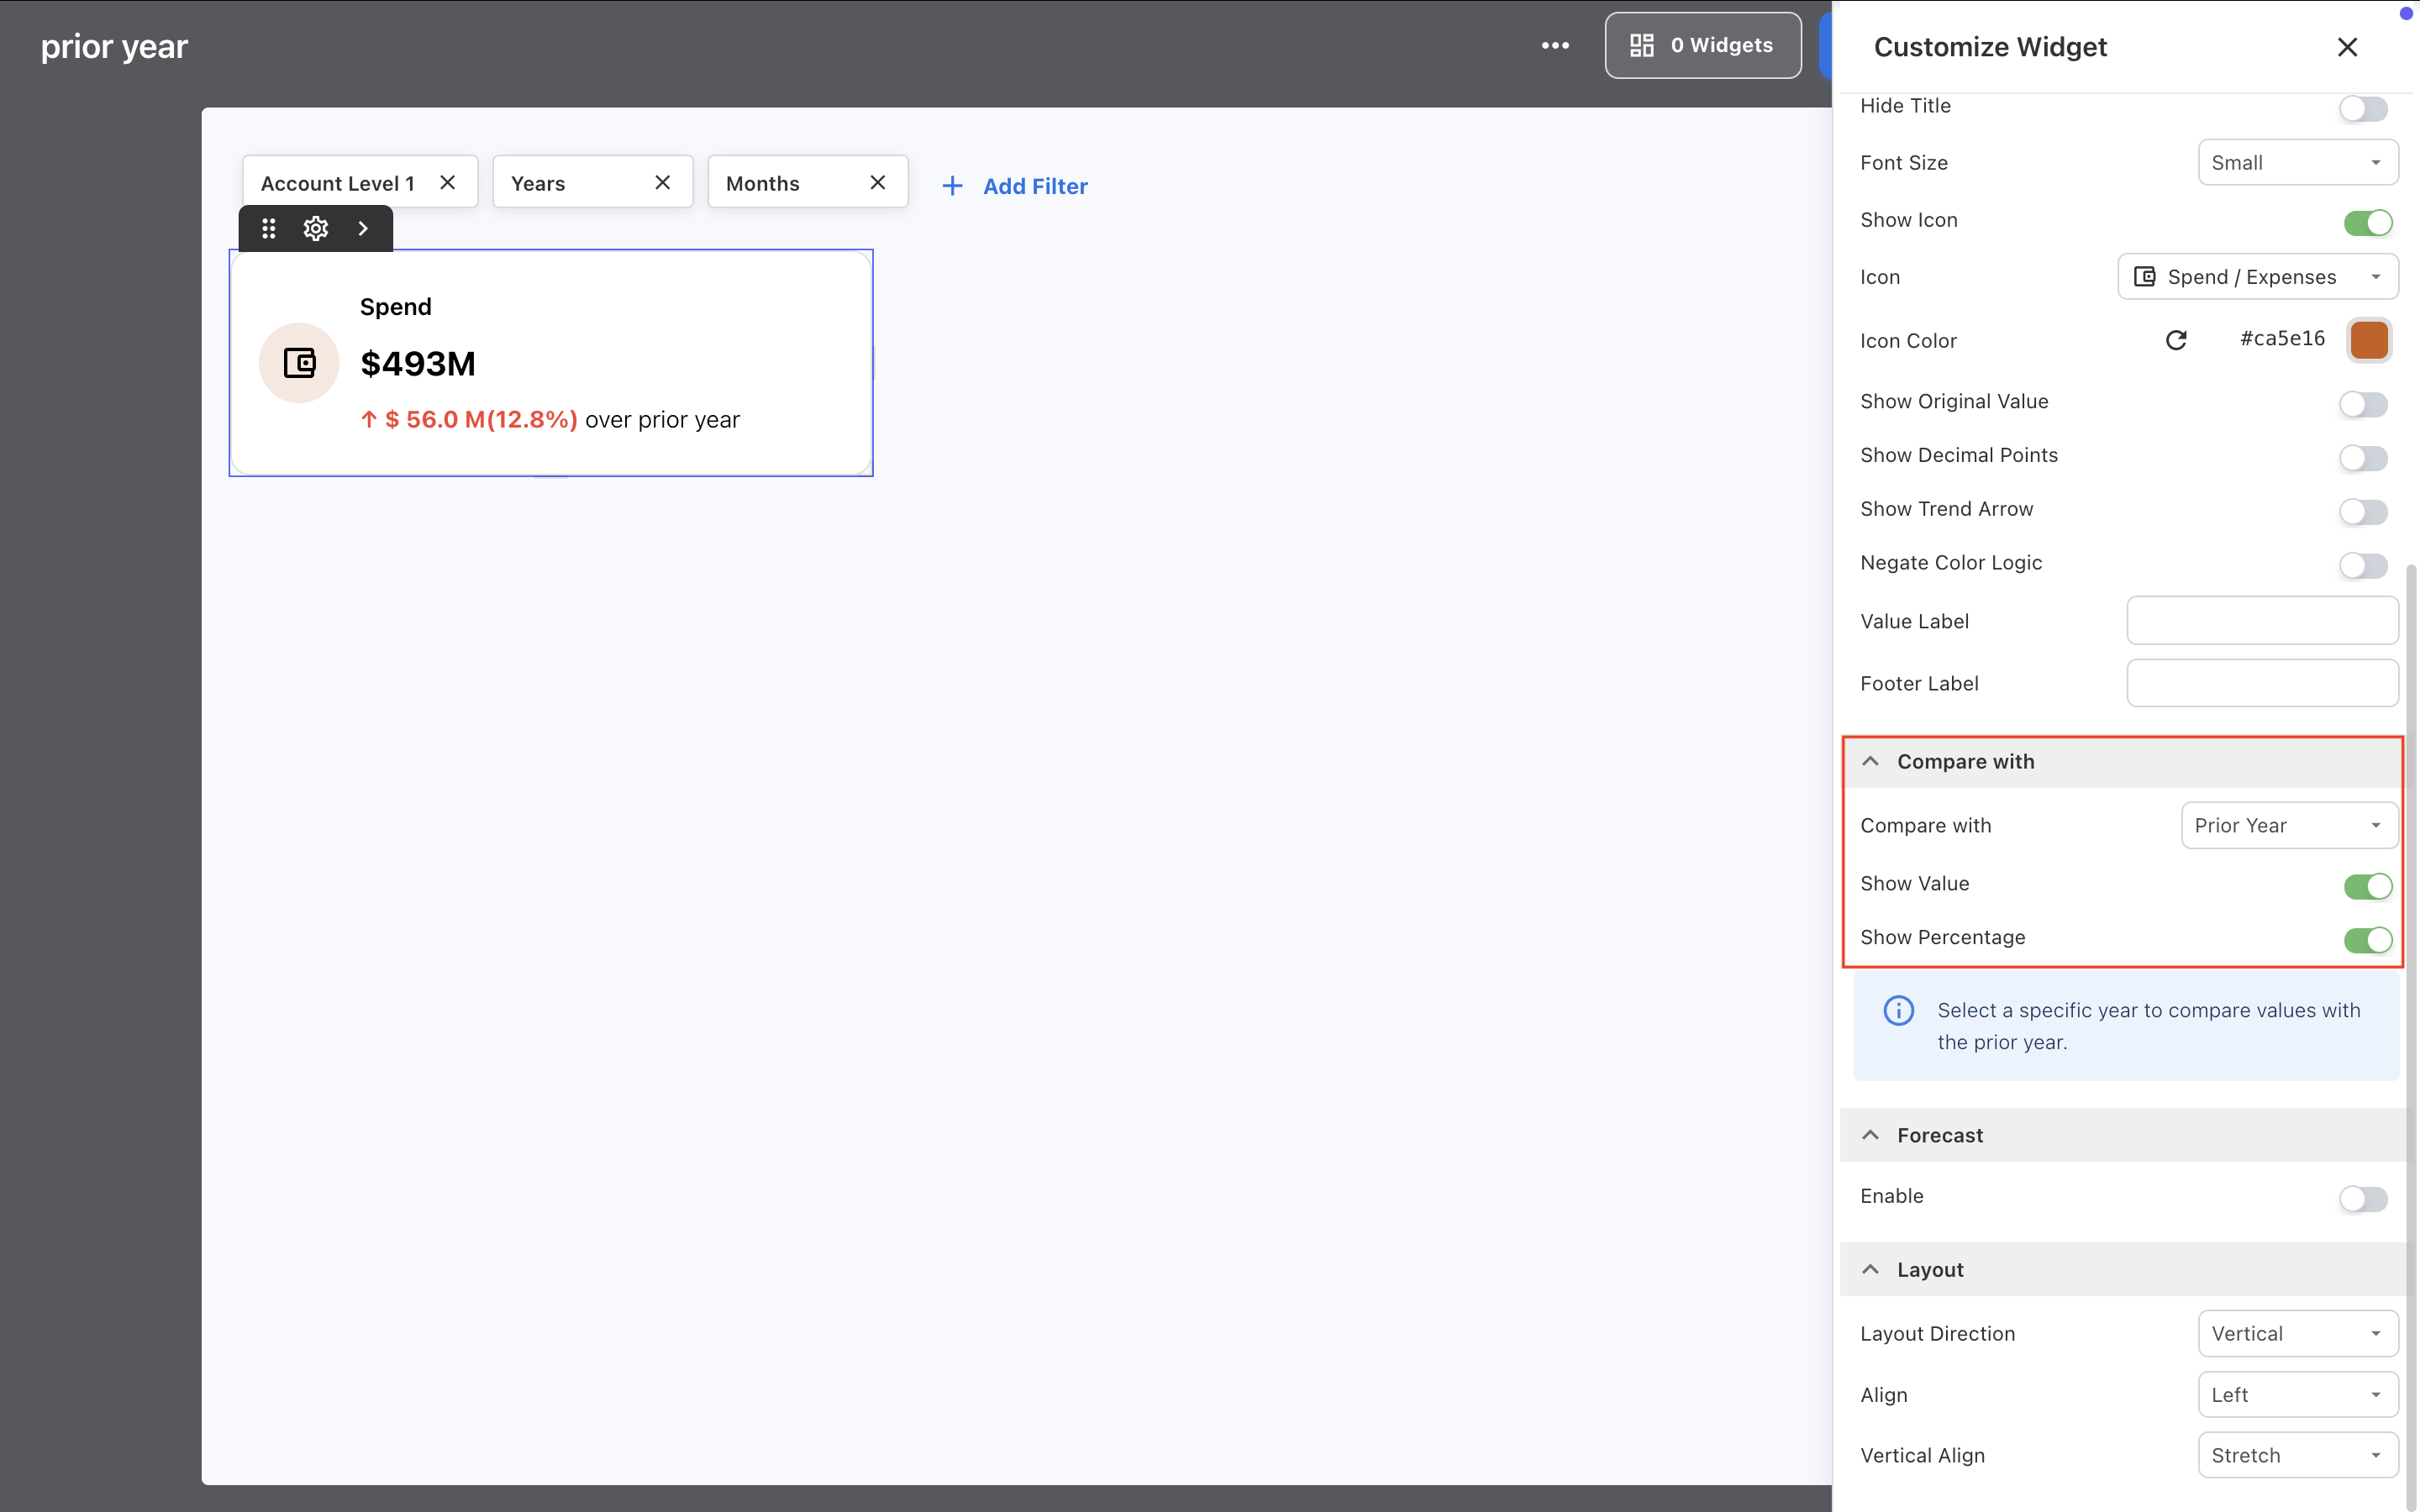
Expand Compare with.
-
In Compare with, select Prior Year.
-
Turn on Show Value to display the difference between the current value and the prior-year value.
-
Turn on Show Percentage to display the percentage change.
-
Turn on both options to display the value and percentage together.
-
Review the KPI and finish editing the dashboard.
The KPI uses prior-year terminology and directional indicators to show whether the current value is above or below the prior-year value.
Result: Prior-year comparison shows whether the current KPI value is above or below the corresponding value from the previous year.
How the comparison works
The comparison uses the KPI's current filter context and compares the selected year with the previous year.
For example, if the Year filter is set to 2026, the KPI compares the current value with the corresponding value for 2025 while retaining the other applicable filters.
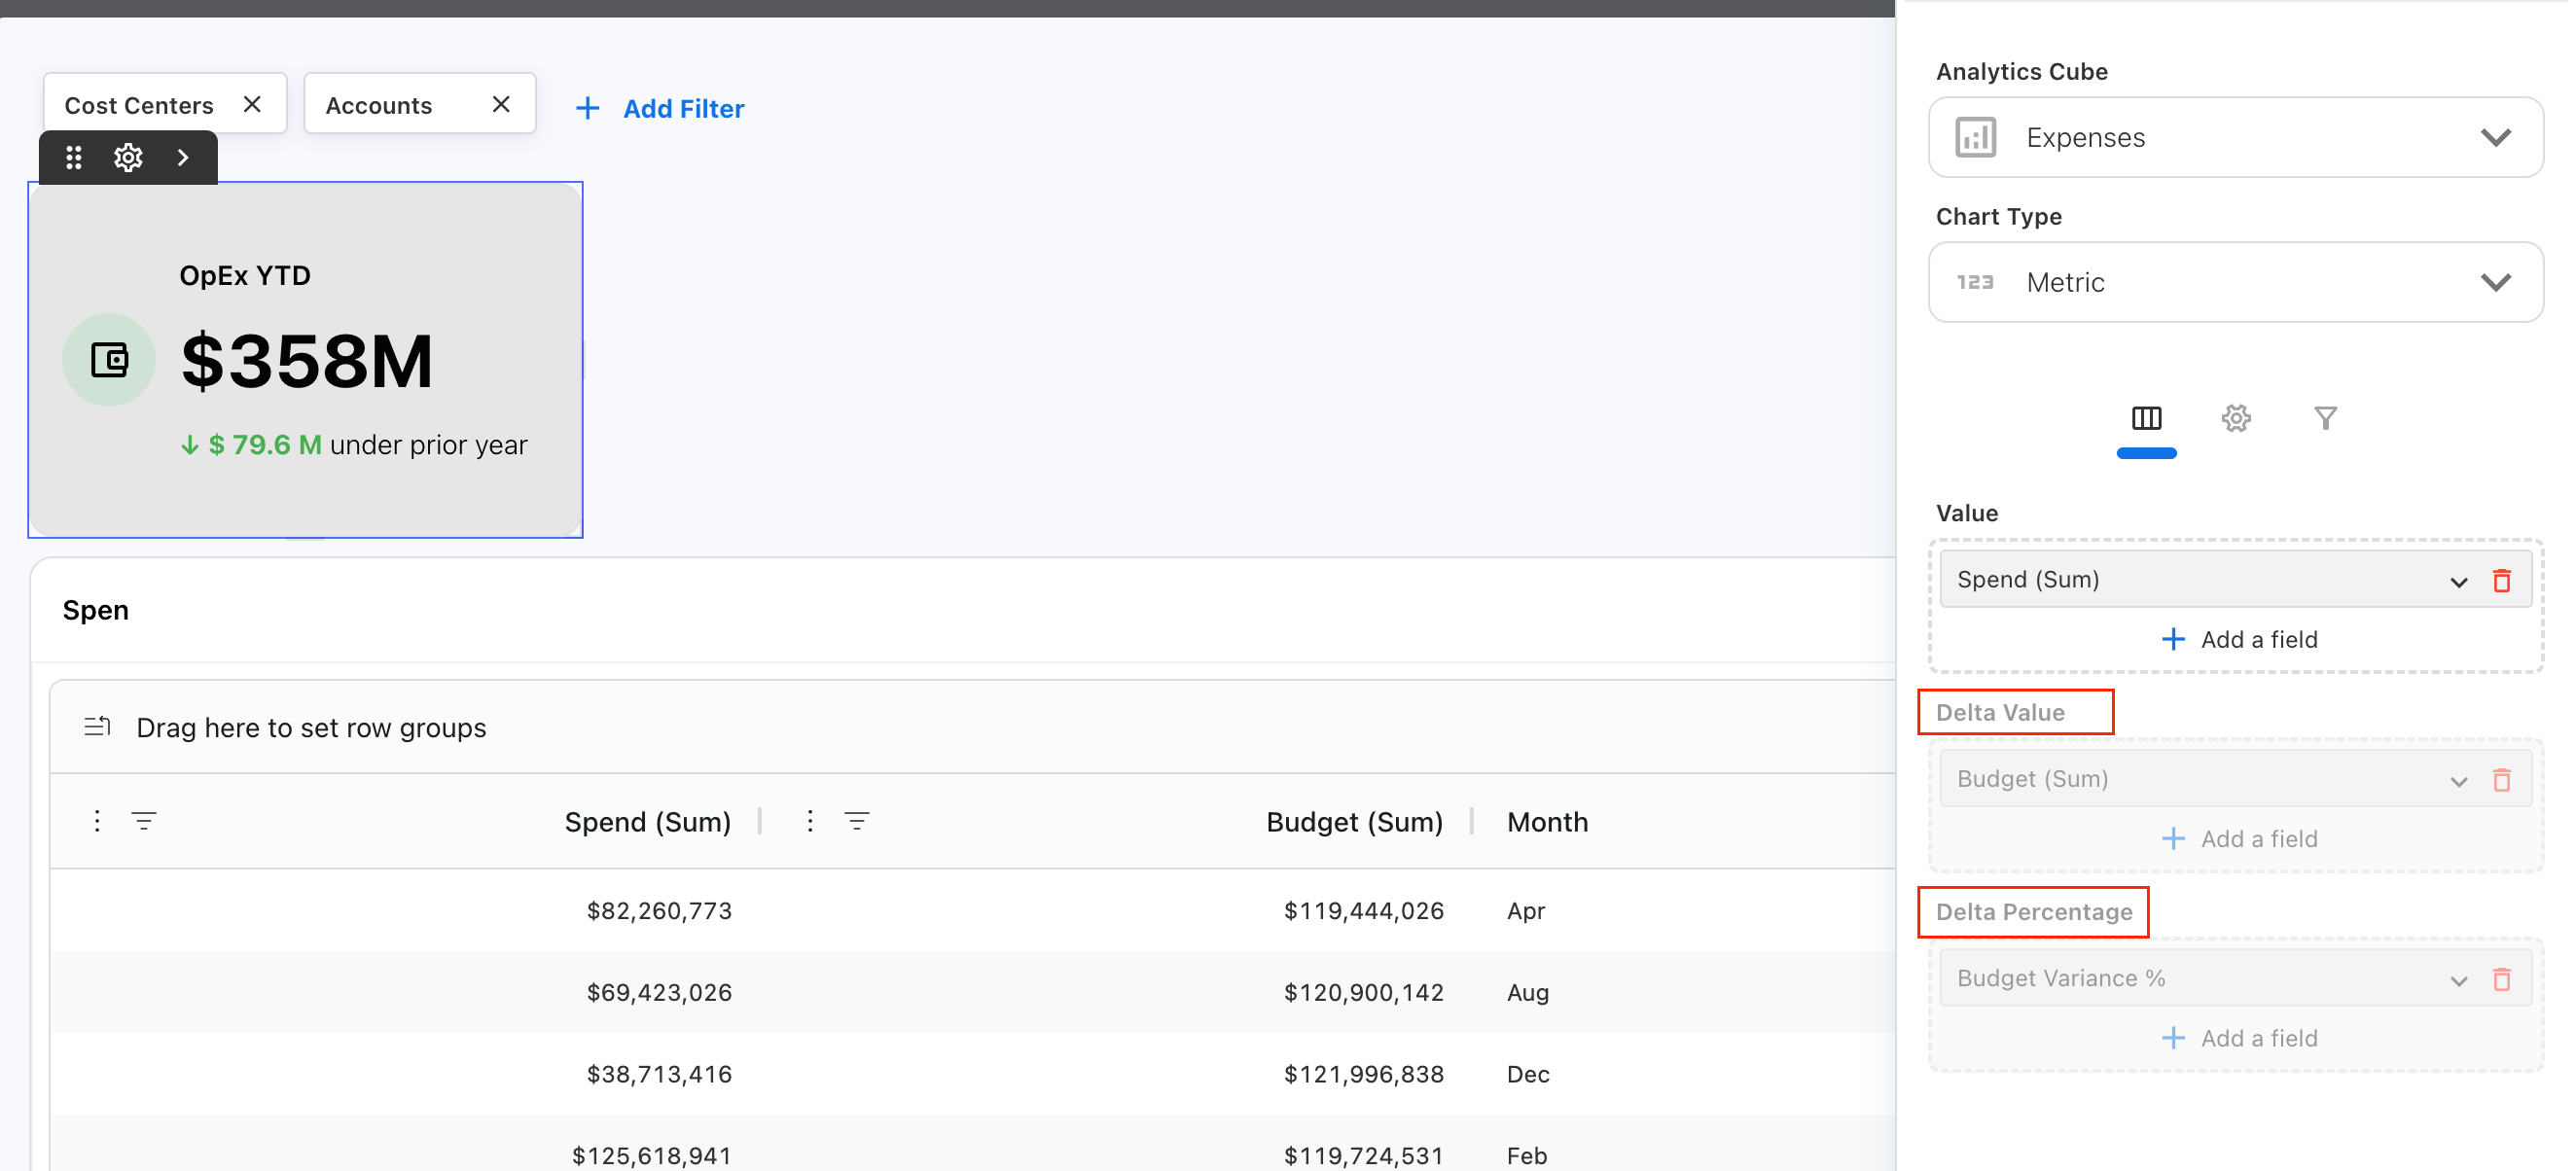
When Prior Year comparison is enabled, the existing Delta Value and Delta Percentage fields are disabled for selection. This prevents duplicate comparison logic in the KPI.
Configure an end-of-year forecast KPI
Use a Metric chart to project the total value of a measure, such as spend or budget, at the end of the financial year.
The forecast uses the cumulative average of the measure across the available periods.
Availability:
-
Forecasting is available for Metric charts and uses the cumulative average across the available periods to project the end-of-year value.
-
Forecasting is unavailable when Compare with is set to Prior Year. To use forecasting, turn off the prior-year comparison.
To configure an end-of-year forecast KPI:
-
Add a widget and select Metric as the chart type.
-
Select the measure to forecast, such as Spend.
-
Open the widget Settings.
-
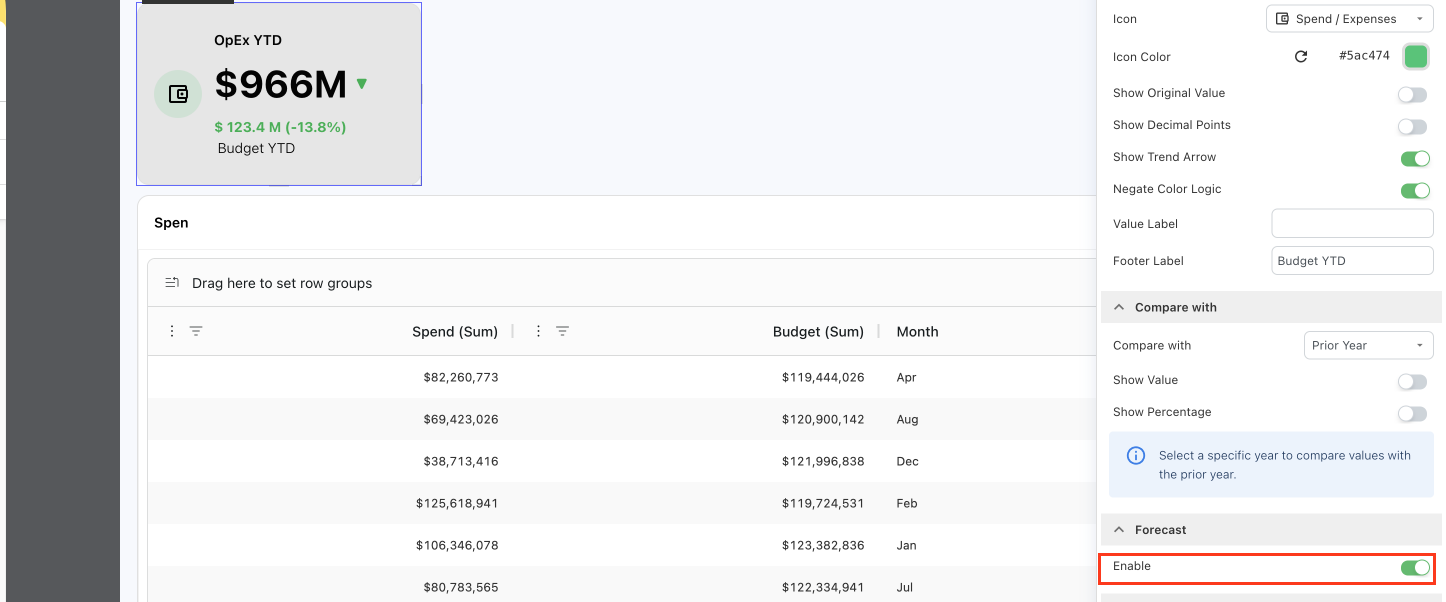
Expand Forecast.
-
Turn on Enable.
-
Review the projected value.
-
Save or finish editing the dashboard.
Recommended practices
-
Use KPI widgets for measures that need immediate attention.
-
Keep KPI titles concise and descriptive.
-
Use icons consistently across related KPIs.
-
Use icon colors to support identification rather than relying on color alone to convey meaning.
-
Select a specific year before using prior-year comparison.
-
Use Show Value and Show Percentage based on the level of comparison detail your audience needs.
-
Validate the underlying measure before using a KPI for financial or executive reporting.
Best practice: Keep KPI configuration consistent across related dashboards so readers can compare metrics quickly and confidently.
Troubleshooting
Quick check: When a KPI result looks incorrect, verify the chart type, selected measure, active filters, and required settings before changing the widget configuration.
The KPI does not show the expected value
Review the selected measure and active filters. Confirm that the underlying Analytics data is available for the reporting period.
Prior-year comparison is not available or does not show a result
Confirm that the widget uses the Metric chart type and that a specific year is selected in the Year filter. Also confirm that data is available for the prior year.
Delta Value or Delta Percentage cannot be selected
This is expected when Compare with > Prior Year is enabled. Yarken disables these delta fields to avoid applying two comparison methods to the same KPI.
The KPI icon does not appear
Confirm that Show Icon is enabled and an icon is selected under Basic Settings.
The forecast value is not available
Confirm that the widget uses the Metric chart type, the required measure is selected, and Forecast > Enable is turned on.
Related content