
Table of Contents
Dashboards
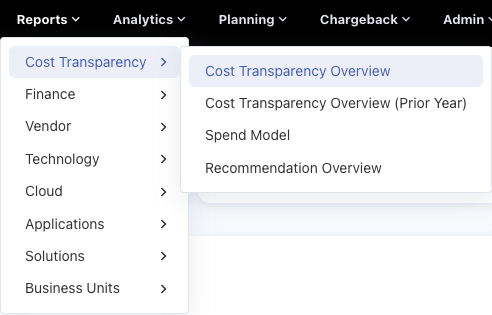
For opening the Dashboards, Hover or Click on Reports. Hover or Click on the list, and choose the required report from the list
|
Reports >> Choose the type of Dashboard >> Choose Dashboard |
Once selected the dashboard will appear where the charts will appear, along with some two kinds of filters as shown in the picture below.
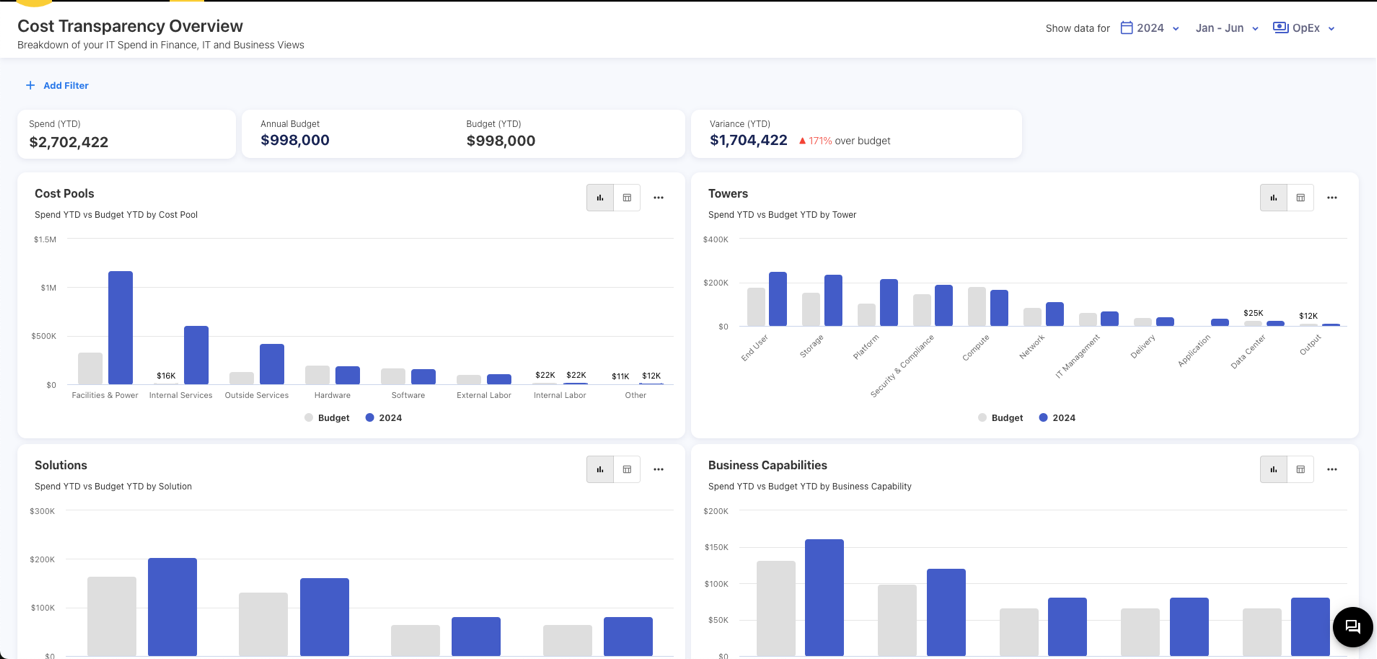
The filters in the page header are unclearable, which means that once choose the filtered it will not be cleared. For Other filter use Add Filter, where you can clear the filter once applied
Session Filters
The filter in the page header which are Year, Month, and Expense Type. The session filters once applied cannot be cleared but can be changed according to requirements of user.
Other Filters
There are other filters, if want to use filters other than year, month and expense type, use + Add Filter, the dropdown will appear so the user can choose the filter name and click on it, once clicked the filter will appear beside the Add Filter, the Default value for every filter is All, but the user can choose the single or multiple choices from the dropdown.
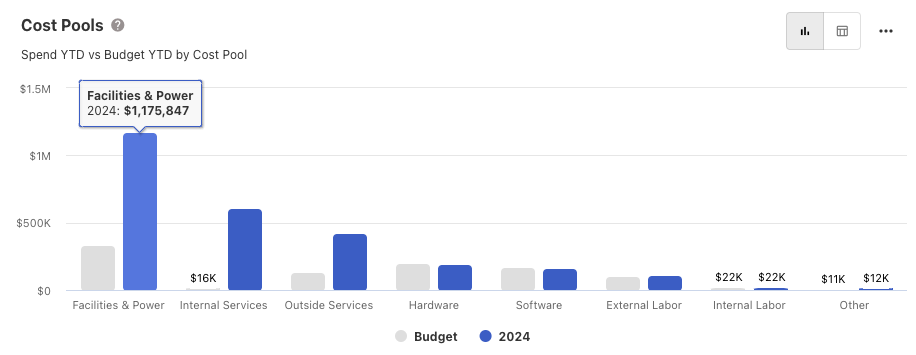
Toggle Button
There is toggle button for every chart can change to table once clicked
Drilldown to Reports
To go to the reports, choose any chart, for example it is a column chart, so click on a column to drilldown to reports. Note that once you add a filter in + Add Filter, that filter will also be drilled into the report, which means if you choose any filter in Dashboard and drill to the Report, that filter will go inside the report.
Reports
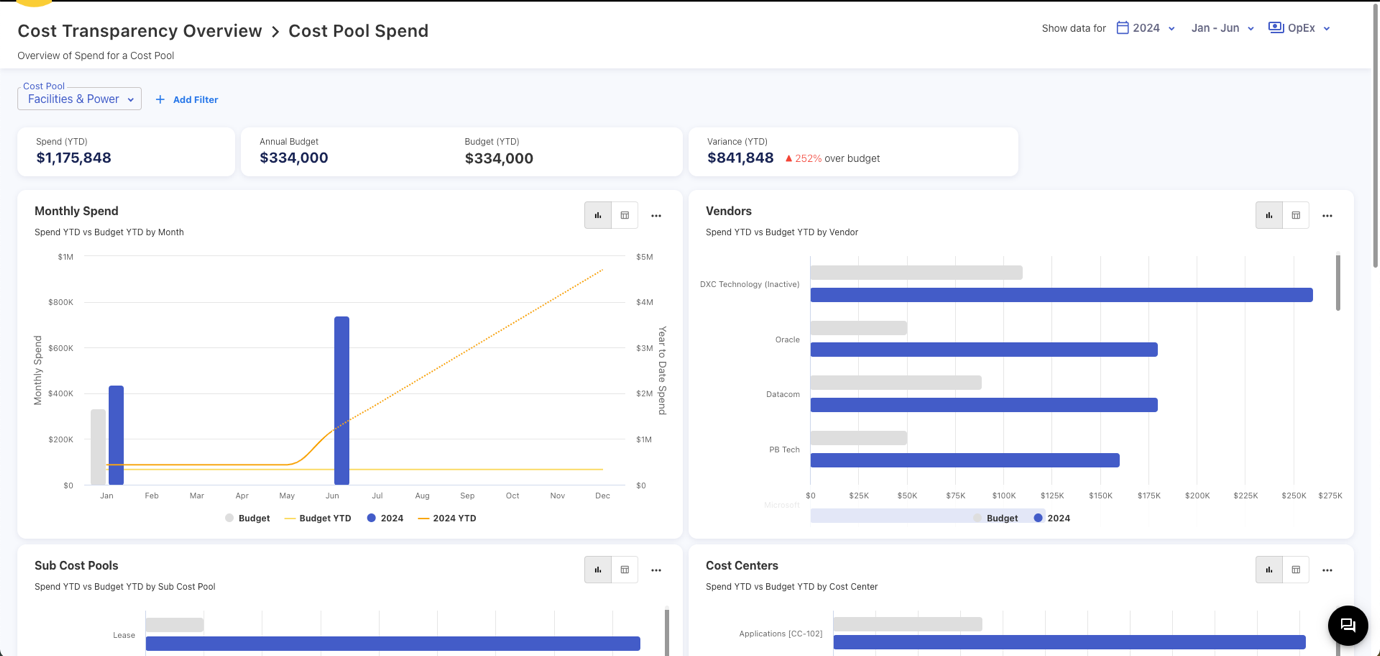
Reports gives the detailed information for particular month or any other like Cost Pools, Towers, Solutions, etc. To go to the reports, choose any chart, for example it is a column chart, so click on a column to drilldown to reports.
Session Filters
The filter in the page header which are Year, Month, and Expense Type. The session filters once applied cannot be cleared but can be changed according to requirements of user.
Other Filters
There are other filters, if want to use filters other than year, month and expense type, use + Add Filter, the dropdown will appear so the user can choose the filter name and click on it, once clicked the filter will appear beside the Add Filter, the Default value for every filter is All, but the user can choose the single or multiple choices from the dropdown. Some of the filters will come from dashboard, there are two types of filters, type one are filters which we select from the graph, as shown from the graph, other type is other filters either for this reports or filter coming from the dashboards.
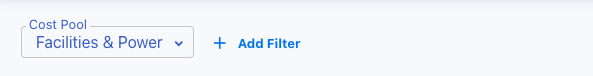
Here the Cost Pool filter containing Facilities & Power as value is coming from the Cost Pool column graph where we selected the Facilities & Power, as it is visible that we cannot clear this filter, instead we can filter the other filters but not this one.
Toggle Button
There is toggle button for every chart can change to table once clicked
Drilldown to Popups
To go to the popups, choose any chart, for example it is a column chart, so click on a column to drilldown to popups. Note that once you add a filter in + Add Filter, that filter will also be drilled into the popup, which means if you choose any filter in Report and drill to the popup, that filter will go inside the popup.
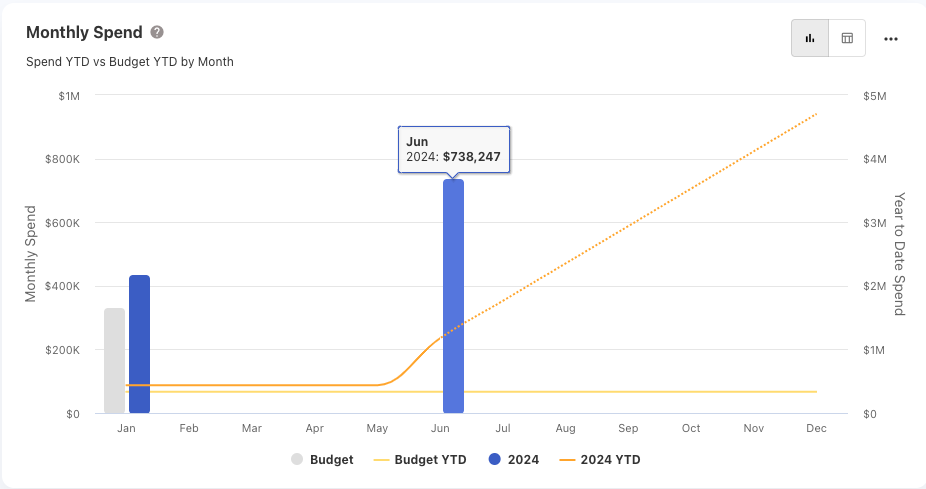
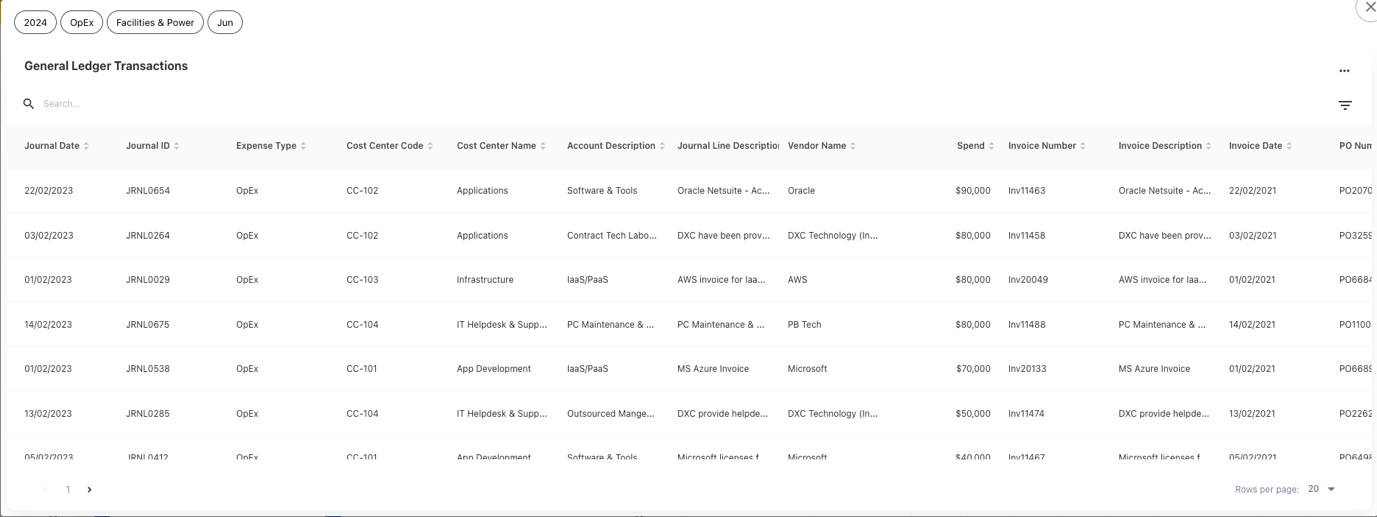
Here, the June month is selected which will open this popup.
FAQ’s
1. How do I open a dashboard in YäRKEN?
To open a dashboard, navigate to the Reports section by either hovering over or clicking on it. Then, select the type of dashboard you need from the list.
2. What are Session Filters, and how do they work?
Session Filters are located in the page header and typically include options like Year, Month, and Expense Type. Once applied, these filters cannot be cleared, but they can be changed to meet the user's needs.
3. How can I apply other filters to my dashboard?
In addition to Session Filters, you can apply other filters using the + Add Filter option. This will open a dropdown where you can select the filter name. The default value for all filters is set to "All," but you can choose single or multiple options from the dropdown.
4. Can I clear filters once they are applied?
Session Filters cannot be cleared, but they can be modified. Other filters applied via + Add Filter can be cleared or adjusted as needed.
5. What is the purpose of the Toggle Button in the dashboard?
The Toggle Button allows you to switch between different views of a chart. For example, you can change a chart to a table format by clicking the Toggle Button.
6. How do I drill down from a dashboard to a report?
To drill down into a report from a dashboard, click on any chart, such as a column chart, and select a specific element (e.g., a column). The data will then be drilled down into the corresponding report, with any filters applied in the dashboard carried over to the report.
7. What detailed information can I get from reports?
Reports provide detailed information for specific periods or categories, such as months, Cost Pools, Towers, Solutions, etc. You can drill down into these reports by clicking on a specific chart element.
8. How can I drill down further from a report to popups?
From within a report, you can drill down into popups by clicking on specific chart elements. For example, selecting a month like June in a column chart will open a popup with detailed information.
9. Can filters from a dashboard be applied to reports?
Yes, filters applied in the dashboard will be carried over to reports when you drill down. This ensures consistency in the data viewed across different levels.
10. What is the difference between Session Filters and other filters?
Session Filters are fixed filters in the page header that cannot be cleared, only changed. Other filters are more flexible, allowing users to add, clear, or modify them as needed through the + Add Filter option.